Title:
A MINIMUM UNIT PRICE FOR ALCOHOL
IA No: HO
Lead department or agency: HOME OFFICE
Other departments or agencies:
DEPARTMENT OF HEALTH, HM TREASURY, HM REVENUE AND CUSTOMS
Impact Assessment (IA)
Date: 1 November 2012 Stage: Consultation
Source of intervention: Domestic Type of measure: Primary legislation Contact for enquiries:
Rebecca Whitfield, Home Office
Summary: Intervention and Options
RPC Opinion:
AMBER
Cost of Preferred (or more likely) Option Total Net Present
Value
Business Net Present Value
Net cost to business per year (EANCBon 2009 prices)
In scope of One-In, One-Out?
Measure qualifies as
£352m* -£9.6m £1.0m Yes IN
What is the problem under consideration? Why is government intervention necessary?
Alcohol misuse costs around £21 billion per year and is associated with a range of related harms. There is consistent evidence that limiting the availability of alcohol through an increase in price leads to a reduction in consumption, and in turn, reductions in alcohol related harm. Currently, there is no minimum price threshold in place that prevents retailers from selling alcohol at very low or heavily discounted prices. Government intervention, as set out in the Alcohol Strategy, would therefore set a minimum unit price (MUP) for alcohol and increase the price of alcohol sold at very low or heavily discounted prices. What are the policy objectives and the intended effects?
The objective of minimum unit pricing is to reduce the consumption of alcohol by harmful and hazardous consumers in particular, whilst minimising the impact on responsible consumers. This will be achieved by increasing the price of alcohol sold at very low or heavily discounted prices. The intended effect is to reduce the harms associated with excessive consumption such as the number and associated costs of alcohol related crimes; alcohol related health problems, and deaths due to alcohol. Minimum unit pricing is a targeted policy and forms part of a comprehensive package of measures as set out in the Government‟s Alcohol Strategy.
What policy options have been considered, including any alternatives to regulation? Please justify preferred option (further details in Evidence Base)
MUP is part of a comprehensive approach to tackle harmful drinking. It is taken on top of, not instead of, other regulatory and non regulatory measures to achieve the necessary impact. The level of impact will be determined by the MUP set out in legislation. The Government has recommended a price level of 45p per unit of alcohol and will consult on this level.
Option 1: Do nothing
Option 2: Introduce a minimum unit price for alcohol (preferred option). The Government is consulting on the basis of a recommended 45p minimum unit price. This Impact Assessment is therefore based on a price level of 45p per unit of alcohol.
*The NPV contains estimates based on two different models which are not directly comparable.
Will the policy be reviewed? It will be reviewed. If applicable, set review date: To be confirmed through consultation Does implementation go beyond minimum EU requirements? Yes
Are any of these organisations in scope? If Micros not exempted set out reason in Evidence Base.
Micro Yes < 20 Yes Small Yes Medium Yes Large Yes What is the CO2 equivalent change in greenhouse gas emissions?
(Million tonnes CO2 equivalent)
Traded: N/A
Non-traded: N/A
I have read the Impact Assessment and I am satisfied that, given the available evidence, it represents a reasonable view of the likely costs, benefits and impact of the leading options.
Summary: Analysis & Evidence
Policy Option 2
Description:45pMINIMUM UNIT PRICING FULL ECONOMIC ASSESSMENT Price Base Year: 2014/15 PV Base Year: 2014/15 Time Period Years: 10
Net Benefit (Present Value (PV)) (£m)
Low: 343 High: 361 Best Estimate: 352
COSTS (£m)
Total Transition (Constant Price) YearsAverage Annual (excl. Transition) (Constant Price)
Total Cost (Present Value) Low 2.9 1 200 1,730 High 16.6 201 1,740 Best Estimate 9.7 200 1,740
Description and scale of key monetised costs by ‘main affected groups’
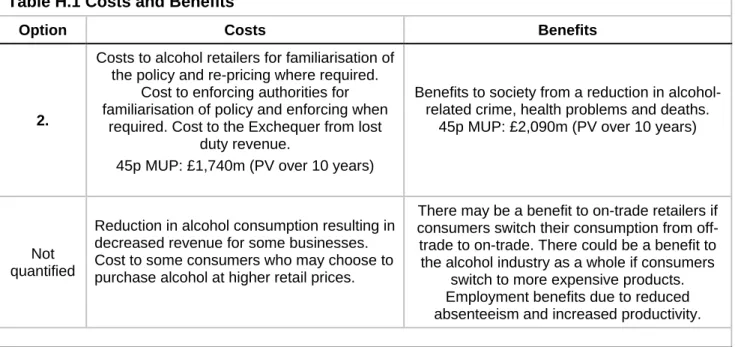
Transition costs – retailers will familiarise themselves with the policy and change prices to comply with the MUP- £9.6m. There will be an annual cost to the public sector for enforcement- £0.5m. Reduced revenue for the Exchequer from alcohol duty receipts - £200m per annum.
Other key non-monetised costs by ‘main affected groups’
There could be material and stationery costs to business for re-pricing products on shelves and displays. There would be a cost to business as a result of lost alcohol sales as well as potential losses from restrictions placed on loss-leading pricing strategies. Whilst the impact on business revenue has been estimated, the change in business costs as a result of a change in consumption will have an impact on business profits which could not be quantified at this stage.
BENEFITS (£m)
Total Transition (Constant Price) YearsAverage Annual (excl. Transition) (Constant Price)
Total Benefit (Present Value) Low 1 High Best Estimate 233 2,090
Description and scale of key monetised benefits by ‘main affected groups’
Benefits to health bodies (through a reduction in hospital admissions and NHS costs) - £220m (average annual saving over 10 years). Benefits to society, for example to victims, the police and the criminal justice system (through a
reduction in alcohol related crime) - £12.9m per annum. Please note that these benefits are not fully “cashable” and actual financial savings could be significantly lower.
Other key non-monetised benefits by ‘main affected groups’
There may be a benefit to business if consumers substitute currently cheaper alcohol for more expensive alcohol. There may be a benefit to business if consumers switch their expenditure from alcohol to other goods. There is expected to be some benefit to the on-trade with consumers switching their consumption from off-trade to on-trade. As explained above, business profit cannot be quantified. There is expected to be benefits to business and society as a whole from a reduction in absenteeism and an increase in productivity.
Key assumptions/sensitivities/risks Discount rate (%)
Discount rate (%)
3.5 Consumption is expected to fall by 3.3%. There is a risk that consumers could maintain their current consumption levels to a greater degree than the evidence suggests thereby having a more limited effect on consumption. It is possible that lower strength products may be produced by the alcohol industry as these would retail more cheaply. This would reduce harmful levels of drinking and limit the loss of revenue to the alcohol industry.
BUSINESS ASSESSMENT (Option 2)
Direct impact on business (Equivalent Annual) £m: In scope of OIOO? Measure qualifies as
Evidence Base (for summary sheets)
A. Strategic Overview
A.1 Background
This consultation stage Impact Assessment assesses the introduction of a minimum unit price (MUP) for alcohol in England and Wales.
Coalition commitment
The Coalition Programme for Government committed to tackling the harmful use of alcohol. The commitments were:
Banning the sale of alcohol below cost price.
Reviewing alcohol taxation and pricing to ensure it tackles binge drinking without unfairly penalising responsible consumers, pubs and important local industries.
Overhauling the Licensing Act to give local authorities and the police much stronger powers to remove licences from, or refuse to grant licences to, any premises that are causing problems.
Allowing councils and the police to shut down permanently any shop or bar found to be persistently selling alcohol to children.
Doubling the maximum fine for under-age alcohol sales to £20,000.
Permitting local councils to charge more for late-night licences to pay for additional policing. The Government‟s Alcohol Strategy
On 23 March 2012 the Government launched its Alcohol Strategy which aims to radically reshape the approach to alcohol and reduce the number of people drinking to excess. The Alcohol Strategy is targeted at harmful and hazardous consumers and aims to limit the impact on responsible consumers. The Alcohol Strategy contains a commitment to introduce a MUP for alcohol and the Government will consult on a recommended price level.
The Government has previously introduced a range of measures with the aim of tackling the harms caused by excessive alcohol consumption. This includes significant reforms to the Licensing Act 2003 and work with industry through the Responsibility Deal. However, excessive alcohol consumption and unacceptable levels of crime and health harms remain an issue. Therefore, MUP will be introduced as part of a wider package of measures to target harmful drinking. It is taken on top of, not instead of, other measures including non-regulatory measures to achieve the necessary impact. These measures, as outlined in the Alcohol Strategy, include addressing alcohol advertising, piloting sobriety schemes, and continuing work with the industry through the Responsibility Deal to implement pledges to market, advertise and sell their products in a responsible way.
The Government considered a number of pricing policies throughout the development of the Alcohol Strategy including MUP and a ban on the sale of alcohol below Duty+VAT. The commitment to introduce a minimum unit price is taken in addition to, not instead of, the use of taxation. The Government has already take action to tackle the availability of heavily discounted alcohol through taxation including by raising alcohol duty by 2% above retail inflation (RPI) each year to 2014-15.
There are three main reasons for preferring MUP over using alcohol duties to achieve the same impact on alcohol prices:
1. MUP is a more targeted approach to address the problems of cheap alcohol; EU rules prevent alcohol duties being linked to their sale price. A rise in alcohol duty would affect all types of alcohol products, including the most expensive products. A MUP is intended to specifically target the sale of cheap alcohol products.
2. Alcohol duties alone could not bring about a system of minimum pricing as EU rules prevent wine and cider duties being directly linked to their alcohol content;
3. There is no requirement for retailers to pass through higher duties into prices, so higher duties will not automatically raise the price of cheap alcohol, and some evidence that in practice prices do not always rise to reflect higher duties.
It is therefore expected that MUP will be the most effective approach in terms of reducing the consumption of harmful and hazardous consumers in particular.
Impact of the wider Alcohol Strategy
It is important to note that there will be impacts (both costs and benefits) from the other policies arising from the Government‟s Alcohol Strategy but for the purpose of this pre-consultation assessment we are appraising MUP in isolation. Impact Assessments will be revised following public consultation to reflect the agreed and combined package of measures being taken forward. Pre-consultation Impact Assessment
This is a pre-consultation Impact Assessment and is based on the best available evidence at the point of publication. We have set out within the Impact Assessment the areas where we hope to increase our evidence base through additional research and the consultation process. Impact estimates (both costs and benefits) therefore remain subject to change.
A.2 Groups Affected
Consumers
Consumers will be affected. The evidence in this Assessment suggests that consumers who drink alcohol at harmful1 and hazardous2 levels will be most affected by MUP. There is expected to be a limited impact on responsible consumers.
Off-trade alcohol retailers
The off-trade refers to premises that are only licensed to sell or supply alcohol for consumption off the premises. This would typically include large chain supermarkets, independent shops and off-licences. The off-trade are expected to be most affected by a requirement to sell all alcohol above the specified MUP as off-trade alcohol products retail more cheaply than alcohol sold in the on-trade.
On-trade alcohol retailers
The on-trade refers to premises licensed to sell or supply alcohol for consumption on the premises. This would include pubs, bars, nightclubs, hotels and restaurants. Alcoholic drinks sold in the on-trade are not typically expected to be affected by MUP as current average retail prices are sold above any MUP considered in this Assessment. In 2010, the average price per unit of alcohol in the on-trade was £1.34.3 However, on-trade retailers that sell alcohol at very low or heavily discounted prices could be affected, for example, through promotions that result in heavily discounted alcohol. Evidence in this Assessment also suggests that the on-trade could benefit from a switch in consumption from the off-trade to the on-trade.
Production supply chain: producers, manufacturers and wholesalers
Producers, manufacturers and wholesalers in the UK and internationally are expected to be affected due to a decrease in the sale of alcohol. This impact will depend on the quantity of alcohol produced by these companies that is sold below the specified MUP. The Government will be undertaking further work on producer impact throughout the consultation process.
Criminal Justice System and the NHS
1
NHS harmful drinking is defined as when a person regularly drinks over more than double the NHS guidelines, i.e. more than 50 units weekly for men or more than 35 units weekly for women.
2
NHS hazardous drinking is defined as when a person regularly drinks over the alcohol (NHS daily guidelines (equivalent to 21 units weekly for men and 14 units weekly for women).), but less than double the guidelines.
3
Any reduction in alcohol-related harms, which includes health harms and crime harms, will benefit the NHS and Criminal Justice System.
Local Government
As is currently the case, enforcing authorities (licensing authorities, the police and Trading Standards) will ensure legal compliance with MUP and to take enforcement action against alcohol retailers that are found to be in breach of the condition.
UK Exchequer
A higher price for some alcoholic drinks is expected to lead to a fall in alcohol consumption. This will directly translate into falling alcohol duty receipts. At the same time, increased alcohol prices could potentially lead to higher VAT receipts if these products continue to be purchased at a higher price.
A.3 Consultation
Within Government
Cabinet Committee clearances were gained for the publication of the Alcohol Strategy in which MUP is a key proposal. These clearances include official and Ministerial level discussions with other Government departments, including the Department of Health, Department for Business, Innovation and Skills, Her Majesty‟s Treasury, HM Revenue and Customs, The Department for Culture, Media and Sport, and the Department for Communities and Local Government.
Public Consultation
This Impact Assessment has been created in advance of a public consultation developed with Government analysts from the Home Office, Department of Health, HM Revenue and Customs and HM Treasury.
Government officials have previously held discussions with local authorities and the alcohol industry to discuss various pricing options, including MUP, a ban on the sale of alcohol below Duty+VAT and taxation. To assist with the effective design of our consultation, officials will continue to hold discussions with representatives from the alcohol industry, licensing authorities, the police and health bodies. This is expected to be in the form of meetings and technical consultations.
B. Rationale
Background
The cost of alcohol misuse in England is estimated to be around £21bn per year made up of the following:4
NHS costs, at about £3.5bn per year at 2009-10 costs5
Alcohol-related crime, at £11bn per year at 2010-11 costs6
Lost productivity due to alcohol, at about £7.3bn per year at 2009-10 costs (UK estimate).7
The impact of alcohol on health is a significant issue. Over the last ten years health harms have continued to grow. Alcohol-attributable deaths in England rose by 7%, from 14,000 in 2001 to 15,000 in 2010. In contrast, deaths from all causes in England fell by 7% over this period. Over the same period, alcohol-specific deaths8 rose by 30%. The rate of liver deaths in the UK has nearly quadrupled over 40 years, a very different trend from most other European countries. Approximately 60% of people with liver disease in England have alcoholic liver disease, which
4
This does not include any estimate for the economic costs of alcohol misuse to families and social networks. 5
The Department of Health has updated the previous estimate of around £2.7bn at 2006-07 prices. 6
The Home Office has recently updated the estimate of the cost of alcohol-related crime: £11 billion in 2010/11 prices. This figure includes the cost of general offences (like violent crime) that are alcohol-related, the cost to the Criminal Justice System of alcohol specific offences (like drink driving) and the cost of issuing Penalty Notices for Disorder. This estimate was arrived at using the same methodology as that which lay behind the widely quoted figure of £8-13 billion in 2006/07 prices. The previous estimate was presented as a range due to a methodological uncertainty, which has now been resolved. Further information is available on request from the Home Office.
7
The Department of Health has updated the previous estimate of around £6.4bn at 2006-07 prices.
8
accounts for 84% of liver deaths.9 In addition, the rate of alcohol-related hospital admissions10 has also continued to rise by an average of 4% each year over the eight years 2002-03 to 2010-11. Alcohol is now one the three biggest lifestyle risk factors for disease and death in the United Kingdom, after smoking and obesity.11
There is also a strong link between alcohol and crime, particularly violent crime. In 2010/11, there were around 930,000 (44%) violent incidents in England and Wales where the victim believed the offender to be under the influence of alcohol, this rose to 58% in instances of stranger violence. Link between alcohol price and harm
No other country has yet implemented a minimum unit price for alcohol. There is, however, a range of evidence12 that supports increasing the price of alcohol in order to reduce alcohol consumption and leading to reductions in alcohol harms, particularly with regard to health harms.13 In addition, recent analysis of the effectiveness of „social reference pricing‟ in a Canadian province found that a 10% increase in the minimum price of any given alcoholic product reduced its consumption by between 14.6% and 16.1%.14
The impact of a change in alcohol price specifically on alcohol-related crime and disorder has been less researched than the impact on health. However, a recent rapid evidence assessment by Sheffield University found that increases in alcohol price were associated with reductions in overall crime, violent crime, sexual assault and criminal damage/property offences.15
As part of the commitments contained in the Alcohol Strategy, the Government aims to reduce, in particular, the consumption of harmful16 and hazardous17consumers. There is evidence to suggest that pricing policies have a similar or stronger effect for the identified at-risk groups (young people under 18, young adult binge drinkers, and harmful consumers) and may thus be especially suitable for reducing overall harms in these groups.18 Price elasticities used in the Sheffield University model are consistent with the international evidence base on alcohol and price interventions. Based on these, the Sheffield model findings are that the heaviest consumers (those drinking regularly more than twice the NHS guidelines) reduce their consumption most in response to a MUP focused on raising the price of the cheapest drinks.19
Availability and consumption of alcohol
9 Government‟s written evidence on the Health Select Committee‟s Enquiry into the Alcohol Strategy 2012. 10
Alcohol-related admissions are defined in the Public Health Outcomes Framework by reference to admissions where the primary diagnostic code is for an alcohol-related condition.
11Government Response to the House of Commons Science and Technology Committee Report of Session 2010–12: Alcohol Guidelines
http://www.official-documents.gov.uk/document/cm83/8329/8329.pdf
12
The range of available evidence that demonstrates a link between price and a reduction in consumption consists of the following studies and reports: the ScHARR report and model, Stockwell, T., Christopher Auld, M., Zhao, J. and Martin, J. (2012) Does minimum pricing reduce consumption? The experience of a Canadian province, Alcohol in the European Union; World Health Organisation and Meier, P. (2008); Independent review of the effects of alcohol pricing and promotion. Department of Health, Booth, A., Meier, P., Shapland, J., Wong, R. and Paisley, S. (2010); Alcohol pricing and criminal harm: a rapid evidence assessment of the published research literature. Home Office. The assessment included a study of alcohol pricing and criminal harm from 20 papers reporting 17 studies conducted in the US, Sweden, Denmark, Finland, Australia and the UK.
13
For example: Anderson, P. Moller, L. and Galea, G. (2012). Alcohol in the European Union. Consumption, harms and policy approaches. World Health Organisation and Meier, P. (2008). Independent review of the effects of alcohol pricing and promotion. Department of Health.
14
Stockwell, T., Christopher Auld, M., Zhao, J. and Martin, J. (2012) Does minimum pricing reduce consumption? The experience of a Canadian province. (2012) Addiction. 107. 912-920.
15
Booth, A., Meier, P., Shapland, J., Wong, R. and Paisley, S. (2010). Alcohol pricing and criminal harm: a rapid evidence assessment of the published research literature. Home Office. The assessment included a study of alcohol pricing and criminal harm from 20 papers reporting 17 studies conducted in the US, Sweden, Denmark, Finland, Australia and the UK.
16
NHS harmful drinking is defined as when a person regularly drinks over more than double the NHS guidelines, i.e. more than 50 units weekly for men or more than 35 units weekly for women.
17
NHS hazardous drinking is defined as when a person regularly drinks over the alcohol (NHS daily guidelines (equivalent to 21 units weekly for men and 14 units weekly for women).), but less than double the guidelines.
18
Meier, P. (2008). Independent review of the effects of alcohol pricing and promotion. Department of Health. http://www.shef.ac.uk/polopoly_fs/1.95617!/file/PartA.pdf
19 ScHARR Nice Report 2009, „Modelling to assess the effectiveness and cost-effectiveness of public health related strategies and interventions
to reduce alcohol attributable harm in England using the Sheffield Alcohol Policy Model version 2.0‟ http://www.nice.org.uk/nicemedia/live/11828/45668/45668.pdf
A study by the Competition Commission in 2008 found that 6 out of 7 major supermarkets sold alcohol „below cost‟.20 The study found that „below cost‟ selling took place at 11.9% on average
below cost price for all goods which resulted in retailers selling 220.2m litres of below cost alcohol during that same year.21 The study found that increases in below cost selling took place during events of significance, such as the football World Cup.
There has also been a 45% increase in purchasing alcoholic drinks for consumption in the home, from 527ml per person per week in 1992 to 762ml in 2010. In contrast, the overall volume of alcoholic drinks purchased for consumption outside the home decreased by 44% from 733ml per person per week in 2001/02 to 413ml in 2010.22
There is a growing body of evidence linking „pre-loading‟ to alcohol-related harm, particularly alcohol-related crime and disorder. Two recent small scale studies provide some indication of the scale and impact of pre-loading. Two thirds (66%) of 17-30 year olds arrested in a city in England claimed to have pre-loaded before a night out, with the majority (83%) buying alcohol from a supermarket, in advance, in preparation for pre-loading.23 A further study found that pre-loaders were two and half times more likely to be involved in violence than other consumers.24
MUP is intended to curb practices such as „pre-loading‟ and help to reduce crime and disorder in or around the on-trade without unfairly penalising responsible on trade businesses where there is a controlled and heavily regulated licensing environment. MUP is also intended to help tackle the health harms associated with binge drinking25.
Affordability of alcohol
In the UK, prices of alcoholic drinks, as measured by the alcohol price index, have increased more than the retail price index since 1980 (an arbitrarily chosen base year).26
Between 1980 and 2011 the price of alcohol increased by 24% more than retail prices generally. However, real households‟ disposable income per adult increased by 79% over the same period. Using the most recently available data, alcohol in 2011 was 45% more affordable than it was in 1980, highlighting the overall trend of increasing affordability over the period (see Graph 1 in Annex 2). It is important to note that this does not take into account the change in affordability of other products.
C. Objectives
The policy objective is to reduce the availability of alcohol and reduce the consumption of harmful and hazardous consumers in particular. It is intended that this will reduce the harms associated with alcohol misuse.
D. Options
At this stage, the Government has not committed to a MUP level. This Assessment will evaluate the costs and benefits associated with a recommended price level of 45p per unit of alcohol. This price level has been selected as the Government‟s modelling suggests this price level will be proportionate and effective in reducing consumption whilst minimising the impact on responsible drinkers.27
20
Data obtained from the 2008 Competition Commission report.
http://www.competition-commission.org.uk/assets/competitioncommission/docs/pdf/non-inquiry/rep_pub/reports/2008/fulltext/538_5_6.pdf 21
Figures are taken from the Nielsen sales price data for 2008. 22
Family Food Module of Living Costs and Food Survey (LCFS) 2010. Defra/ONS
23
Barton, A. and Husk, K. (forthcoming) Controlling pre-loaders: alcohol related violence in an English night time economy. Drugs and Alcohol Today.
24 Hughes, K., Anderson, Z., Morleo, M. and Bellis, M.A. (2008) „Alcohol, nightlife and violence: the relative contribution of drinking before and
during nights out to negative health and criminal justice outcomes‟, Addiction, 103 (1), pp 60-5. 25
Binge drinking, as defined by the NHS, is drinking lots of alcohol in a short space of time or drinking to get drunk. 26
Statistics on Alcohol: England, 2012. Health and Social Care Information Centre.
27
Option 1 is to make no changes (do nothing). This is the no change option. Doing nothing will enable alcohol retailers to continue selling alcohol sold at very low or heavily discounted prices and will prevent crime and health benefits to society through a reduction in alcohol consumption.
Option 2 is to introduce a minimum unit price for alcohol at a recommended price of 45p per unit (preferred option). The Government committed to introduce a minimum unit price on 23 March 2012. In this Assessment we have analysed the impact of a 45p minimum unit price on consumption, business revenue and alcohol related harms.
E. Appraisal (Costs and Benefits)
GENERAL ASSUMPTIONS & DATA
The ScHARR model
In 2008 the University of Sheffield‟s School of Health and Related Research (ScHARR) developed a model (hereafter referred to as “the ScHARR model”) for assessing the impact of alcohol pricing policies on alcohol consumption and health, crime and employment outcomes. The model is used by the Department of Health and is regarded as the best model currently available for assessing the impact of MUP. The Scottish Government has also used this model in their assessment of the impact of a 50p minimum unit price in Scotland.
For this Assessment, the Government has used version 2 of the ScHARR model. This is the most up to date ScHARR model currently available. The Government acknowledges that there are a number of limitations of the model, including the inability to assess the impact of beer and cider separately, and the use of 2008 baseline data. The University of Sheffield are currently in the process of updating their model to version 3. The plan for this includes separating beer and cider categories, re-estimating the responsiveness of demand to price changes (price elasticities) and adding the capability to analyse effects on income groups as well as the current analyses for male/female consumers across 9 age different age bands. Data and evidence from model version 3 is not currently available and there is no guarantee that the Government will have access to version 3 of the model within the time scale for this consultation. However, if version 3 does become available in time for the final Impact Assessment, the Government will seek to use this updated model and the estimated impacts of a MUP are therefore likely to change.
The estimates from the ScHARR model presented in this document are lower than those published in the original ScHARR report.28 This is due to a simple adjustment that has been made to ensure consistency between the level of the MUP and the price data it is applied to. For example, a 45p MUP at the point of implementation would have a much larger effect in relation to 2008 prices (as used in the ScHARR model) than in relation to 2014 prices (the proposed year of implementation in England and Wales).29 Baseline consumption figures for individual drink types have also been updated using Nielsen and CGA 2011 sales data. As a result, the estimated overall percentage change in consumption differs from that generated directly by the model output.
Exchequer impacts
HM Revenue & Customs have provided the estimate of the Exchequer impact using their existing alcohol model (hereafter “the HMRC model”). This model is designed for assessing the impact of a range of alcohol policies on the demand for duty-paid alcohol and the resulting excise duty receipts30. The HMRC model has been used to assess the Exchequer effect because this will ensure that the cost is comparable to the other alcohol duty rate changes.
28
http://www.shef.ac.uk/scharr/sections/ph/research/alpol/research/sapm and
http://www.scotland.gov.uk/Topics/Health/Services/Alcohol/minimum-pricing/Impact-Assessment
29
To estimate what a MUP in 2014 would have been in 2008, RPI indices were used for 2008-11 and forecast inflation figures were used for 2012-2014. For RPI indices see: http://www.ons.gov.uk/ons/publications/re-reference-tables.html?edition=tcm%3A77-260874 and for forecast inflation figures see: http://www.hm-treasury.gov.uk/d/201209forcomp.pdf
30
The HMRC model is a UK wide model and so to assess the consumption effect of MUP in England and Wales they assumed that Scottish consumption represents 10% of the total consumption, which is inline with census statistics on population density.
This modelling is not directly comparable to the ScHARR modelling as it uses different underlying data, different elasticities, and a different modelling structure to estimate the impact on consumption.31 This is a result of the need to use the best available, and most appropriate, model and data available. A more detailed explanation of the differences in the models can be found in Annex 2. Details of both methodologies are available publicly.32 As explained above, the Government aims to align these models as far as possible in its final stage Impact Assessment through the ScHARR 3 model.
Modelling Inflation
The impacts of a MUP are highly sensitive to the level at which it is set, and also the way in which it is adjusted over time. In this appraisal, the level of MUP set (i.e. 45p) is assumed to remain
constant over time in nominal terms. The final policy design is likely to include indexing to account for inflation. However, the details of this will be explored during the public consultation and
discussions with the alcohol industry and other Government departments. Figures in the final stage Impact Assessment are therefore likely to change to reflect the final policy details.
Geographic Coverage
Please note that because the ScHARR model only applies to England, all health and crime impacts in this Assessment are based on policy implementation in England only. However, any MUP
legislation will apply to both England and Wales. Therefore all figures presented here are likely to be slight underestimates.
Implementation
All impacts in this Assessment are based on implementation of the MUP policy in 2014/15.
OPTION 1 – Do nothing
The „do nothing‟ option is provided as a baseline for comparison with the potential impacts of a MUP. There would be no impact on current alcohol consumption or alcohol-related harms which have been estimated to cost £21bn per year to society.33 Doing nothing would still permit retailers to sell heavily discounted alcohol with no benefits to crime and health harms. It is important to note that in reality we would expect there to be reductions in alcohol-related harms from the other policies arising from the 2012 Alcohol Strategy but for the purposes of this assessment we are appraising the minimum unit price in isolation.
OPTION 2 – Introduce a minimum unit price for alcohol at a recommended price of 45p per unit of alcohol
Estimated minimum prices of popular products
For the purposes of this Assessment a „unit‟ of alcohol is defined as 10 millilitres of pure alcohol (ethanol)34. The number of units in a particular alcohol beverage will therefore depend on the volume of that product and its alcoholic strength (ABV).35 Please see Table 15 for a list of sample products that would be affected by a MUP of 45p per unit.
Costs
Costs (1): Cost to Individuals
Consumption effect
31
Elasticities measure the responsiveness of demand to a change in price.
32
http://www.shef.ac.uk/scharr/sections/ph/research/alpol/research/sapm and http://www.hmrc.gov.uk/research/alcohol-consumption-uk.pdf
33
As per Government Alcohol Strategy 2012, in current prices.
34
The Drinkaware website provide a useful calculator which enables visitors to determine the number of units in a variety of drinks: http://www.drinkaware.co.uk/tips-and-tools/drink-diary/?gclid=CIvNhannorACFVMetAod7SpHYg
35
Table 1. Percentage change in consumption as a result of a 45p MUP36
Beer Wine Spirits RTDs Total
Off-trade -14.1% 0.8% -7.8% 0.2% -6.6%
On-trade 4.0% 0.2% 0.8% 0.4% 3.0%
Overall -3.3%
The ScHARR model estimates a significant shift from the off-trade to the on-trade. This is due to the cross-price elasticities which estimate the responsiveness of demand for other goods as a result of a change in price for one good.37 An increase in price for one good can lead to an increase in demand for another if they are substitutes. In this instance, an increase in the price of off-trade goods has led to an increase in demand for on-trade goods.
It is important to note that the change in consumption from the ScHARR modelling represents a change in the number of alcohol units consumed, not alcohol products. Therefore, if a consumer were to switch from low-strength to high-strength alcohol products, even if they were to drink a lower total volume of products, they may actually increase the number of units consumed.
Table 1 shows that the beer category (which includes cider) will be most affected by a MUP of 45p. The situation is reversed for wine because of cross-substitution from other drinks to wine,
particularly wine sold in the on-trade. The overall effects are that consumption is expected to fall at 45p. However, this masks a greater fall in off-trade consumption and a small rise in on-trade consumption.
As highlighted above, the ScHARR model does not provide the breakdown between beer and cider. The consumption effect on cider is likely to be higher than for other drink types. This can be attributed partly to the higher relative price change of cider brought about by a MUP and partly due to “drink prevalence”38 on cider which is relatively small compared to other drink types. Published
modelling work undertaken by HMRC suggests that the drink prevalence on cider is one of the lowest of all drink types. Similarly a Mintel report on market intelligence published in December 2010 indicates a quite flexible consumption for cider given that only 56% of people who drank cider in the past year said that they would do so again.
However, Table 9 (see Annex 2) reveals that some fraction of all product markets are likely to be affected as the majority of each product are most commonly sold in the 30-45p range. It is important to note that the prices shown in Table 9 are from 2008 and are therefore likely to be higher by 2014 due to inflation. It is also possible that producers could replace affected cheaper alcohol products with premium alcohol products.
As mentioned previously, these consumption estimates and the subsequent impacts on expenditure, crime and health, are likely to change following improvements to the modelling ahead of the final stage Impact Assessment. This will particularly be the case if we are able to provide a more detailed breakdown of the impact on beer and cider.
There is clear evidence to suggest that MUP will reduce the consumption of harmful and hazardous consumers.39 It is important to note that MUP has not yet been implemented in any other country and so consumer response is uncertain. The closest comparable policy is social reference pricing in Canada with initial analysis suggesting that consumption has reduced.40
Cost to consumers
Government modelling anticipates the consumption effects outlined in Table 1. But these aggregate effects mask the fact that different consumer groups are likely to respond in different
36
Baseline consumption in the ScHARR model has been updated using Nielsen and CGA 2011 sales data on the volume of alcohol purchased per person per product type. See Annex 3
37
See p.77-78 in the ScHARR report for the ScHARR elasticities. http://www.gserve.nice.org.uk/nicemedia/live/11828/46443/46443.pdf
38
Drink prevalence is defined as the number of alcohol types consumed over household size. http://www.hmrc.gov.uk/research/alcohol-consumption-uk.pdf
39
See ScHARR NICE Report
40
ways. For instance, some may reduce their consumption, others may pay more to maintain their consumption, and others still may switch their consumption to different alcohol products. See Table 2 for the breakdown between consumer types.
MUP is expected to affect consumers across a range of ages and income groups, but will mostly affect harmful and hazardous consumers (See Table 2).41 Evidence from the University of Sheffield indicates that population groups specifically affected by a MUP included the older population, the unemployed and individuals with lower levels of education, social class and income.42
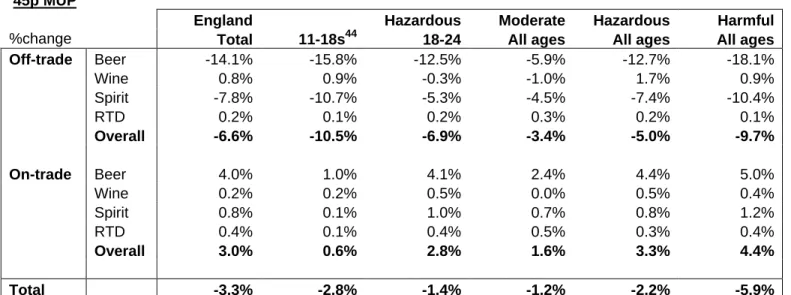
Table 2: % change in consumption from the ScHARR model43
45p MUP
England Hazardous Moderate Hazardous Harmful
%change Total 11-18s44 18-24 All ages All ages All ages
Off-trade Beer -14.1% -15.8% -12.5% -5.9% -12.7% -18.1% Wine 0.8% 0.9% -0.3% -1.0% 1.7% 0.9% Spirit -7.8% -10.7% -5.3% -4.5% -7.4% -10.4% RTD 0.2% 0.1% 0.2% 0.3% 0.2% 0.1% Overall -6.6% -10.5% -6.9% -3.4% -5.0% -9.7% On-trade Beer 4.0% 1.0% 4.1% 2.4% 4.4% 5.0% Wine 0.2% 0.2% 0.5% 0.0% 0.5% 0.4% Spirit 0.8% 0.1% 1.0% 0.7% 0.8% 1.2% RTD 0.4% 0.1% 0.4% 0.5% 0.3% 0.4% Overall 3.0% 0.6% 2.8% 1.6% 3.3% 4.4% Total -3.3% -2.8% -1.4% -1.2% -2.2% -5.9%
Table 3: Overall increase in consumer expenditure45
MUP Moderate drinkers Hazardous drinkers Harmful drinkers Change in mean annual consumption per drinker– all beverages (%) Change in spend per drinker per annum (£) Change in mean annual consumption per drinker– all beverages (%) Change in spend per drinker per annum (£) Change in mean annual consumption per drinker – all beverages (%) Change in spend per drinker per annum (£) 45p -1.2 +7 -2.2 +49 -5.9 +118
Table 3 above shows the expected impact on consumer expenditure. The average moderate drinker is likely to spend £7 more per year, compared to £49 and £118 for hazardous and harmful drinkers respectively.
The ScHARR model, as it is based on survey data, underestimates baseline consumption.46 To address this, the baseline consumption was adjusted using Nielsen and CGA 2011 sales data which contains estimates of the number of units purchased per person and the average price per
41
Harmful drinking is defined, by Government, as regularly drinking >50 units per week for men or >35 units for women.
42
Interventions on Control of Alcohol Price, Promotion and Availability for Prevention of Alcohol Use Disorders in Adults and Young People, ScHARR Public Health Collaborating Centre, http://www.nice.org.uk/nicemedia/live/13001/49001/49001.pdf
43
Baseline consumption has been updated using Nielsen and CGA 2011 Data on the volume of alcohol purchased per person per product type. See Annex 3.
44
The ScHARR model is based on survey data therefore would not take into account the legality of under 18s consuming alcohol.
45
Figures are rounded to the nearest pound.
46
See ScHARR NICE Report. This should not affect the impact on crime and health as the evidence linking consumption and harms (and therefore underlying the risk functions) is itself based on consumption data from surveys (and therefore understated).
unit. It was then possible to estimate the impact on consumers‟ expenditure using the ScHARR estimate of the change in consumption and increase in price per unit whilst adjusting the baseline consumption and average price per unit using the Nielsen and CGA 2012 estimates. The overall expenditure was uprated by forecast inflation to 2014 prices.
By raising the minimum price of alcohol there will be a loss in aggregate consumer surplus47. With an accompanying rise in producer surplus (consumers pay more, retailers earn more), the net effect is apparently zero. However, economic theory holds that the imposition of a minimum price above that set naturally by the market leads to the loss of some transactions that would have taken place before. This is known as deadweight loss. It implies that the imposition of a MUP will lead to a decrease in net social welfare.
Harmful and hazardous consumers
A systematic review by Booth et al (2008) reported that there is some evidence that harmful consumers tend to show a preference for cheaper alcoholic drinks.48 This is also partially validated by ScHARR who suggest that harmful consumers have a higher response to price changes with larger absolute consumption changes in comparison to responsible consumers49. This assumption is based on EFS50 data which, according to ScHARR, shows that harmful consumers are most likely to purchase the types of alcoholic products that are expected to be affected by a MUP policy.51
The review by Booth et al also reported that there is some evidence that young people and binge drinkers (as well as harmful drinkers) tend to show a preference for cheaper alcoholic drinks. The current ScHARR modelling suggests that MUP will reduce the consumption of 11-18 year old drinkers but suggests that the impact on 18-24 year old hazardous consumers will be less.52 The ScHARR model predicts that the young male hazardous drinkers heavily represented within this group have a strong preference for beer and for on-trade sector drinking. Minimum unit pricing that does not differentiate between on-trade and off-trade tends to affect on-trade prices only marginally and consequently is predicted to have a more limited impact on consumption amongst this group.53
This result is not entirely consistent with the evidence that young drinkers and hazardous drinkers have a preference for the cheaper drinks more likely to be affected by a MUP.54 It is possible that this inconsistency is linked to the failure to split beer and cider consumption in the current ScHARR model. It is also possible that long term behavioural effects may differ from those estimated by the ScHARR model which is based on a relatively short time series of data. Nevertheless, the Government will consider further the consumer effect throughout the consultation process and will provide further clarity in the final stage Impact Assessment.
Responsible consumers
The impact on responsible consumers is expected to be significantly less than the impact on harmful and hazardous consumers. As detailed above, evidence suggests that harmful consumers are more likely to show a preference for cheaper drinks than responsible consumers.
Low income consumers
There is expected to be an impact on consumers from a range of income groups, including low income consumers and high income consumers. Evidence on the likely effect on low income
47
Consumer surplus is the welfare gain obtained by consumers due to their ability to purchase a product for a price lower than the highest price they would be willing to pay.
48 Booth, Meier, Stockwell, Sutton, Wilkinson, Wong, Brennan, O‟Reilly, Purshouse & Taylor (2008) 49
See ScHARR NICE Report.
50
EFS = Expenditure and Food Survey
51
See ScHARR NICE Report.
52
Ibid.,
53
Meier, Purshouse and Brennan, „Policy options for alcohol price regulation: the importance of modelling population heterogeneity‟, ScHARR Report, 2009
54
Meier, P. (2008). Independent review of the effects of alcohol pricing and promotion. Department of Health. http://www.shef.ac.uk/polopoly_fs/1.95617!/file/PartA.pdf
consumers is mixed. Analysis by the Institute for Fiscal Studies (IFS) suggests that cheap alcohol is not only bought by those who are poorest but by those across the income distribution55. This conclusion is supported by analysis on 2010 expenditure and food data, which showed that low income households are less likely to purchase off-sales alcohol at all.56
On the other hand, further research carried out by the University of Sheffield suggests that, even though off-trade alcohol sales are most likely to be affected by a MUP, reduced consumption is higher for low income consumers than high income consumers. This is potentially due to low income consumers tending to purchase low priced alcohol which are mostly affected by a MUP. 57
Based on this premise, analysis suggests that the lowest decile might experience the highest impact as a proportion of total expenditure or of income58. However, for other deciles there is no strong trend across the income and expenditure distributions. As with all income groups, it would be the heaviest regular consumers in the lowest decile who would feel the financial impact most. The Government intends to undertake further work to assess the impact on low income consumers following the public consultation.
Effect on inflation
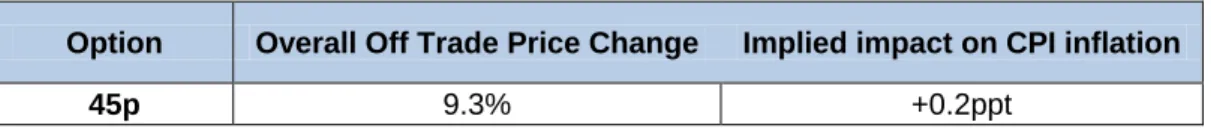
There are likely to be inflationary impacts from a MUP at any level. The estimates below are based on the weight of off-trade alcohol in the Consumer Price Index (CPI). These are expressed as percentage point contributions to the headline rate of CPI inflation.
Table 4: Average price change affect on inflation (2014/15)
The inflation impacts provided below by HM Treasury are calculated solely on the basis of the change in the overall off trade price change estimated by the HMRC model.
Implementation of a minimum unit price at any level will increase prices and therefore inflation. As shown in Table 4 the impact of a 45p MUP is estimated to be a +0.2ppts, based on the weight of off-trade alcohol sold in the Consumer Prices Index. There are a number of uncertainties about these estimates, as there are likely to be further offsetting effects on inflation if the prices of more expensive alcohols are increased to maintain differentials with cheaper alcohol; and/or if retailers discount other products in the place of alcohol. To place the size of the estimated impact on inflation in context, the OBR estimated that the January 2011 increase in the standard rate of VAT increased CPI inflation by +1.0ppt.
The impacts shown will affect the headline rate of CPI inflation for 12 months, after which the impact drops out of the annual comparison. The effect on the price level is, however, permanent. The latest OBR forecast (in March 2012) shows inflation continuing to fall back in 2012 and
returning to the 2 per cent target by the start of 2013. It is important to note that for the purposes of this assessment we have assumed that the MUP will be implemented in 2014/15.
Higher inflation itself (if anticipated) does not necessarily affect social welfare so no costs have been assigned to inflation impacts. The cost to individuals of higher prices has been covered elsewhere in this section.
Costs (2): Business Costs
55 There is a lack of survey data containing both information on households‟ alcohol expenditure as well as the prices they pay per product. IFS
analysis is based on market research, when modelling 45p MUP in 2007.
56
Ludbrook, Prof A (2010) Purchasing patterns for low price off sales alcohol: evidence from the Expenditure and Food Survey; SHAAP
57
Initial analysis completed so far for ScHARR model version 3. Work is ongoing on this version of the model.
58 The distributional impacts have been calculated using HMT‟s model of consumption by household income.
Option Overall Off Trade Price Change Implied impact on CPI inflation
Transition costs to off-trade and on-trade retailers
Familiarisation of MUP policy: off-trade and on-trade retailers
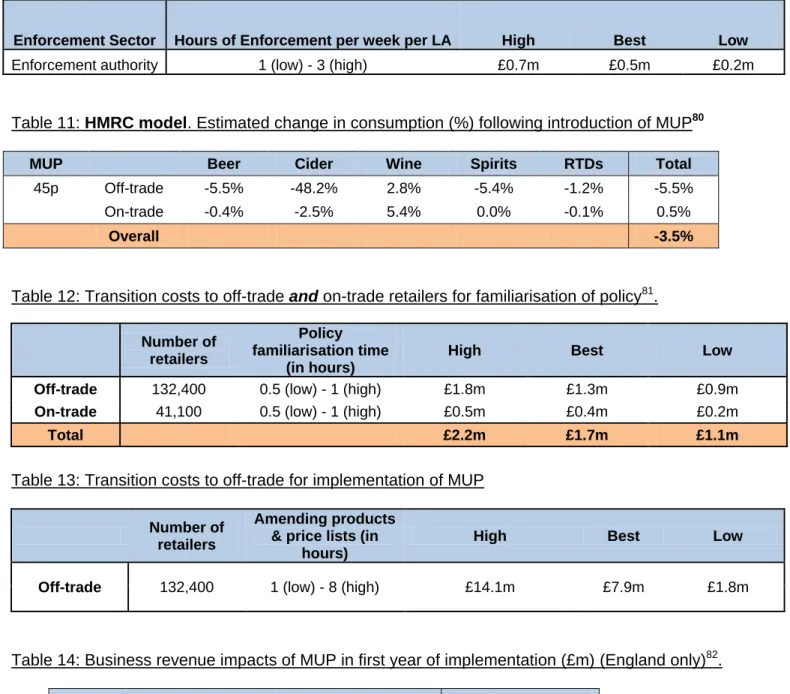
Alcohol retailers will need to ensure that all products on the premises are sold above the specified MUP. However, due to typically higher prices in the on-trade, it is expected that only off-trade retailers will need to re-price products, amend bar codes, and change prices on shelves, shop displays and websites. Based on initial discussions with a small number of retailers, it has been assumed that it could take up to one hour for each retailer to familiarise themselves with the MUP policy. (See Table 12 in Annex 2 for costs).
Total estimated familiarisation costs: £1.12m-£2.24m
Non-monetised transition costs
There will also be material and stationery costs to alcohol retailers when amending the prices on shop shelves, menus and promotional displays. This cost has not been quantified in this pre-consultation Impact Assessment as further work is required on the cost of materials/stationary chosen by retailers. This will be considered further throughout the consultation process. However, as detailed above, we would only expect off-trade retailers to re-price products on shelves and websites.
Off-trade implementation costs
Implementation costs are not expected to be as significant for stores with Head Office support as such stores have the ability to cross-check prices right across their regional stores and update via centralised pricing systems. However, based on consultation with a small number of retailers who do not use centralised pricing systems, it is estimated that this could take up to a one-off period of
8 hours per independent retailer. However, we will explore this time period further throughout the consultation process.
There are currently 132,400 off-trade alcohol retailers in England and Wales (this includes on-trade retailers that are also licensed to sell alcohol for consumption off the premises). 27,341 of these are micro-business, 28,808 are small businesses and 29,289 are medium businesses59. We therefore assume that the remaining 46,962 are large businesses.
There is no available data that details what proportion of retailers use central pricing systems. However, we assume that large retailers and medium retailers are most likely to use central pricing systems and that micro and small businesses are least likely. We therefore expect that the largest implementation burden will fall on the 56,149 micro and small off-trade retailers (although there will be a proportion of these businesses that use centralised pricing systems). It is also important to note that the scale of impact will depend on the size of actual premises and the number of affected alcohol products in stock. This data is not currently available.
For the purposes of this Assessment we have provided a range of scenarios for the cost of implementation but have not made separate assumptions based on the size of the business due to the degree of uncertainty around the number of retailers that have a central pricing system. (See Table 13 in Annex 2 for costs)
Total estimated off-trade implementation costs: £1.77m-£14.1m
Annual costs to business Annual impact on profits
Business‟ profits are made up of total revenue minus total costs. We have not estimated the impact on business profit as this is also dependant on the unit costs of the alcohol products sold. Whilst total costs will fall for the alcohol products for which volumes have fallen, total costs will increase
59 Data is obtained from UK Business: Activity, Size and Location – 2010 which contains data from a snapshot of the Inter Departmental
with production of the substitute goods for which demand has increased. If the cost of these products is larger than the cost of the products they have substituted (because they are typically sold at a higher price), then the net change in cost is likely to be greater than zero. In the absence of information to allow us to say whether this increase in cost is likely to outweigh, offset or fall short of the increase in revenue, the impact of MUP on business profits remains uncertain. We intend to use the consultation process to investigate the likely effects on costs and will be working with HMRC to provide estimates of lost profit for the final Impact Assessment.
The primary effect of the policy is that all businesses would have to change the prices of alcohol sold to ensure they comply with the MUP. The effect on business revenue brought about by changes in consumer behaviour is a secondary effect and therefore not in scope for OIOO. See Table 14 in Annex 2 for business revenue impacts.
Alcohol producers
According to HMRC data, there are approximately 900 brewers, 110 distillers and 250 wine and cider producers in the UK. This is a total of approximately 1,260 alcohol producers in the UK60 that could be affected by MUP. At this stage, the number of EU producers and international producers that import alcohol into England and Wales is unknown.
There is expected to be an impact on international producers whose alcoholic products are imported into England and Wales, particularly for those international producers that produce low cost alcohol. It is not possible to quantify the impact on international producers at this stage as we do not know the price distribution of domestic vs. imported products. Further work will be carried out to consider the impact of MUP on international producers and producers from developing countries.
Government modelling suggests an overall decrease in demand due to the introduction of a MUP. This would therefore lead to a decrease in sale volumes and therefore a drop in the demand faced by producers of alcohol. There are various „second round‟ effects that may result from shifts in strategy by retailers and producers. For instance, it is possible that the introduction of MUP could incentivise producers to produce lower strength alcohol products as these would retail more cheaply. Alternatively, products not affected by MUP could be increased in price in order to maintain a price differential for brand identity purposes. Such second round effects cannot be accurately predicted and are not considered in detail in this Assessment. Consultation responses may inform future modelling in this area.
The „first round‟ impact on producers is implicitly counted elsewhere. If retailers or wholesalers choose to reduce any lost revenue by lowering their costs through making smaller stock orders, they are effectively „passing on‟ the loss to producers. The overall loss would remain unchanged. Impact on Wholesalers
Wholesalers may be affected by a decrease in the sale of alcohol sold in retail stores. The reduction in sales will vary across alcohol types. For example, a reduction in sales of certain products could result in retailers removing that product from shelves or increasing the price of that product. Removal of affected products from shelves will impact on wholesalers as a „second round‟ effect.
As for producers, the „first round‟ impact for wholesales is implicitly counted elsewhere. If retailers choose to reduce any lost revenue by lowering their costs through making smaller stock orders to wholesalers, they are effectively „passing on‟ the loss to wholesalers. The overall loss would remain unchanged.
Costs (3): Public sector
Transition costs to the public sector
60
The Government would produce guidance for both alcohol retailers and local authorities prior to the introduction of a MUP.
Licensing authorities would be likely to inform local alcohol retailers of the new legislation, although they would not be legally required to do so. They would have a number of options of how to do this and so direct costs are difficult to estimate. The cost of communicating previous changes has been estimated at £500 per authority. We assume this cost to be the same for communicating MUP as the method of communication is likely to be the same for communicating new policies. An estimated £500 per authority, of which there are 349, gives a total cost of £174k. The best estimate for future transition costs (using the previous figure as a high cost and calculating the mid point between that and a zero cost) would therefore be £87.0k. We have used a best cost as there may be licensing authorities that decide not to inform retailers of the MUP policy.
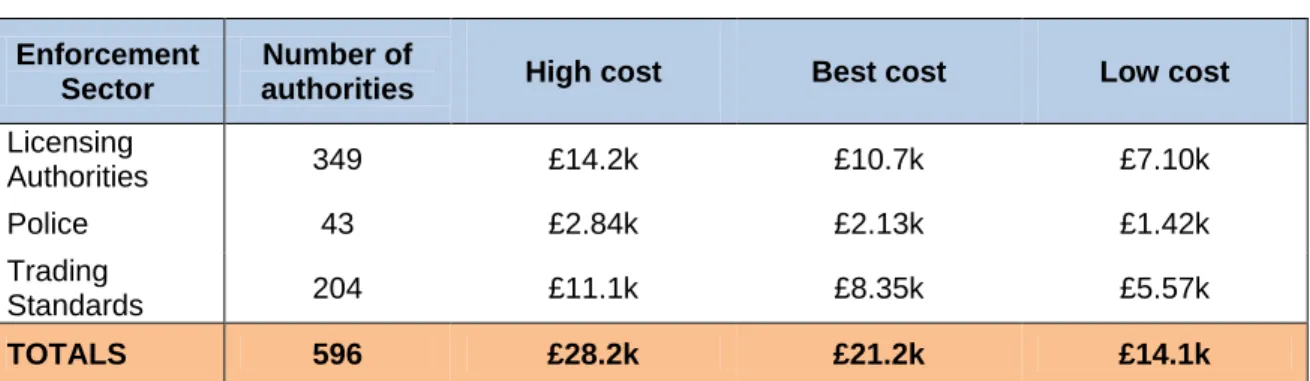
Enforcement authorities (licensing authorities, the police and Trading Standards) would also need to familiarise themselves with the MUP. Based on initial discussions with a small number of enforcement authorities we estimate that it will take between 0.5 to 1 hours for enforcement authorities to familiarise themselves with thepolicy, at a best estimated cost of £21.1k:
Table 5: Cost of familiarisation for the Public Sector61
Enforcement Sector
Number of
authorities High cost Best cost Low cost
Licensing Authorities 349 £14.2k £10.7k £7.10k Police 43 £2.84k £2.13k £1.42k Trading Standards 204 £11.1k £8.35k £5.57k TOTALS 596 £28.2k £21.2k £14.1k
Based on both sets of transition costs (familiarisation and informing retailers), the best estimate of the total transition cost to the public sector is £108k (based on a range of £14.0k to £202k).
Ongoing costs to the public sector Enforcement
If a retailer is found to be in breach of the MUP policy (i.e. selling alcohol below the specified MUP) enforcement action may be taken against it. This could result in a licence review, revocation of a licence, closure or even a fine and/or imprisonment.
We would expect the majority of retailers to adhere to the MUP legislation from the outset, but enforcing authorities will need to undertake enforcement action against any retailers who are selling alcohol products below the specified MUP level.
The time taken to enforce MUP will vary depending on the size of the premises, the number of alcohol products in stock and the number of licence reviews that lead to enforcement action. Furthermore, the higher the MUP price level the wider range of products will be affected leading to an increased likelihood of enforcement activity. There is expected to be an increased risk of enforcement in the off-trade. However, at this stage it is not known which enforcing authority will be responsible for enforcing MUP between the off-trade and on-trade. Consultation and discussion with local authorities and the police is required in order to determine which enforcing authority will take lead responsibility for enforcing MUP and what the expected impact of this would be. Therefore, the estimated cost of enforcement in this Assessment could be higher or lower in the final stage Impact Assessment.
61 These estimations have been calculated on the basis of an average number of 3 staff per authority and a range of 0.5 to 1 hours per officer for policy familiarisation. It uses the average hourly wage for a licensing authority officer (£13.60), a police officer (£22.01) and a trading standards officer (£18.19), multiplied by the estimated time to enforce the policy. The „best cost‟ has been estimated by taking a mid point between the low cost and high cost. See Table 17 for full average hourly salary breakdown. All figures have been up-rated by 21% for non-labour costs.
For the purposes of this consultation stage Assessment we have assumed that one local government officer (either a licensing officer, police officer or Trading Standards officer) will be responsible for enforcing MUP (mostly in the off-trade). The time taken to enforce MUP is based on a small number of discussions with enforcement authorities and will require further discussion and consideration for the final stage Impact Assessment.
It is important to note that these costs are likely to be “opportunity” in nature in that the extra enforcement time will displace other work rather than require additional resources to be hired. Estimates will be improved following the consultation process. In addition, a key benefit of the policy is a safer night time economy, which could lead to a reduction in associated enforcement costs.
Estimated enforcement activity based on one local Government officer per week: 1 - 3 hours
Initial estimated on-going cost of enforcement: £0.2m-0.7m per year62
Impact on the Exchequer
HM Revenue & Customs have provided the estimate of the exchequer impact using their existing alcohol model (hereafter “the HMRC model”). This model is designed for assessing the impact of a range of alcohol policies on the demand for duty-paid alcohol and the resulting excise duty receipts63. The HMRC model has been used to assess the exchequer effect because this will ensure that the cost is comparable to the other alcohol duty rate changes.
The impact on the Exchequer concentrates on the reduced revenue from alcohol duty receipts resulting from a fall in alcohol consumption. HMRC model the impacts of increased prices in the off-trade using a set of price elasticities of demand covering five different drink categories (spirits, cider, beer, wine and RTDs) sold in the off-trade as well as in the on-trade. This allows HMRC to cover a wide range of consumer „switching‟ effects.
It is important to note that the impact of a MUP modelled by HMRC is not comparable to the impact modelled by the ScHARR. Table 11 in Annex 2 shows the estimated consumption effects from the HMRC model – overall consumption falls by 3.5%, compared to a 3.3% fall in the ScHARR model. This is due to the use of different price elasticities as well as different underlying price data and a different modelling structure. (See General Assumptions section and Annex 3 for detailed explanation.)
A 45p MUP is expected to decrease receipts by approximately £200 million inyear one.
The Exchequer impact does not include the affect on Corporation Tax receipts as it is assumed that this will be negligible. This assumption will be re-assessed as part of the consultation process. It is important to note that additional costs to the Exchequer may arise depending on the effect of MUP on non UK duty paid consumption and the size of alcohol tax gap as well as any potential impact on Corporation Tax receipts.
Typically, lost tax revenue is not counted for the purpose of impact assessment because it is simply transferred to consumers or producers and there is no net change in social welfare. But in this case the loss in revenue from alcohol duty receipts reflects a net decrease in economic activity64. It is therefore a pure economic loss and is counted as a cost of the policy.
It is feasible that consumption could shift to other sectors of the economy and that other tax receipts could therefore increase. However, such second round Exchequer effects are considered to be outside the scope of this appraisal.
62
These estimations use the average hourly wage for a local government administrative occupation (£13.60) multiplied by the estimated time to enforce the policy. The „best cost‟ has been estimated by taking a mid point between the low cost and high cost. See Table 17 for full average hourly salary breakdown. All figures have been up-rated by 21% for non-labour costs.
63
The HMRC model is a UK wide model and so to assess the consumption effect of MUP in England and Wales they assumed that Scottish consumption represents 10% of the total consumption, which is inline with census statistics on population density.
64
For the purposes of this assessment we have assumed that the loss in revenue for the Exchequer in year one is representative for the whole 10 year NPV period. We will be developing on this further throughout the consultation period.
Benefits
The following benefits are expected to accrue to local Government, central Government and society through a reduction in the numbers and costs associated with alcohol related crime and health problems. It is important to note that these benefits are not entirely cashable savings but also reflect where resources can be reallocated and put to alternative use. There are a number of uncertainties surrounding the modelling and a more detailed explanation can be found in Annex 3. Crime benefits
The ScHARR model estimates the potential reduction in alcohol related crimes.65 Alcohol-related crimes include sexual offences, assault and criminal damage. The benefits to crime happen immediately from year one with no time-lag.
The costs of crime are calculated by using the Home Office cost of crime estimates and measure the cost to society of crime (through the cost to victim services, health services, the cost of lost output, the cost of stolen and damaged property and the costs to the police and the criminal justice system).66 The ScHARR model has removed the human and emotional cost component from the unit costs and instead represented it in quality adjusted life years (QALYs). A crime related QALY is valued at £81,000.67
Table 6 shows that for a 45p MUP, modelling estimates that approximately5,240 crimes could be prevented per year at a benefit of £12.9m per year.
The extent to which reductions in such costs are “cashable” is constrained by the indivisibility of some elements, capacity limits, regional constraints, quality constraints amongst other factors. As such the actual financial savings could be significantly lower.
Table 6- Reduction in alcohol related crimes per annum (from years 1 to 10) for England only
Crime impacts (p.a.) Crimes
Cost of Crime to Society (£m)
45p -5,240 -12.9
Health benefits
The modelling for MUP predicts that a MUP of 45p will lead to 4,630 fewer alcohol related hospital admissions in the first year. 10 years after the policy has been implemented, it is estimated that 24,600 admissions will be prevented annually. The full effects of the model take ten years to work through as there is a time lag between changes in alcohol consumption and chronic health harms. A reduction in alcohol related hospital admissions covers a wide range of alcohol related conditions including alcoholic liver disease, heart disease, cancers, poisoning, falls and injuries, assault and road traffic accidents.68
65 This analysis is based on calculated „Alcohol Attributable Fractions‟ (AAF) using the Offending Crime and Justice Survey (OCJS) which asks
offenders whether they committed an offence due to alcohol.
66
Based on Brand and Price (2000) and Dubourg et al (2005) unit costs of crime. The ScHARR model uses unit costs in 2003 prices therefore are underestimates of the potential savings from any reductions in crime. These have been uprated using the GDP deflator from 2006/07- 2014/15 http://www.hm-treasury.gov.uk/data_gdp_index.htm
67This is based on: Carthy, T., Chilton, S., Covey, J., Hopkins, L., Jones-Lee, M., Loomes, G., Pidgeon, N., & Spencer, A. 1999. The
Contingent Valuation of Safety and the Safety of Contingent Valuation Part 2: The CV/SG 'chained' approach. Journal of Risk and Uncertainty 17, 187-213. QALYs are discounted by 1.5%.
68
Health harm reductions are mostly likely to relate to chronic diseases rather than acute conditions such as injuries. This is because much of the alcohol-attributable health harm occurs in middle or older age groups who are at greater risk of developing these conditions.
The direct health cost component comprises the health care costs of treating alcohol-related conditions.69 Gains in health-related quality adjusted life years (QALYs) show the increase in the number of life years in good health as a result of reductions in mortality and morbidity from alcohol-related conditions. A health alcohol-related QALY is valued at £60,000 in accordance with Department of Health methods.70
The extent t