W H O ’ S D R E A M I N G ?
Homeownership Among Low Income Families
CEPR Briefing Paper
Dean Baker
1n
E X E CUTIV E S UM M A RY
T
his paper examines the relative merits of renting and
owning among low income households. It notes that
two factors that make homeownership more desirable to
middle income families are less relevant to low income
fam-ilies. First, most low income families have no income
tax liability, which means that they will receive no
benefit from the provision in the tax code that
makes mortgage interest payments tax
deductible. Second, the median period of
home-ownership for low income families is extremely
short -- just four years -- which means that
transac-tions costs loom very large relative to other expenses for
low income homebuyers. Finally, the recent run-up in home
prices in many parts of the country makes it unlikely that
homebuyers (including low income homebuyers) will
ex-perience capital gains when they sell their homes. In fact, it
is likely that in many bubble affected regions, low income
homebuyers will actually sell their homes for less than what
they paid, after adjusting for inflation.
Center for Economic and Policy Research 1611 Connecticut Ave., NW Suite 400 W ashington, D.C. 20009
Using a set of simple calculations, the paper shows that:
• In a relatively optimistic scenario, in which home prices rise in step with inflation, a typical low income homebuyer will lose (relative to renting) an amount equal to approximately 25 percent of their total rent over the four-year median period of homeownership.
• In the event that there is a modest correction in home prices, where home prices fall by 10 percent after adjusting for inflation (in this scenario, home prices still rise slightly in nominal terms), the losses for homeowners equal almost two-thirds of the total cost of renting over a four-year period.
• In the case of a more serious correction — a 20 percent decline in real home prices — the losses to homebuyers would be approximately equal to the total cost of renting over the four-year period. In other words, the decision to buy a home effectively doubled the cost that the family would have otherwise incurred from rent. In this scenario, the homeowner would not have enough money from the sale of the home to pay off the mortgage.
• Government programs intended to promote homeownership among low income families, such as the subsidized down pay-ments provided in the American Dream Act, will primarily benefit realtors, mortgage brokers, and other intermediaries. Even in a relatively optimistic scenario where home prices rise in step with inflation, the losses attributable to homeownership are likely to exceed the size of the subsidy. In other words, many low income families would find themselves better off if they remain as renters instead of becoming homeowners — even with the subsidy from the government.
n
INTRODUCTION
A
longstanding goal of public policy has been to increase the national rate of homeownership. Policies such as the tax deductibility of mortgage interest, and the creation of a secondary market in mortgages through Fannie Mae and Freddie Mac, have vastly expanded homeownership over the last five decades. The expansion of homeownership has proven enormously beneficial for tens of mil-lions of middle income families. Homeownership has provided both a way of securing quality housing and also a means of accumulating wealth for retirement or as protection against unforeseen events.However, it does not follow that homeownership is always beneficial for all families. There is rea-son to question the merits of recent efforts to expand homeownership among low income families, such as the American Dream Act, which provides down payments to qualified low income families. Given the realities confronting low income families, many low income families may actually be made worse off by becoming homeowners instead of renters. In such cases, government subsidies for home-ownership may enrich realtors, mortgage brokers, and other intermediaries at the expense of the fami-lies they were designed to help.
This paper examines the simple arithmetic of homeownership compared with renting for low income families. Since evidence indicates that the median duration of homeownership among low income families is quite short (less than four years), it suggests that most low income families are likely to be worse off by owning rather than renting, even with the subsidies of the sort provided by the American Dream Act. In the case of the median low income homebuyer, the government subsidy goes entirely to intermediaries. The situation for low income families is likely to be made even worse if they buy into a region in which housing prices have been inflated by a bubble that is likely to collapse in the near future.2In such circumstances, the losses could be substantial, leaving home sellers without
enough money to pay off their mortgages.
n
WRONG ASSUMPTIONS ON
HOMEOWNERSHIP AMONG LOW
INCOME FAMILIES
T
here are three key assumptions that middle income families typically make about the benefits of homeownership relative to renting that may not hold — especially at present — in the case of low income families:1) the tax deductions from homeownership make it far more attractive than renting;
2) transactions costs become a relatively minor factor if a home is held for a long period of time; and 3) homes appreciate in price through time, providing a capital gain to their owners.
The applicability of these three assumptions to low income families in the current housing market is considered below.
The first issue, the question of tax benefits, can be easily discarded in the case of low income fami-lies. Almost by definition, low income families will owe no income tax because they are below the thresholds where they first become liable for income tax. In fact, many middle income families proba-bly exaggerate the tax benefits from homeownership. The deduction for mortgage interest and proper-ty taxes is generally not much larger than what families could have received from the standard deduc-tion which is available to all families. This means that the favorable tax treatment of mortgage interest actually is not worth very much even to many middle income homeowners. This is one reason why millions of homeowners take the standard deduction. In any case, low income families, without any income tax liability, clearly do not benefit from the tax deductibility of mortgage interest.
The second assumption, that a family will occupy a home for a long period of time, is almost cer-tainly exaggerated for all families, but this issue is especially important in the case of low income lies. (Low income is defined as below 80 percent of the median income of the country where the fami-ly lives. Nationwide, this would be mean an income of less than $43,000.) Recent research shows that the median low income homebuyer remained in their home for less than four years.3Typically, they
were forced to give up their home due to either losing a job or a change in family circumstances, such as a divorce. While job loss or a divorce can lead any family to lose its home, they pose especially grave problems for low income homeowners. Low income homeowners are the least likely to have financial reserves that they can draw upon, or family members who can lend money in order to meet mortgage payments during a rough period.
The fact that most low income families will only be in their homes for a short period of time means that the transactions costs associated with buying and selling a home will be quite important relative to the cost of living in the home.4Although some low income families will stay in their homes
a long enough period of time that the transactions costs end up being relatively inconsequential, this will not typically be the case.
The third assumption, that home prices will rise through time, is questionable in general (especial-ly for low income families), and especial(especial-ly dubious in a period in which housing prices have been inflated by an unsustainable bubble. In the years from 1975 to 1995, home prices rose on average by approximately 0.5 percentage points a year more than the overall rate of inflation. While this does not provide much of a return (it is likely that many homeowners have confused nominal and real returns, not recognizing that other assets, such as stock, also can protect them from the effects of inflation), the return in the future may be even less. Since 1995, the increase in home prices has exceeded the overall rate of inflation by more than 40 percentage points. This run-up in home prices has no historical precedent. Nor can it be explained by fundamental factors affecting supply and demand, since there has been no comparable increase in rents (see Baker 2003, 2002). The only plausible explanation is that the housing market is being driven by a speculative bubble comparable to the one that pushed price to earnings ratios in the stock market to record highs in the late nineties. While the bubble has not inflated housing prices in all parts of the country, the regions that have been hardest hit, primarily
California and the east coast north of Washington, D.C., have seen price increases that have exceeded inflation by more than 50 percentage points over the last nine years. Homebuyers in these regions, including low income homebuyers, are likely to see substantial price declines in the years ahead.5
An analysis of the benefits of ownership compared with renting must realistically assess the situa-tion of low income homebuyers in the current market. This means that:
1) given the current structure of the tax code, they will receive no tax benefit from homeownership; 2) they are likely to live in any home they buy a relatively short period of time; and
3) they are unlikely to earn a capital gain on any home they buy, and could very well end up with a large loss.
The calculations of the benefits of homeownership in the next section start from these corrected assumptions.
n
THE BASIC ARITHMETIC OF
HOMEOWNERSHIP
U
sing realistic assumptions concerning the likely experience of low income homebuyers, it is easy to see that many will lose money as a result of the decision to buy rather than rent. The biggest rea-son for this loss is that the transactions costs are very large relative to the rent that they otherwise would expect to pay. If they held their home over a long period of time, then these transactions costs would be less consequential. However, since the median period of homeownership for low income families is just four years, the transactions costs end up being quite large relative to rent for the vast majority of low income homebuyers.Table 1 shows calculations comparing the costs of homeownership with renting under the assump-tion that the home is held for four years.6The table assumes three possible scenarios for home price
appreciation over this period. The most optimistic scenario is the one shown in column 2, in which home prices stay constant, after adjusting for inflation. It is important to recognize that this assump-tion does mean that home prices rise — since the scenario assumes 3 percent annual inflaassump-tion, then home prices rise by just over 12 percent over the four-year period — but the rise in home prices does not exceed the rate of inflation, leaving no real increase in home prices. The numbers in column 3 assume that home prices fall in real terms by 10 percent (but still rise modestly before adjusting for inflation). This is consistent with some reduction in real home prices, which can be reasonably expect-ed in some of the bubble inflatexpect-ed housing markets. The numbers in column 4 assume that home prices fall by 20 percent in real terms, a more serious adjustment, which may still understate the price decline that could accompany the collapse of a housing bubble in some areas. (The other assumptions are explained briefly in the Appendix.)
The table shows that, in all three scenarios, homebuyers end up as losers compared to renting. In the best case scenario in column 2, in which the home price rises in step with inflation, homebuyers pay out a total of $8,887 more than renters over a four-year period. This is the equal to almost 25 per-cent of the rent that they would otherwise have paid over this time. In other words, low income homebuyers end up losing the equivalent of one year’s rent as a result of their decision to buy rather than rent.
In this scenario, homebuyers do end up with $18,460 after selling their home, but it is important to put this number in context. The numbers in the table assume that the homeowner originally put up a down payment of $6,500 or 5 percent of the purchase price. They also assume that they had $5,200 available to cover other closing costs for a total of $11,700. If a family was able to save this amount to cover the cost of purchasing a home, and instead placed the money in a government bond that paid 5 percent interest, it would have accumulated $14,220 by the end of four years.7If this family had also
invested its additional savings from renting rather owning in government bonds, then it would have accumulated more than $27,000 at the end of four years.
TABLE 1
The Relative Costs of Renting and Owning
1 2 3 4
Rent Own
Appreciation (real) Zero -10 Percent -20 Percent Purchase Price (5 percent down) $130,000 $130,000 $130,000 Mortgage fees and costs (4.0 percent) $5,200 $5,200 $5,200 Interest payments (6.3 percent) 43,200 43,200 43,200 Taxes (0.5 percent) 2,720 2,720 2,720 Maintenance and Insurance (1.0 percent) 5,440 5,440 5,440 Sale price 142,050 127,845 113,640 Commission and fees (6.0 percent) 8,523 7,670 6,818 Principle accumulated 8,433 8,433 8,433
Rent $38,850
(Interest) $3,137
Total Cost (4 years) $35,713 $44,600 $57,953 $71,305
Loss Due to Owning $8,887 $22,240 $35,593
The situation for homeowners appears much worse if the housing market corrects from bubble inflated prices during their period of homeownership. In the scenario shown in column 3, where infla-tion adjusted home prices fall by a modest 10 percent, homeowners end up losing $22,240 by opting to buy instead of rent. This is an amount equal to approximately two-thirds of the rent that they would have expected to pay in this period. Also, in this scenario homeownership actually ends up depleting the family’s savings compared to the money it had when it initially purchased the home. While the family would have needed $11,700 to cover the down payment and closing costs, after sell-ing the home it is left with just $5,107.
If the housing market takes a more serious downturn during the period of homeownership, then the consequences for low income families will be even more dire. A 20 percent real decline in the value of a home, which would still leave homes priced well above their pre-bubble level in the most affected areas, will result in losses to low income families of almost $36,000 in the scenario described in col-umn 4. In this case, the loss would be approximately equal to the rent that the family would have oth-erwise paid over the entire period — effectively doubling the rent for such a family. Instead of accu-mulating money through homeownership, in this scenario the homebuyers would actually find them-selves owing money after selling their home. The assumptions in this scenario imply that the home-buyer would need an additional $8,245, on top of the money received from selling the home, in order to pay off the mortgage on the house. Of course, in such situations many homeowners will simply default on their mortgage obligations, but this will have consequences for the family’s future access to credit. In any case, this is not a route towards building up a secure base of savings.
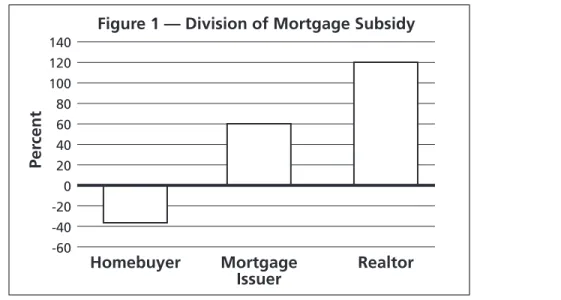
Given the basic arithmetic of homeownership for low income families, it is worth considering who benefits from government subsidy programs, such as the American Dream Act, which is intended to promote homeownership among low income families. The Act provides down payments of up to 6 percent for qualified low income families. Figure 1 shows how a government subsidized down pay-ment, equal to 5 percent of the purchase price, would be divided between the homebuyer, the mort-gage brokers, and the realtor, using the relatively optimistic scenario shown in column 2 of table 1.
In this case, the homebuyer still ends up a loser. The losses associated with homeownership exceed the size of the subsidy. In other words, even with the subsidy to homeownership, the family would still be better off renting. The revenue going to the mortgage brokers, which is assumed to be 3 percent of the purchase price, amounts to 60 percent of the subsidy from the government. The 6 percent of the sale price that goes to the realtor at the point where the home is sold is equal to 120 percent of the subsidy from the government. In short, the intermediaries to the transactions end up receiving an amount that is far greater than the size of the subsidy. The government’s money goes entirely to these intermediaries, and the homeowner is left worse off than if they did not get the subsidy and remained as renters. Of course, the situation is considerably worse for homeowners if home prices fall from their bubble inflated levels, but, even in this relatively optimistic scenario, the intermediaries are the only ones who benefit from the government subsidy to low income homeownership.
n
CONCLUSION
W
hile homeownership may be desirable for many families, it is not always preferable to renting. It is important to recognize the particular situations of potential homebuyers, as well as the spe-cific situation of the housing market, in order to determine whether renting is preferable to owning. An important factor that makes homeownership attractive for middle income families —- the tax deductibility of interest payments — is not relevant for low income families who have no income tax liability. Also, the fact that low income families are likely to stay in their homes for relatively short periods of time substantially increases the importance of transactions costs. Finally, the recent run-up in home prices makes it unlikely that low income homebuyers will see capital gains on their homes in many bubble inflated markets, and may suffer substantial capital loses. Given these circumstances, homeownership is likely to be a losing proposition for many low income families. Government pro-grams that push low income families into homeownership are likely to benefit realtors, mortgage bro-kers, and other intermediaries, rather than the families who are the targets of this aid.140 120 100 80 60 40 20 0 -20 -40 -60 Homebuyer Mortgage Issuer Realtor Per cent
n
APPENDIX
T
he cost of purchasing a home is set at $130,000, which is somewhat more than 70 percent of the cost of the median home in 2004. The cost of the median home was $158,100 in 2002(American Statistical Abstract, 2003, table 949, Census Bureau). From the first quarter of 2002 to the first quarter of 2004 the average price of existing homes increased by 15.6 percent according to the Housing Price Index (www.ofheo.gov/media/pdf/1q04/hpi.pdf), which would raise the price of the median home to $182,700 in 2004.
The calculations assume that rent is equal to 7.1 percent of the sale price of a comparable home (a ratio of sale price to annual rent of 14 to 1). This ratio of rent to sale price is considerably higher than the actual ratio of the median rent to the median sale price. The median rent in 2004 is approximately $8,400 (the median rent of $7,596 in 2001[American Statistical Abstract, 2003, table 960] adjusted upward by the 10.5 percent increase in the rent component of the CPI from the first quarter of 2001 to 2004), which gives a ratio of median rent to median sales price in 2004 of just 4.6 percent, or a ratio of sales prices to rent of 21.8 to 1. The higher ratio of rent to sales price used in this analysis assumes that the median rent unit is considerably inferior to the median owner occupied unit — effec-tively that the quality of median rental unit is equal to approximately 65 percent of the quality of the median owner occupied home. A lower ratio of rent to sale price would obviously tilt the calculation even more towards renting.
The calculations assume that the purchaser must make a down payment equal to 5 percent of the sale price, in additional to covering closing costs equal to 4 percent of the sale price. The closing costs include points on a mortgage (assumed to be a fixed rate 30-year mortgage), payments for title search and title insurance, lawyers’ fees, the cost of an inspection, and state tax and transfer fees. Since some of these fees, such as a home inspection, title search, and lawyers’ fees are largely independent of the price of the house, they are likely to be a substantially higher portion of the sale price of a low cost home than of the average house. The calculation assumes that property taxes average 0.5 percent of the price of the home, and that maintenance and insurance costs average 1.0 percent. The latter figure is at the low end of conventional recommendations in consumer guides on expected maintenance costs. (Many homeowners save on maintenance costs by undertaking many repairs themselves, but an accu-rate calculation of ownership costs would have to assign an opportunity cost to the time spent on home repairs.) Both taxes and maintenance costs are assumed to rise in step with the inflation rate, which is assumed to be 3 percent annually.
The mortgage interest is assumed to be 6.3 percent, the prevailing interest rate on thirty-year mort-gages, as of June 2004. This rate is probably artificially low for a thirty-year mortgage, since a buyer with only a 5 percent down payment would typically have to buy mortgage insurance, which would add approximately 0.5 percentage points to the interest rate. Many low income homebuyers may also find themselves paying a higher mortgage rate if they are refused credit by traditional lenders and end up going into the sub-prime market. On the other side, many homebuyers will opt for variable rate mortgages, which will offer a lower interest rate (and typically lower points), at least in the short term.
The sales price assumes that the only charge is a 6.0 percent realtors commission. This is almost certainly an understatement of average closing costs, primarily because it excludes lawyers’ fees charged to the seller, and also the transfer taxes and registration fees that many states charge.
The rent is assumed to increase at the 3.0 percent annual rate of inflation for each of the four years that are included in the calculation. The imputed interest assumes that the renter placed their savings — both from the original down payment and closing costs, and from the lower annual costs — into a savings account or bond that paid 5 percent nominal interest.
The total cost sums the rent or cost of owning, after netting out all the costs and payments. In the case of renting, the assumed interest is the only deduction from four years of rent. In the case of homeownership, the sales price of the home is deducted from costs.
n
ENDNOTES
1 Dean Baker is the co-director of the Center for Economic and Policy Research. Danilo Pelletiere and Diane Schwartz gave helpful comments on earlier versions of this paper. This publication was funded in part by the Annie E. Casey Foundation and Fannie Mae Foundation. We thank them for their support but acknowledge that the findings and conclusions presented in this publication are those of the author alone, and do not neces-sarily reflect the opinions of the foundations, or their officers or directors.
2 Baker, D. 2002, (“The Run-Up in Home Prices: Is It Real or Is It Another Bubble? Center for Economic and Policy Research [http://www.cepr.net/Housing_Bubble.htm]).
3 Reid, C. 2004, (“Achieving the American Dream? A Longitudinal Analysis of the Homeownership Experiences of Low-Income Households,” Department of Geography, University of Washington).
4 It is reasonable to assume round-trip transactions costs in the range of 10 percent of the purchase price. Realtors commissions are typically in the range of 6-7 percent, the fees on issuing a mortgage are usually in the range of 2-3 percent of the value of the mortgage. Other costs, such as a home inspection, title search, and lawyers’ fees, are often flat fees, but these costs will typically represent a larger percentage of the sale price for low cost homes than high cost homes. In addition, several states have real estate transactions taxes (typically in the neighborhood of 1-2 percent) that add to the cost of buying and selling a home. For purposes of this analy-sis, it is assumed that transactions costs average 10 percent of the purchase price, although a more careful examination may find the true average to be somewhat higher or lower.
5 Baker and Baribeau (“Homeownership in a Bubble: The Fast Path to Poverty, Center for Economic and Policy Research 2003, [http://www.cepr.net/homeownership_in_a_bubble.htm]) examined the trend in home prices by zip code in Los Angeles over the last five years. They found that even in the zip codes with the lowest average home prices, the rate of price increase substantially exceeded the overall rate of inflation over the years from 1995 to 2002.
6 It is worth noting that in the set of assumptions in the table, the annual cost of owning exceeds the annual cost of renting, so the poor return to ownership is not simply a result of short duration of homeownership, although the one-time costs associated with buying and selling would be spread over a longer period of time, if a homeowner remained in the house for more than four years.
7 The assumption of a 5 percent interest rate, while appropriate in the current interest rate environment, is extremely low by historical standards. More typically, government bonds have provided a return that is 3.0 per-centage points above the rate of inflation, which would imply a 6.0 percent interest rate. This would make the situation for homeowners appear even less favorable.