Usage of Geodata and Virtual Reality in the Modern Situation Visualization
B. Wagner 1
1 Fraunhofer IOSB, Fraunhoferstrasse 1, 76131 Karlsruhe, Germany – [email protected]
Gi4DM 2019
KEY WORDS: COP, CIMIC, Virtual Reality, GIS, 3D
ABSTRACT:
When a crisis arises, geographically referenced data is helpful in dealing with the situation. A map can provide a link between available data and stakeholders. It allows all participants to obtain an understandable model of the situation. For crisis management, hawse have developed an integrated system with an emphasis on ergonomics and data fusion. Visualization and interaction are tailored towards specific responsibilities as well as towards different devices such as smartphones, desktops and large displays. In addition to commonly available 2D geodata, highly accurate and up-to-date 3D geodata becomes more readily available. 3D geodata displayed on normal display devices, however, naturally lacks the third dimension. In order to gain a better understanding of the situation, we have added a virtual reality variant to its crisis management system. The VR environment allows meeting as a team, connecting local and remote participants, in the VR environment for a more efficient and natural discussion. In this VR meeting, all participants can work with the same geodata and annotations, providing a consistent view of the situation. To assess the additional value of 3D geodata and virtual reality visualization in this context, a user study was conducted comparing the performance using 2D geodata, 3D geodata and visualization in VR. The study provides insights into the task-specific value of 3D geodata and VR visualization.
1. CHALLENGE - SITUATION VISUALIZATION YESTERDAY AND TODAY
In military and civilian operations, such as Disaster management requires the effective management of spatiotemporal intelligence information. Disaster management forces different groups of specialists and, increasingly, non-governmental organizations (NGOs) to cooperate in civil-military cooperation (CIMIC). Because of their different technology and educational background, a common ground has to be found that bridges the gap between these actors. When an event with time and spatial reference occurs, data from various sources is collected to capture the problem. Strategies are being developed to solve the problem. The difficulties arising from the handling of spatial and temporal information data are the main problem.
If i.e. a flooding occurs initially, civilian rescue forces on the ground are deployed. These first responders usually know the area well. However, with increasing catastrophic development, external civilian forces must be supplied. In addition, military forces have to support a certain extent or type of disaster. In such a scenario, the forces must practice CIMIC to understand the scenario, build an effective model of what is going on, and develop strategies to solve the problem. They have to solve spatial and temporal problems and usually use maps. Maps are a tool that is understood by most civilian and military users. Maps are not uniform. Normally different user groups work with a different kind of maps and scales. As a rule, problems arise at the beginning of such cooperation. The different map layouts the accuracy of the maps and their relevance play another important role in the cooperation of the participants and thus is another challenge.
When fire brigades, medical rescue teams, police and military supporters try to work together to find a solution, they first need to understand the skills and conditions of the parties involved. This includes the technical skills and the level of training. The
participants use open and internal sources of information to solve the problem. If all this information is included in the maps, there are more ways to proceed.
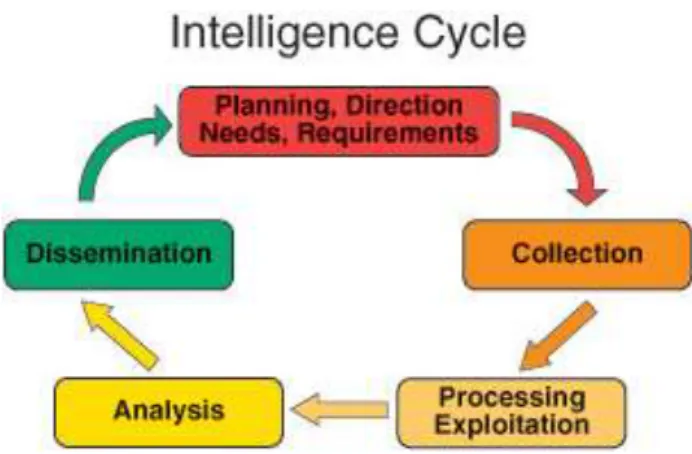
After creating this common operational picture (COP), a lack of further, currently relevant information is often found. Additional information is needed from other sources. They define the requirements in their information gathering process described by the Intelligence Cycle (Bacastow and Schuckman, 2007) in Figure 1.
Figure 1: The Intelligence Cycle after (Bacastow and Schuckman 2007)
Because of their different technological and professional backgrounds, the actors must find a basis for the COP that bridges them a COP that is designed to serve the understanding of all stakeholders. This means that anyone can read the information the COP in a way that he is familiar with. Therefore, the COP needs to be flexible in visual presentation and interaction. The information process must be flexible in The International Archives of the Photogrammetry, Remote Sensing and Spatial Information Sciences, Volume XLII-3/W8, 2019
dealing with any changes that occur in the disaster management process.
In addition, the COP must display the maps adapted to the tasks and roles, without losing the overview of the geography to the users. Coordinates must be found correctly, scenarios must be defined, all forces in the field must be visualized, etc. The COP must also display dynamic objects indicating their positions and status. Due to the increasing mobility of all devices and their ability to communicate, many sensor data including measurement position and time are available for analysis and decision making.
The map, the intelligence data and the location of the joint forces are the basis for building a COP. The challenge is not only to make it comprehensible to all actors and to adapt it to the respective roles and their tasks, but also to make them available and usable in the technologies commonly used (laptop, PC, tablet, etc.). It is also important to overcome the problem of formats and interfaces. International standards play a key role here.
2. APPROACH - DIGLT
As a system that fulfils the requirements listed above and many other requirements, the software Digital Situation Table (DigLT) was developed at the Fraunhofer IOSB. It combines geodata and reconnaissance data with optimized ergonomics. The composition of the COP is based on standardized geodata services according to international standards of the Open Geospatial Consortium (OGC), NATO-STANAG and other standards. The basic geodata is combined with data from images (IMINT) and information from humans (HUMINT). These data can be obtained directly from the information sources, but also from a NATO-compliant Coalition Shared Data Server (CSD). This reconnaissance data may be combined with other data and information sources, e.g. live sensor, videos or tracking systems (system for detecting object movement). As a result, a COP is created and an interaction suitable for the specific workspace is made possible. Thus, in CIMIC scenarios, the use of various data and information sources enables effective disaster management.
The DigLT software is web-based. Users can reach the COP via a website. It has been implemented in such a way that the user can interact with the hardware-typical interaction possibilities on most end devices (e.g. desktop PC, laptop, mobile phone) and thus meets the expectations of the user. The software provides a consistent look on each device, so that all users can easily find themselves, even if they change their role (task), which is common in disaster management.
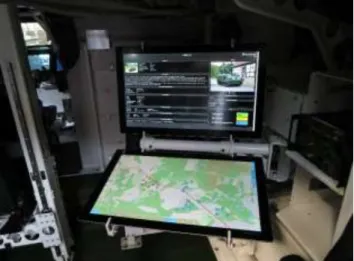
When they come together for disaster management, they usually bring their own hardware (see Figure 2). This hardware meets the requirements of its role in durability, water resistance, computational speed, screen resolution, user interaction and communication capabilities. Users are usually well-trained in using their hardware. It is also a cost advantage if it is possible to use this hardware to present the COP to the users. They can interact with their COP as they are used to. From the point of view of the human factor this reduces the duration of training and the error rate.
Figure 2: COP example in an APC PMMC G5 from FFG Flensburg, Germany.
For the task of the team meeting, a special hardware was developed in addition: A combination of table display and large vertical display on which a group of people can work together on the map (see Figure 3).
Figure 3: The map is shown on the table display, the additional information is displayed on the vertical display.
2.1 Role, task, and hardware-based usage
As described in (Wagner, et al., 2016), appropriate visualization depends on the user requirements and the technical specifications of the display. Due to these requirements, the DigLT software uses the OGC standard SLD (Styled Layer Descriptors) to create the map signatures. These are XML-based descriptions of how to render a geographic class (e.g., the "highway" class with an orange line in 5 pixel thickness). Generic SLDs have been created for the DigLT software to meet the needs of the specific user groups and display types used. For example, a military user will receive STANAG-compliant APP-6 icons in their map containing relevant military information. On the other hand, a tourist map is created with the same geodata basis, but the map style is more focused on a city map styling (see Figure 4).
The International Archives of the Photogrammetry, Remote Sensing and Spatial Information Sciences, Volume XLII-3/W8, 2019 Gi4DM 2019 – GeoInformation for Disaster Management, 3–6 September 2019, Prague, Czech Republic
Figure 4: Map layout adapted to role and task
Each of the above-mentioned user groups (military, civil security) can simultaneously work with the same data from the same data source on their own device. Generic SLDs in combination with database views are realized for a wide range of different types of vector data. This includes both free, civil and military geodata. This can be topographical data, but also sea and airspace data.
All user styles are also adapted to the resolution of the display device. For example, fewer details have to be shown at lower resolution density (see Figure 5). The implementation is made by a points account. The more detailed the geo-object is, the more points are consumed (see local roads to highways). In contrast, high-resolution hardware has more points available than low-resolution hardware.
Figure 5: Adaptation of the display to the hardware resolution with the same spatial extent.
2.2 Geodata standardization
To optimize and harmonize spatial data visualization within the COP, spatial data from multiple data sources can be requested through OGC services. Many civilian and military data are already available in OGC standards. In addition, however, the NATO STANAGs are also supported in order to integrate data that is not OGC compliant into the situation report. By supporting these standards, the DigLT software enables a rapid situation image representation and thereby also a fast and clear presentation of the respective relevant event.
OGC services and policies are being used as they are already supported by many information providers, users and GIS software, whether civil or military (here primarily standardized as NATO STANGs).
Once again, it becomes clear that the SLD standard fits in ideally with the existing, OGC-compliant system design. The reason for this is that it also offers the possibility of preparing geodata from different sources according to their own specifications, thus enabling the creation of a uniform, hardware- and user-specific layout.
2.3 Architecture and system approach
The aim of the developed software was to create a highly modular system for the management of a large number of spatial data, possibly with temporal reference, which supports a large number of display systems. For this purpose, the structuring of the DigLT software shown in Figure 6 was realized with corresponding software components.
Figure 6: Software components of the DigLT system and possible display devices.
The output devices range from the smartphone via the desktop PC to the DigLT and VR glasses (e.g. Oculus Rift, HTC Vive). Figure 7 shows a situation diagram generated by the DigLT software on a position table (left) and in a VR frame (right).
Figure 7: Output options of the DigLT software. The geodata may be static data, e.g. rasterized map images as well as dynamic data, but also sensor data or intelligence data from a CSD server. Static data is used with standardized OGC services such as the Web Map Service (WMS) and Web Feature Service (WFS), as well as a proprietary service, e.g. an ArcGIS server, or directly through files such as shapefiles and aerial photo files. These static data are rarely changed and can be cached on devices that are connected to the server with low network bandwidth, so they are always available.
Dynamic data is data that can change constantly and sometimes very quickly. For example, these are tracking data of an object, a video stream, the wind direction or water values. In order to consistently manage this data, a special database schema was developed. The data consists of objects that are uniquely identified by two IDs. The layer ID, objects of a similar type, and the object ID group the unique identifier within a layer. Each object can have any number of states. A state consists of a timestamp, a georeferenced geometry (such as a point, line, or area), and additional metadata that can be accessed with keys. Metadata includes additional information for an object. It is data describing the particular data acquisition, e.g. in a video, the viewing direction for a particular video frame or the speed and direction of travel at a data point of an object tracker. The states are managed by timestamps and can be retrieved via the index or the timestamp.
Static and dynamic data is shown in layers. In addition, so-called scenarios can be defined. A scenario is a geographical section with a very specific data. This is determined by the relevant layers, which are grouped accordingly. Scenarios The International Archives of the Photogrammetry, Remote Sensing and Spatial Information Sciences, Volume XLII-3/W8, 2019
enable faster navigation between predefined areas and a better overview of relevant geo-areas. Scenarios can be updated at runtime to add new layers or to change their grouping.
Figure 8 shows the default user interface of the DigLT-SW. The menu on the right contains the general functions of the software, e.g. the overview of the available layers, available live sensors and live data as well as available scenarios. The user can select the different options and switch between them. He can annotate from drawing tactical and graphic elements as well as freehand drawing, navigate through sensor data, enable 3D viewing, and more. The lower, horizontal timeline allows you to select the view for a specific point in time or – like a video - to view the events over time. With this function, completed events can be analysed. This can e.g. serve for the analysis of e.g. trainings.
Figure 8: GUI of the DigLT software
The DigLT-SW can also be used in this form in a VR environment. The cooperation of the users takes place beyond the Real / VR border without perceptible delay. Even within the VR environment, multiple users can meet for a briefing. This allows e.g. a personal meeting of users over long distances in the same virtual space, even though they are in completely different places (Figure 9). (Hoppe, et al., 2018)
Figure 9: Meeting within the VR environment
3. 3D GEOSPATIAL DATA IN VIRTUAL REALITY
The increasing availability of 3D geospatial data and the availability of the DigLT as a VR application (DigLTVR) raise the question if 3D geospatial data in VR provide users with a benefit (Robitzski, 2018). For this purpose, a user study was carried out. This examined whether results in a visibility analysis and orientation in VR compared to classical 2D maps are better.
The aim of the analysis was the comparison between different presentation options and different kinds of geo data. The focus was on the visualization of geoinformation or geodata.
Especially the impression of orientation and visibility was examined. 3D geodata on a desktop PC screen were compared with the representation of the 3D geodata in Virtual Reality. In addition, a comparison of these two combinations was conducted with the visualization of 2D geodata on the desktop PC screen.
To compare the different combinations the scenarios was, to analyse the visibility to a given object in the first subtask and in the second subtask to plan a route to this from a given starting point (Figure 10).
Figure 10: Find the best point of view for a certain object in VR.
3.1 Results of the evaluation
The results are composed of time measurements, route and position recordings, the planning data of the subjects and the answers of a questionnaire.
It shows that the 3D-VR users were able to determine the earliest possible visible points of view most reliably. The combination of 3D geospatial data on the desktop PC screen had the best results based on the number of correct points of view from which the object is visible. However, these points of view are all located very close to the object. Based on the required time from the subjects for the execution of the task, the classical combination of 2D geodata with desktop PC screen compared to the other combinations has proven over average. Here, however, most of the position errors are recorded.
3.2 Conclusion of the study
The result of 3D geospatial data in VR would probably continue to improve if the end user would continue to receive aids in VR and customization of the user interface. These include existing tools and aids, such as field of view analyses, an overview map with the current position, the option of a bottom view, etc. In future studies, these findings will be implemented and re-evaluated.
4. SUMMARY AND OUTLOOK
The software DigLT-SW was developed to offer an interactive access to geodata on every device. This allows emergency services to display a COP on their device they are used to and work with. The DigLT SW supports the OGC and STANAG services as standards to easily retrieve various geographic data databases and combine that information with reconnaissance data. The goal is to get a clear overview of the situation. A role-based approach enables distributed work on a COP by different users on different devices. Interfaces allow the connection of sensors or even shared data servers to use their data within the COP. The DigLT-SW runs synchronously on different devices The International Archives of the Photogrammetry, Remote Sensing and Spatial Information Sciences, Volume XLII-3/W8, 2019
(from a smartphone to a video wall or VR glasses), to present each employee the up-to-date COP. Thus, both local and arbitrarily distant forces can work real and virtual with the situation.
Future work will focus, on better integration of mobile participants, taking into account privacy issues. Another future topic is the further development of the virtual DigLT.
REFERENCES
Bacastow, T. and Schuckman, K., “Foundations of Geographic Information and Spatial Analysis” Lession 7: The
Intelligence Process.1st February 2016 https://courseware.e-education.psu.edu/courses/bootcamp/lo07/09.html
(2007).
Hoppe, A.; Reeb, R.; Camp, Florian van de; Stiefelhagen, R., “Virtual, augmented and mixed reality: Interaction, Navigation, Visualization, Embodiment, and Simulation” 10th International Conference, VAMR 2018, held as part of HCI International 2018, Las Vegas, NV, USA, July 15-20, 2018. Part I (2018). Robitzski, D., 25 Apr 2018: “The US army is using virtual reality to train their soldiers to navigate real cities”. https://www.weforum.org/agenda/2018/04/soldiers-are-training-in-virtual-environments-generated-from-real-cities
Wagner, B.; Eck, R.; Unmuessig, G.; Peinsipp-Byma, E., "Interactive analysis of geodata based intelligence," Proc. SPIE 9825, Sensors, and Command, Control, Communications, and Intelligence (C3I) Technologies for Homeland Security, Defense, and Law Enforcement Applications XV, 98250N (12 May 2016); doi: 10.1117/12.2222534
The International Archives of the Photogrammetry, Remote Sensing and Spatial Information Sciences, Volume XLII-3/W8, 2019 Gi4DM 2019 – GeoInformation for Disaster Management, 3–6 September 2019, Prague, Czech Republic