Working Paper
225
May 2011
Evidence from a Randomized Controlled Trial in Rural
China’s Junior High Schools
Di Mo, Linxiu Zhang, Hongmei Yi, Renfu Luo, Scott Rozelle, Carl
Brinton
Abstract
Recent anecdotal reports suggest that dropout rates may be higher and actually increasing over time in poor rural areas. There are many reasons not to be surprised that there is a dropout problem, given the fact that China has a high level of poverty among the rural population, a highly competitive education system and rapidly increasing wages for unskilled workers. The overall goal of this study is to examine if there is a dropout problem in rural China and to explore the effectiveness that a Conditional Cash Transfer (CCT) program could have on dropouts (and mechanism by which the CCT might affect drop outs). To meet this objective, we conducted a randomized controlled trial (RCT) of a CCT using a sample of 300 junior high school students in a nationally-‐designated poor county in Northwest China. Using our data, we found that the annual dropout rate in the study county was high, about 7%. We find, however, that a CCT program reduces drop outs by 60%; the dropout rate is 13.3% in the control group and 5.3 % in the treatment group. The program is most effective in the case of girls, younger students and the poorest performing students.
April 2011
School Dropouts and Conditional Cash Transfers: Evidence from a Randomized Controlled Trial in Rural China’s Junior High Schools
Di Mo, LICOS Centre for Institutions and Economic Performance, K.U. Leuven Linxiu Zhang, Hongmei Yi and Renfu Luo, CCAP, IGSNRR, Chinese Academy of
Sciences
Scott Rozelle and Carl Brinton, Stanford University
Acknowledgement:
The authors gratefully acknowledge the collaboration of Zigen, an NGO that is working in the region on a series of educational projects. The authors wish to provide special thanks to Jade Chien, Funden Wang and his wife (and their foundation, IET) and LICOS (KULeuven) for the financial and moral support for the evaluation part of the project. Ai Yue and Lei Liu also deserve thanks for their assistance with data collection and useful collaboration throughout the project.
School Drop Outs and Conditional Cash Transfers: Evidence from a Randomized Controlled Trial in Rural China’s Junior high schools
1. Introduction
Poverty has been found to be closely related to low levels of educational attainment and high dropout rate (Brown and Park, 2000; Filmer, 2000). In most developing countries, parents face high costs of education (for school fees and required inputs). As a result, both the limited investment in education that poor families can make (because they are poor) and the lower quality of teachers and school facilities in poorer areas have been shown to influence the decision of students (and their parents) to drop out (Banerjee et al., 2000; Gould Lavy and Paserman, 2004). This decision making is part of the reason why poor and disadvantaged students chronically perform poorly and have high rates of drop out (Hanushek, Lavy and K. Hitomi, 2008). In 2002, 113 million children of primary school age around the world were not enrolled in school (UNDP, 2003). Of this, 94 percent of the dropouts lived in developing countries (UNESCO, 2002). In 2000 the secondary gross enrollment rates were only 86 percent in Latin America, 66 percent in the Middle East and North Africa and 47 percent in South Asia (UNESCO, 2003; World Bank, 2003).
Even when school tuition and fees are zero, dropout has often been observed when education systems are competitive (Glewwe and Kremer, 2006). Researchers found that in competitive educational systems where there are limited spaces in schools, quality-based tracking and high-stakes entrance tests, the probability of having students drop out is higher (Clarke, Haney and Madaus, 2000; Reardon and Galindo, 2002). More poorly
performing students are discouraged well before the tests because they have lower
expectation of success in the system (Valenzuela 2000). Other research has suggested that test-based school systems make schools more likely to push out at-risk students in an effort to raise overall tests scores, especially when the reputations of schools are connected with test results (Velez and Saenz, 2001). Increased dropout rates are often observed among students from poor families since they are less willing and/or able to invest in learning (ceteris paribus) and are less able to compete with richer students in securing the limited number of spots in the school system (Orfield and Wald, 2002).
At the same time, increasing wages in the unskilled labor market may drive students out of school as the opportunity cost of schooling rises. When wage rates are rising, students can be seen to reduce their educational attainment targets, even when schooling is free (Angrist and Lavy, 2009; Fiszbein and Shady, 2009). Gender and age can thus be critical factors in dropout, if boys are more likely to leave home (at an earlier age) for a job and if older children are more likely to find a job that has relatively higher rates of pay. In fact, it has been found that girls often have higher enrollment rates than boys when the unskilled wage rate is rising (even when the enrollment rates for boys were higher than that for girls during the primary school years—Glewwe and Kremer, 2006). Moreover, older students frequently are found to attend school less and are less likely to be promoted to the next grade than younger students (Barrera-Osorio et al., 2008; Hanushek, 2006).
In recent years other parts of the world facing dropout and other educational problems have effectively employed a new type of program—conditional cash transfer (CCT). In its most basic form a CCT program provides payments (cash transfers) to
parents conditional on their child’s enrollment in school. The World Bank (2009) reports that more than 20 developing countries have some type of CCT program in place. While these programs were initially implemented in Latin America, since the mid-2000s CCT programs have started to spread out over the world. A large body of studies have
demonstrated that CCT programs have been able to raise schooling rates in various parts of the developing world (Baird, McIntosh and Özler, 2009; Chaudhury and Parajuli, 2008; Glewwe and Olinto, 2004; Schultz, 2001; Shady and Araujo , 2008; among others).
The effect of CCTs is also found to be heterogeneous among subgroups of the population. For instance, CCTs have been found to have larger impacts on girls than boys in Turkish secondary schools (Ahmed et al., 2007). Studies also often find that older students respond more to CCTs since the marginal impact is larger for the older children (Attanasio et al., 2005).
The international literature is relevant for many of the issues of dropouts in China. Although official statistics report low rates of dropout for China’s schools, including lower secondary schools, recent anecdotal reports suggest that dropout rates may be higher and actually increasing over time—at least in poor rural areas. Dropout rates which are higher than 2.6% (the official target and level reported in the 2006 China Yearbook of Education—MOE, 2006) have often been reported in studies about rural junior high schools (Li, 2010; Tong, 2010).
Although the Ministry of Education may wish there were no drop outs, there are many reasons not to be surprised that there is a dropout problem, given the fact that China is a country that has many of the exact characteristics that are consistent with high rates of dropout. Students in China are confronted with highly competitive entrance exams if
they are to be promoted from junior high school to high school and from high school to college (Liu et al., 2010). If students from rural China do not score high enough on these exams, they are not allowed to enroll in academic high schools or colleges. It has been reported that even in the rural areas of developed coastal provinces less than half of the junior high school students can test into high schools (Chen, 2008).
Perhaps most importantly, the opportunity cost of attending schools is rising as wages for low-skilled jobs are increasing nationwide. In recent years labor shortages have been reported to be plaguing a number of industries (Han, Cui and Fan, 2009). Partly as a consequence of these shortages, the China Urban Labor Survey (a survey conducted in five large cities in 2001 and 2005) indicated that the mean real hourly wages of migrants have been increasing by 8 percent per year between 2001 and 2005. Another paper showed that the real wages of migrant workers increased by 9.8 percent in 2006 (Park, Cai and Du, 2007). Such an increase in the opportunity cost alone might be a large inducement for many to consider dropouts. This might be especially true in poor rural areas considering the level of poverty and poor understanding about the future returns to schooling. In fact, the media has begun reporting cases that children younger than 15 years old have been hired to staff low-skilled jobs in China’s coastal provinces (Sina News, 2010 and 2011)
Given the rising dropout problem in China, there is surprisingly little empirical evidence that is available to help us understand the nature of it and effective ways to combat it. China, the world’s largest developing country, and ironically typically a country that is out in front of the experimentation curve, has been conspicuously absent from the list of countries that have experimented with CCTs as a way to improve
education outcomes. In addition, our interest extends to also understanding more about the mechanism through which CCTs affect dropout rates; in the literature such attempts are rare. The only exception we found is the study of Linden et al. (2008), which shows that CCTs cause a reallocation of responsibilities within the household and thus increases the attendance of treated students.
The overall goal of this study is to examine the dropout problem and to explore the effectiveness that a CCT program could have on dropouts (and mechanism by which the CCT might affect dropouts). To meet this broad goal, we have several specific objectives. First, we seek to document the extent of and nature of dropouts among junior high school students. Second, we will measure the effectiveness of the CCT intervention on reducing dropouts and assess if it is more effective on certain subgroups of students. Finally, we will try to identify the mechanism by which CCTs might be affecting the dropout rate.
One of the main limitations of our study is that it is restricted to one county, the county in which the CCT experiment is being implemented. Only one county was chosen due to limitations of funding and organizational resources. Although we understand that because of this it is not totally assured that the results can be generalized to other regions of China, the location of the study is arguably representative of China’s poor western areas. In 2008 the average annual rural income was only 1024 Yuan (150 USD at nominal exchange rates and 297 USD in Purchase Price Parity terms, according to the benchmark estimates of 2005 World Bank International Comparison Program—World Bank, 2008). It also is typical in terms of the rate of outflow of migrant workers. The county has few agricultural resources and has poor transportation infrastructure and
connections to the rest of China (Guo and Zhang, 2008). Solving the dropout problem and improving the quality of education of such a poor county is not only important (in and of itself) but there may be lessons for the rest of China.
The rest of the paper is organized as follows. Section 2 explains the research design of the study, describes the dataset and reviews the study’s statistical approach. Section 3 looks at the nature of dropouts in our sample, examining both the rates of dropout and trying to identify who is dropping out. Section 4 analyzes the effectiveness of CCTs in reducing dropouts. We not only examine the descriptive and multivariate results to see how many students are kept from dropping out due to the CCT program, we also seek to understand if the CCT program affects different groups differently. Section 5 then seeks to identify some of the mechanisms by which CCTs may be affecting the dropout rate, including examining if CCTs increase test scores, reduce commuting or have other effects. Section 6 concludes.
2. Research Design, Data and Statistical Approach
We conducted a randomized controlled trial (RCT) to assess the effectiveness of a conditional cash transfer (CCT) program using a sample of students in schools in a poor county in Northwest China (Figure 1). The county is located in a remote, mountainous region on China’s Loess Plateau. We do not, however, identify the county by name to preserve anonymity of the officials and educators that are running the schools in the study area. All 10 junior high schools (serving students in grades 7 to 9) in the county
participated in our survey. There were a total of 1507 grade 7 students in the sample schools.
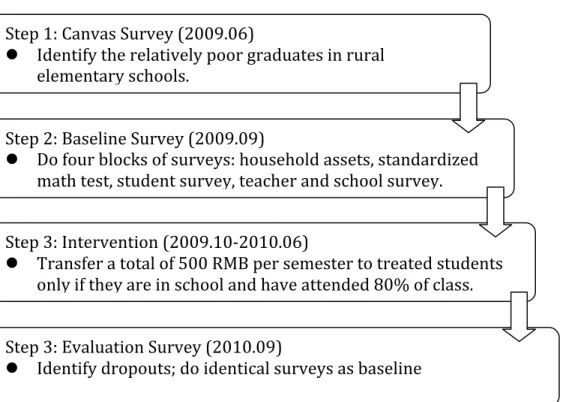
Among the more than 1500 students in the county’s grade 7 classes, we chose the poorest 300 students to participate directly in the RCT.1 To choose this sample of 300 students, three months before the students in the county began grade 7 (when the students were in their last month of grade 6 in their elementary schools in June 2009), we visited every grade 6 class in every elementary schools in the county. When we were in the schools, our enumerator teams independently elicited 2 rankings. One ranking was from grade 6 homeroom teachers. The other ranking was from the school’s principal. If a student appeared in both rankings (as one of the poorest 10 students in the class), he or she became part of our list of the poorest students in the county. In this way we identified a total of 300 of the county’s poorest students. After these grade 6 elementary school students matriculated into junior high school, there was an average of 30 “poor students” (defined in our sample as the poorest grade 7 students in the county) in each junior high school. The running of this canvas survey is step one in the survey design (Figure 2, Step 1).
After we had identified the sample and after the students had entered junior high school in September 2009, the research team conducted a baseline survey of all 1507 junior high school students (including the 300 sample students—Figure 2, Step 2).
1 We chose 300 students to be in the study (150 in the treatment group and 150 in control group)
based on our power calculations. With a minimum effect size of 0.25 with 80 percent power at the five percent significance level, we calculated that we need 130 students. We assumed an intra-cluster correlation of 0.05, a pre- and post-intervention correlation of 0.5. To be conservative, we include 150 students in each RCT group.
During the survey we collected data from students, the student’s family, teachers and the school principals (for more details, see the Data Collection subsection below). The
baseline was done prior to the time that the poor students in the sample had been assigned to either the treatment or control group, so the students (and enumerators) were blind about the assignment status.
Following the baseline survey, our research team randomly assigned half of the 300 students (150 students) in sample to the treatment group and half (150) to the control group (Figure 2, Step 3). The students in the treatment group became the students who were enrolled in the CCT program in October 2009 (for more details, see the Intervention subsection below). The (parents of the) control students received no CCT payments. Because we did not tell them, the students in the control group were unaware that they were acting as controls. Access to the baseline data before dividing the 300 students into two groups allowed us to use the data to ensure that the treatment and the control groups were balanced (that is, were statistically identical with respect to certain key variables— see below for more details).
A year after the intervention in September 2010, we implemented the evaluation survey (Figure 2, Step 4). During the survey, we identified the dropped out students, distinguishing them from those who transferred out, repeated a grade or were temporarily absent. We also collected other data that allow us to evaluate the impact of the CCT program.
Figure 3 depicts the flow of participants through each stage of the study. At the time of the baseline survey we surveyed 1507 grade 7 students in the 10 junior high schools in the study county. The 300 students that had been identified as the poorest
students in the county, as described above, were randomly divided into the treatment group (150 students) and the control group (150 students—henceforth Control Group 1). We also followed the other 1207 non-poor students and use them as Control Group 2, an alternative control group (although knowing that by construction the students in Control Group 2 are less poor and likely differ in other ways). After the intervention and an elapsed time of one year, when we returned to the sample schools and discovered that there were students that dropped out and students that transferred to schools outside of the county. In total, 270 of the original 300 poor students were surveyed during the evaluation survey. During the evaluation survey, we found and surveyed 1085 of the 1207 students in Control Group 2.
According to data from the baseline survey, we can see that our sample procedure was successful in generating a balanced sample and that the students in the treatment group and Control Group 1 were poor (Table 1). Specifically, when comparing the means of a set of control variables between students from the treatment group (column 1) and Control Group 1 (column 2), the differences (column 4) are all statistically insignificant (note all p-values in column 5 are greater than 0.05). The control variables in Table 1 include measures of poverty (row 1), student characteristics (rows 2 to 4), family
characteristics (rows 5 to 7), other characteristics about schooling (rows 8 to 10) and the characteristics of the homeroom teachers of the students in the treatment and control groups (rows 11 to 13). Although there are statistical differences between students from the treatment group (column 1) and Control Group 2 (column 3), which can be seen by the large differences (column 6) and relatively low P-values (column 7), such results are not unexpected. In fact, the much higher level of assets for those in Control Group 2,
relative to the Treatment Group (row 1) means that those students in the Treatment Group and Control Group 1 are indeed relatively poor.
The Interventions
Within three weeks of the completion of the baseline survey (and processing of the data that allowed us to randomly assign the students into two identical groups), we began the implementation of the CCT program. In as low profile of a way as possible students were informed of their selection into the CCT program. To do this, a staff member from the principal’s office asked each treatment student to come to school office on a one-to-one basis (and not through a public announcement). This was typically done immediately after school was let out for the day to further minimize the disruption to the daily schedule of the students. The announcement of enrollment into the CCT program was done in the presence of the parents and only the treated students joined the meeting (which included the CCT program administrator, the student, his/her parent and the principal). We included the principal in the program in order to give the program the “blessing” of the school and to increase the confidence of the parents that this was a bonafide schooling activity and not some commercial scam. The program was described as a new program being implemented by an NGO and the Chinese Academy of Sciences that were providing financial aid for poor students. Principals were asked to treat these students exactly the same as other students.
The parents and students were told that if (and only if) the student was still in school at the end of each semester (and had attended 80% of the classes), they would receive 500 RMB. The enrollment (or take-up) rate was 100% since no parent turned
down the offer of having their child enrolled into the program. Unannounced attendance checks were conducted throughout semesters by our NGO partner. The NGO was told to not spend any additional time with the CCT program enrollees (doing activities other than providing the scholarships). For treatment students that attended school during the first year, the cash transfer was given directly to the parents in cash. The amount of the transfer was 500 RMB for each semester. By way of comparison, this amount was not small relative to the annual income of a typical farmer in the county. However, it was a bit less than one month’s wage if a student dropped out and found a job in a coastal factory working as a migrant worker. In 2009 migrant workers earned, on average, 1400 yuan per month (China National Bureau of Statistics, 2009).
Data Collection
Our enumeration team visited each junior high school in the county and undertook a two-part survey effort: a baseline survey which was conducted before the announcement of the program and an evaluation survey which was conducted one year after intervention (the intervention was implemented initially shortly after the baseline). During both surveys, separate survey instruments were administered to students, teachers and the principals of the schools.
The student survey consisted of four blocks. In the first block, students were asked to fill out a check list of the household assets.2 A value was attached to each
2 These household assets include a series of electric appliances that are most popular in rural
households such as color TV sets, water heaters, DVD players, range hoods, microwave ovens, refrigerators and washing machines (National Statistics Yearbook, 2008).
appliance (based on the National Household Income and Expenditure Survey which is organized and published by the China National Bureau of Statistics—CNBS, 2007) to produce a single metric of the household holdings. The variable of household assets value was then produced by summing the values of all of the appliances. This variable is an attempt at a rough value of household assets, which serves as an indicator of the poverty level of the household (Poverty Indicator).
In the second block, all students were given a standardized math test. The students were required to finish the test in 30 minutes. Our enumeration team strictly enforced the time limits. The students were closely proctored in order to minimize the ability of the students to cheat. We then transformed the math scores into units of normalized, standard deviations to form the variable of the pre-test score of each student (a measure of student academic performance before the intervention).
In the third block, enumerators collected data on the characteristics of students and their families. The age and gender of each student that were generated from this survey block, along with pre-test scores, created a set of three variables that measure the characteristics of the student. Also from this survey block, we produced a set of family characteristics which include whether the student had sibling(s), and the education levels of each student’s father and mother (whether they had finished elementary school).These variables or similar ones have been used in many studies to explain inter-student
differences in academic performance and schooling rates (e.g., Behrman and Rosenzweig, 2002; Coleman, et al., 1966; Currie and Thomas, 1995; Fryer and Levitt, 2004).
In the fourth block, we asked questions about other characteristics which were linked with each student’s schooling. One set of questions asked about the location of
each student’s home and living conditions during schooling, such as the commuting time between home and school (in minutes) using the student’s most frequently utilized means of transportation and whether the students lived with their family or in the boarding facilities of the school. We also asked about student interests, aspirations, confidence in school and about plans for further education. For example, we asked if students planned to go to high school/vocational school or to join the labor force after graduation from junior high school. In the analysis (described below), the information from these blocks of the survey was used to create a set of control variables.
The teacher and school survey collected information about homeroom teachers and school resources. Homeroom teacher characteristics that were generated from this instrument include: teacher’s gender, teaching experience in years and whether teachers would be rewarded (or given a bonus) if students in his/her class performed well (an institution that is common in some but not all of China’s schools). These characteristics, used to measure the quality of teachers and the incentives that they face, are measures that are also widely used in educational studies (e.g. Koedel and Betts 2009; Lai et al., 2009; Rivkin, Hanushek and Kain, 2005; Rockoff, 2004). Instead of including variables to measure school-level characteristics, differences in school resources and quality are controlled by including school dummies (or indicator variables).
The second part of survey effort, the evaluation survey, was conducted in September, 2010. The survey instruments—for the students and teachers—were almost identical to that of the baseline survey. The standardized math test questions were drawn from the same pool as the year before, but, the questions were different. In addition, a major effort was made to find out who dropped out (and confirm that the student indeed
did drop out and did not just transfer to another school or was absent). Since enumerators were blind about the group division (Treatment, Control Group 1 and Control Group 2), not only did we manage to identify the confirmed dropouts among the RCT Treatment sample students, we also identified all the dropouts among the rest of the students in all 10 junior high schools (that is, those in Control Group 1 and Control Group 2).
Statistical Approach
We conducted the statistical analysis in three parts. First, we examined the determinants of dropout to better understand that who is dropping out of junior high school in rural China. Second, we test the impact of the CCT intervention on the dropout rate. In this part of the analysis we also examine the heterogeneous effects among subgroups of students. Third, we seek to identify the mechanism by which the CCT program is affecting dropouts. To do this, we analyze how CCT affect test scores and other
schooling characteristics, such as the commuting time between home and school, living conditions (whether student lives with his/her family during the school year) and the plan of the students to continue education after junior high school graduation. We present both descriptive statistics and multivariate analyses.
In the first part of multivariate analysis (to explain the determinants of dropouts) we used a probit estimator to examine who (students with what type of characteristics) are most likely to drop out. The model is:
(1)
where yicsis the dropout status of student i in class c in school s and equals 1 if the student drops out and 0 otherwise. The variable Xics is a vector of variables that includes the
baseline characteristics of students, including a student’s poverty status (and indicator variable that equals 1 if the household assets value ranks in the top decile and 0
otherwise), student characteristics (pre-test scores, gender and age), family characteristics (whether the student has siblings, the education levels of the student’s father and mother), other characteristics about the student’s schooling (commuting time between home and school, whether the student lives with his/her family and whether the student plans to continue education after junior high school graduation) and homeroom teacher
characteristics (teacher’s gender, teaching experience in years and whether the teacher is rewarded for his/her students’ performance on county-wide standardized tests). The symbol represents school fixed effects which are captured by a series of school dummies. In running the model specified in equation (1), we only use the students from Control Group 1 and 2 (because we can ignore the effect of the CCT). White’s
heteroskedasticity-robust standard errors are used to improve efficiency. Marginal effects are also computed for interpretation.
In the second part of analysis, we use two probit models which both include treatment dummy variables as a way to estimate how the CCT program affected the rate of dropout of treatment students relative to the dropout rate of the control students. The basic specification, without control variables, is:
. (2) In order to increase the efficiency of the estimation of α, we include the same control variables that were used in equation (1) above::
In both equations (2) and (3), Ti is a CCT treatment dummy that takes the value of 1 if the student was in the treatment group and 0 if the student was in the control group. The vector Xics is the same as defined above. School-level fixed effects are not included in the probit estimation in order to keep the model parsimonious. To check the robustness of our estimations, we also run OLS regressions ( included in the appendix of the paper—see Results Section below).
Following the literature, which (as shown in the introduction) suggests that there may be heterogeneous effects between subgroups of better-performing and worse-performing students, rich and poor students, girls and boys and younger and older students, we also examine the differential effects of the CCT program. We do this by estimating equation (3) among students with different pre-test scores, household assets values, genders and ages.
The approach is to divide RCT samples into subgroups of higher pre-test scores and lower pre-test scores (with the threshold of the median score), subgroups of higher assets value and lower assets value (with the threshold of the median value), subgroups of girls and boys, and subgroups of older and younger students (with the threshold of the median age, 13). We estimate the effect of CCT on each subgroup and compare it across groups. In estimation, a probit model is used without school fixed effects, which could be compared to the OLS results including school effects for robustness checks. When the pair of subgroups presents similar effects, we conduct a Wald test of the CCT effect under the framework of Seemingly Unrelated Regressions.
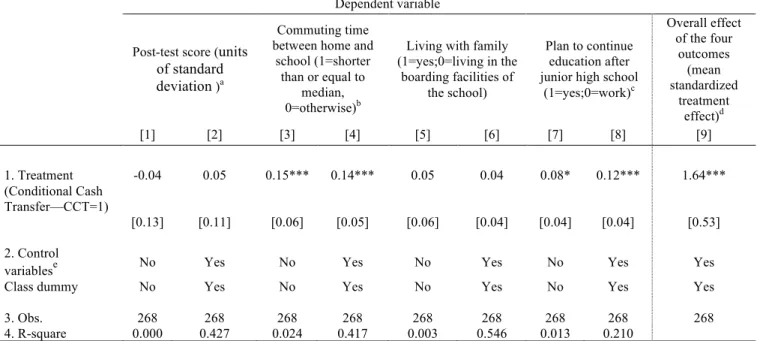
In the third part, we measure the impact of CCTs on some other outcomes which have been proved to be important determinants of dropout in the first part so as to explore
the possible mechanisms of CCT on dropouts. The outcomes that we decided to test include math test scores and other characteristics about schooling (commute time between home and school, living with family and plan to continue education after graduation). A similar model as equation (3) is used for each outcome variable. We include class level dummies in this set of estimations instead of homeroom teacher characteristics and school fixed effects to better control for any class or school level variation. OLS with heteroskedasticity-robust standard errors is used. Finally, the mean standardized treatment effect of all these outcomes is computed following the suggestion of Duflo, Glennerster and Kremer (2008) in order to correct for potential over-rejection of null hypothesis of multiple outcomes. 3
3. Results
We present both the descriptive and multivariate results in the following three parts. First, we report the dropout rates of all the students and those who are most likely to drop out from among them (in other words what are the characteristics of dropouts). Second, we show the impact of the CCT intervention on the dropout rate, and we investigate heterogeneous effects among subgroups of students. Third, we seek to identify the mechanism by which the CCT program is affecting dropouts.
3 The standardized effect of each outcome is computed by dividing the point estimate of the treatment
Dropouts in Rural China
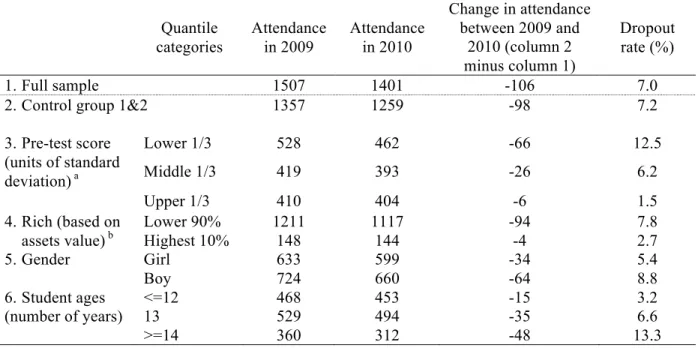
The data show that the dropout rate of the whole sample of junior high school students is 7.0%. This level of dropout—in the first academic year of junior high school—is nearly three times higher than the officially recognized level for the entire junior high school experience, 2.6% (Table 2, row 1). Among the 1507 grade 7 students, 106 students dropped out of school within one year of the intervention. Excluding the 150 treated students, the dropout rate rose to 7.2% (row 2).
Cross tabulations also suggest that the dropout rate is associated with academic performance, poverty, student gender and age (Table 2). Among Control Group 1 and 2, students dropped out less if their pre-test scores were higher. The bottom tercile of students (the students that scored the lowest) had a dropout rate of 12.5% (row 3). Students that scored in the middle tercile dropped out less, only 6.2%, and the top even less with 1.5%. Likewise, according to the descriptive statistics, wealth is correlated with lower rates of dropping out. Students in the top decile of students in terms of household assets value (the richer ones) dropped out at a rate of only 2.7%, which is 5.1% lower than the rest of students (row 4). Boys and older students also dropped out relatively more (rows 5 and 6).
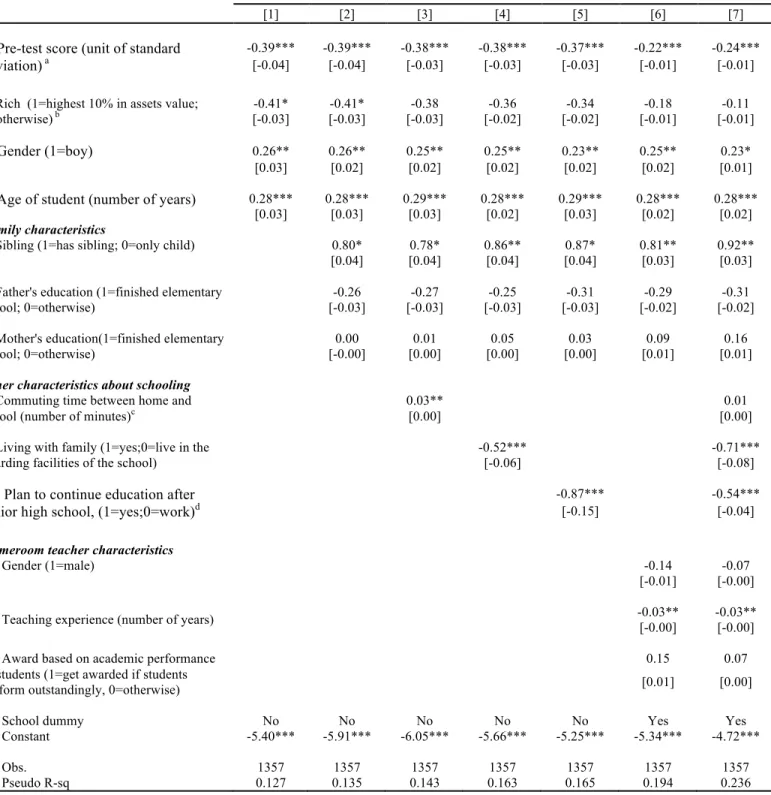
The results of our multivariate analysis, which admittedly is measuring only correlations, are consistent with the descriptive analysis (Table 3). The better-performing, richer, female and younger students are less likely to drop out. The signs of these
coefficients are consistent through different specifications and the significance levels remain mostly stable (rows 1-4, columns 1-7). We also find that the effect of poverty (defined as rich decile vs. the rest) drops when homeroom teacher characteristics and
school fixed effects are included (row 2, columns 6-7). It could be that relatively rich families self-select into schools and classes with more resources and higher quality teachers. In fact, this is likely also to be reinforced by China’s policy that encourages children to attend the schools in the local area (and the fact that some places/localities are richer than others). In the study county since it is mostly the case that students enroll in the junior high schools nearest to their home, this means that students who are residents of the county seat, which is a relatively better-off area, enroll in county junior high schools, which invariably have access to more educational resources and are staffed by more qualified teachers. At the same time students from rural villages and remote towns, those places that are relatively poorer, frequently enroll in the junior high schools in the local township, which invariably have access to fewer educational resources and are staffed by less qualified teachers. For more discussion on resource and quality disparities of rural schools, see Liu et al. (2010) and Zhuo (2006).
Our data also demonstrate that there are a number of other characteristics about schooling that are found to be highly correlated with dropping out. For instance, students who spend more time commuting between home and school are more likely to drop out (row 8). Students who live with their families at home (rather than living outside the village in the junior high school’s boarding facilities) are less likely to drop out (row 9). Finally, students who stated that they plan to continue with their education after junior high school graduation, unsurprisingly, are less likely to drop out (row 10). These estimates have shown to be robust in estimations with different sets of control variables except that the variable of commuting time is less significant when living condition is also included (rows 8-10, columns 3-5 & 7).
CCTs and Dropout
Descriptive statistics provide the initial evidence that the CCT program has reduced the probability of students dropping out (Table 4). This effect is seen most clearly when we compare the dropout rates of the students in the two RCT groups that were identical at the baseline—Treatment Group (the children that were enrolled in the CCT) and Control Group 1. While the dropout rate of the treatment group was only 5.3%, the dropout rate of Control Group 1 was more than double—13.3% (row 1). The difference, 8%, between these two groups is significant statistically (p-value of 0.02).
Table 4 also shows that differences exist among various subgroups of students. The treatment seems to have reduced dropout rates in all subgroups, but the difference is greater for the poorest performing students (row 2). In other words, when the treatment is given to poorer performing students, the CCT program has a more pronounced effect on reducing dropping out. Differences in the treatment effect (according to descriptive statistics) are also found in the cases of relatively richer students (row 3), girls (row 4) and younger students (row 5).
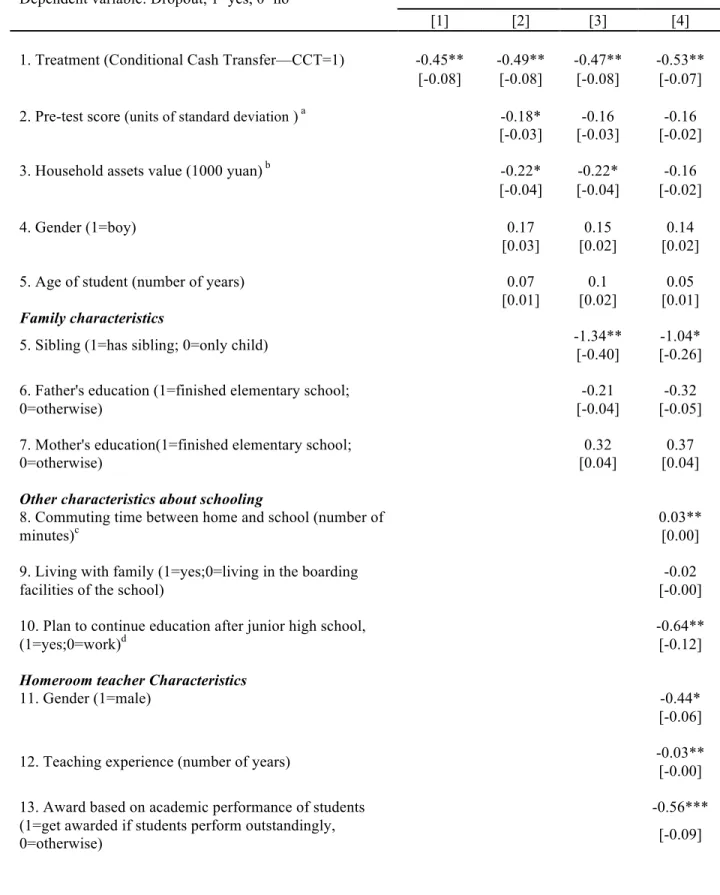
The results of the multivariate model are consistent with the descriptive statistics (Table 5). The CCT treatment is shown to reduce drop outs by 7% (Table 5, row 1). The estimates of the effect of CCTs on the dropout rate are also consistent and robust across all specifications of the model (columns 1-4). The same results are obtained using the OLS estimators that are defined in equation 3, but which have added school-level fixed effects (Appendix 1, row 1, all columns).
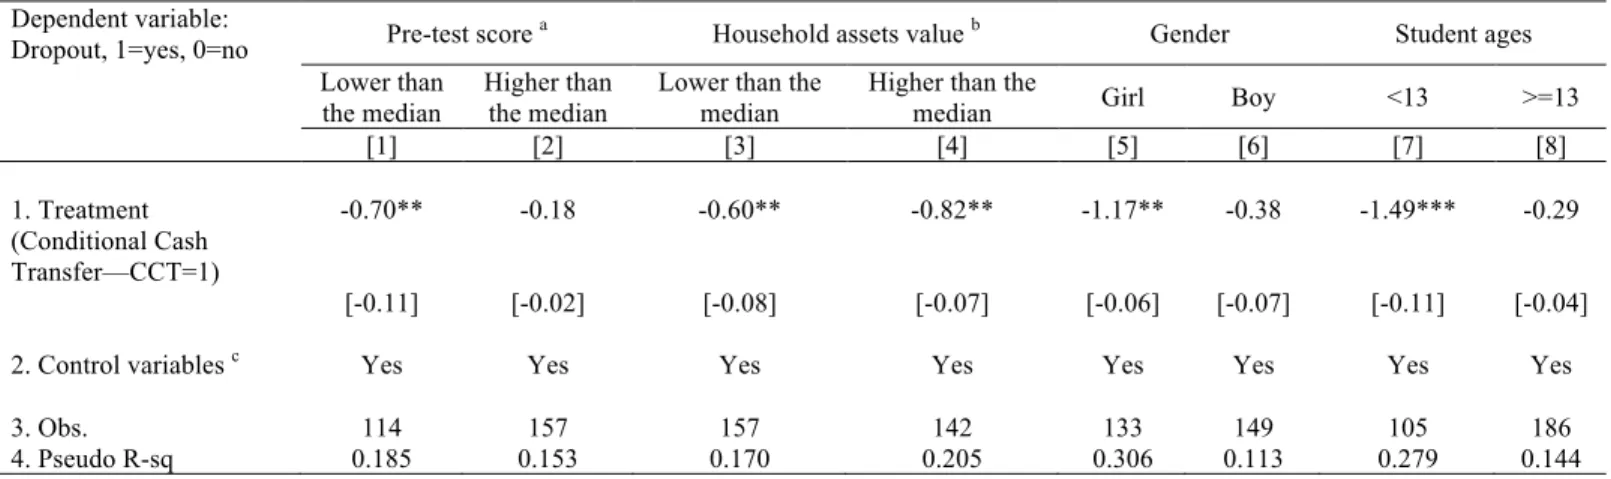
The multivariate analysis examining heterogeneous effects largely, but not totally, support descriptive evidence as well (Table 6). As we see in the descriptive statistics, the poorest performing students responded the most to being enrolled in the CCT. The drop out rate fell by 11% when comparing the poorest performing students in the treatment group with the poorest performing students in the control group. However, there was no effect of enrollment into the CCT treatment group among the better-performing students (columns 1-2). The relatively richer and relatively poorer students respond similarly to the CCT program (the reduction in dropout rate is around 7-8%). Wald tests confirm that the treatment effects are not significantly different between the two subgroups (p-value of 0.64). While we might expect poorer students to be more influenced by the program, it could be that the distinction of wealth between the two groups is too small. Since we drew the 300 students for our RCT sample from the poorest students of a nationally-designated poor county, in fact, all of the students are poor. Finally, boys and older students are less influenced by CCT. OLS estimation adding school fixed effects produces similar results (Appendix 2, row 1).
The Mechanism
In this subsection we seek to determine if our data can help us understand the mechanism that is driving the CCT program's impact on dropout. To do so, first, we discuss the possible implications of the analysis of the heterogeneous effects (reported above). Can we identify what are some of the possible causal mechanisms by looking at who was affected more and less by the CCT program? Second, we will examine the impact of the
CCT program on a number of other variables that might also help identify why the CCT program is working.
Interpreting the Heterogeneous Effects and Drawing Implications
Of course, one of the mechanisms of the CCT program may be that it helps tip benefit-cost ratios in favor of staying in school. In other words, transfer payments may be helping to offset the high opportunity costs of being in school. Such an interpretation is supported in part by the results that show that the CCT program reduces the dropout of girls and younger students more than boys and older students. This result is possibly due to the fact that since older and male students have higher opportunity costs (it is easier for them to get jobs and their starting wage may be higher), these types of students are influenced by CCT relatively less compared to younger students and female students.
The CCT program, however, may be doing more than reducing the opportunity cost. We say this because we note our strongest results is that the most poorly performing students responded the most to being enrolled in the CCT, and there appeared to be no effect of the CCT on the better-performing students. While part of this is likely to be an opportunity cost argument (the returns to schooling are likely higher for better students than poorer students), as noted in the discussion above, poorly performing students in most of the world’s highly competitive education systems drop out at high rates than better students (Banerjee et al., 2007; Glewwe and Kremer, 2006). For some reason, however, when we enrolled the more poorly scoring students in our pilot CCT program at the study site, the rate of dropout fell quite sharply. Can it be that a 1000 RMB payment is enough to tip the benefit-cost ratio so much for so many students that the transfer
payment’s monetary value alone is responsible? In fact, it could be that a program like this, that is targeted at the poor, which will by definition also target many poorly
performing students, may be special in the sense that few programs in China target these students. In China’s highly competitive in-class atmosphere, homeroom teacher,
classroom teachers and principals almost always direct most of their attention to the better-performing students. Hence, in a program like ours that randomly selected students for the program, regardless of classroom performance, it could be that these ‘heretofore neglected’ students were actually encouraged by the CCT program beyond the mere receipt of the payment. For once someone showed an interest in them. It is possible that this mechanism is part of the reason why the effect of the program was so high among these children.
Impacts on Other Variables
There is evidence from additional analysis of what things might be affecting dropout and what might not be. According to our descriptive analysis, student commute time between school and home is shorter for CCT program participants, with 51% of students in the Treatment Group spend shorter than or equal to the median commute time, while the rate is only 35% in control group (Table 7, column 2). In interviews with students, it was clear that with the additional money, some students rode the bus to schools rather than walked. One family told us they bought a bicycle and it made the student’s school life, or at least life on the road between school and home, much easier. The results also demonstrate that students in the CCT program had a higher rate of stating their plan/will to continue with education after junior high school education (or a student’s expectations about future
educational attainment) (Table 7, column 4). The ratio of students who stated that they plan to continue education is 8% higher in the treatment school than the control school (column 4). At the same time the analysis suggest that it is not because of improved performance. The effect of the CCT program is insignificantly different from zero when examining the effect on the scores of a standardized test (Table 7, columns 1-2). The descriptive evidence does not support the idea that the CCT program has reduced drop outs because it changes living conditions, either. Living conditions (whether students lived with their parents or lived in the boarding facilities of the school) were not changed between the baseline and evaluation (column 3).
Multivariate results are consistent with descriptive evidence (Table 8). Robust estimates of the effect show that in the treatment group students spend less time on commuting between home and school (columns 3 & 4). More students in the treatment group stated that they planned to pursue further education after junior high school (columns 7 & 8). Also the same as the descriptive results, the multivariate analysis does not suggest that the CCT program has affected test scores or living conditions of students (columns 1 & 2, columns 5 & 6). Finally, we also test the overall effect of the four outcomes and find the mean standardized treatment effect is significant at the 1% level.
4. Summary and Conclusions
Although official statistics report low rates of dropout for China’s schools, including lower secondary schools, recent anecdotal reports have suggested that dropout rates may
be higher and actually increasing over time—at least in poor rural areas. Therefore, the overall goal of this study was to examine the dropout problem with a more systematic set of data and to explore the effectiveness that a CCT program could have on dropout (and the mechanism by which the CCT might affect dropout). To meet this broad goal, we had several specific objectives. First, we documented the extent of and nature of dropout among junior high school students. Second, we measured the effectiveness of a CCT intervention on reducing dropout and assessed if it is more effective on certain subgroups of students. Finally, we tried to identify the mechanism by which CCTs might be
affecting the dropout rate.
In summary, in our study county dropout rates are, indeed, high. Between grade 7 and grade 8, 7.0 percent of all students dropped out. 13.3 percent of the poorest did. Several principals who were initially nervous about talking to us about this issue (since according to policy, dropouts are supposed to be highly discouraged) added anecdotally that dropout rates between grade 8 and grade 9 and during grade 9 may be even higher. If so, this means that more than 19.6% of students in poor rural China are not finishing junior high school.
There appears to be a way, however, to minimize this problem. According to the results of our randomized controlled trial, we discovered that the CCT program does reduce drop outs in the sample county. It is most effective in the case of girls and younger students, those groups in the sample that have lower opportunity costs for going to junior high school. As the opportunity cost rises, the program naturally becomes relatively less effective. Somewhat curiously, the biggest effect was on the poorest performing students. While we do not have evidence why, as seen in the discussion above, poorly performing
students in many competitive education systems do tend to drop out at higher rates than better students. Interestingly, when we enroll the more poorly scoring students in the CCT program, the rate of dropout falls sharply. However, it is not clear precisely why. Is this because the transfer is enough to compensate the students for going to school and not dropping out? Or is there some other effect? In China poorly performing students rarely get any attention and never get awards. Did this program, which was targeted at this heretofore neglected group of students, also have an encouragement effect? It is important for future research to answer this question.
Ultimately, the importance of our finding depends on the importance of keeping students in school. If the social return to education at this level is high, given China’s economic growth, it is imperative to take action now. The opportunity cost, which has induced many students to drop out, is still rising. Once the students drop out from junior high school, it is very unlikely that they will return to school. The opportunity of adult education is limited in China and is almost always under-invested in and, as yet, still deemed ineffective in most developing countries (UNESCO, 2009). Hence, the time appears to be now to begin battle against the scourge of dropout.
References
Ahmed, A., M. Adato, A. Kudat, D. Gilligan, and R.Colasan. 2007. “Impact Evaluation of the Conditional Cash Transfer Program in Turkey: Final Report.” International Food Policy Research Institute,Washington, DC.
Angrist, J. D. and V. Lavy. 2009. “The Effect of High-Stakes High School Achievement Awards: Evidence from a Group-Randomized Trial." American Economic Review
99(4): 1384–1414.
Attanasio, O., E. Battistin, and E. Fitzsimons, and M. Vera-Hernandez. 2005. “How Effective Are Conditional Cash Transfers? Evidence from Colombia.” IFS Briefing Notes BN54 . Institute for Fiscal Studies, London, UK.
Baird S., C, McIntosh, and B. Özler. 2009. “Designing Cost-effective Cash Transfer Programs to Boost Schooling in Sub-Saharan Africa.” Policy Research Working Paper No. 5090, The World Bank.
Banerjee, A., S. Cole, E. Duflo, and L. Linden. 2007. “Remedying Education: Evidence from Two Randomized Experiments in India.” The Quarterly Journal of Economics
122(3): 1235-1264.
Banerjee, A., S. Jacob, M. Kremer, J. Lanjouw and P. Lanjouw. 2000. “Promoting School Participation in Rural Rajasthan: Results from Some Prospective Trials.” mimeo, MIT.
Barrera-Osorio, F., M. Bertrand, L. L. Linden, and F. Perez-Calle. 2008 “Conditional Cash Transfers in Education: Design Features, Peer and Sibling Effects Evidence from a Randomized Experiment in Colombia.” NBER Working Paper 13890. Behrman, J., and M. Rosenzweig. 2002. “Does Increasing Women's Schooling Raise the
Schooling of the Next Generation?” The American Economic Review 92 (1): 323-334.
Brown, P. and A. Park. 2002. “Education and Poverty in Rural China.” Economics of
Education Review, 21: 523-41.
Chaudhury, N., and D. Parajuli. 2008. “Conditional Cash Transfers and Female Schooling: The Impact of the Female School Stipend Program on Public School Enrollments in Punjab, Pakistan.” Journal of AppliedEconomics 42(28): 3565-3583. China National Bureau of Statistics. 2007. Household Income and Expenditure Survey.
Beijing: China National Bureau of Statistics.
China National Bureau of Statistics. 2009. China Statistical Yearbook. Beijing: China National Bureau of Statistics.
Cai, F., and D. Yang, eds. Green Book of Population and Labor. Beijing: Social Sciences Academic Press.
Chen, S. 2008. “Guanyu Jingji Qianfada Diqu Gaozhong Jiaoyu de Sikao---Yi Haifeng Weili (A Note on High School Education in Under-developed Regions: Evidence from Haifeng County).” Heilongjiang Keiji Xinxi (Heilongjiang Science and Technology Information) 28 (23): 164-165.
Clarke, M., W. Haney, and G. Madaus. 2000. “High Stakes Testing and High School Completion.” National Board on Educational Testingand Public Policy 1(3). Coleman, J.S., E. Campbell, C. Hobson , J. McPartland , A. Mood, F. Weinfeld, et al.
1966. Equality of Educational Opportunity. Washington, D.C.: National Center for Educational Statistics.
Currie, J., and D. Thomas. 1995. “Does Head Start Make a Difference?” The American
Economic Review 85 (3): 341-364.
Duflo, E., R. Glennerster and M. Kremer. 2008. "Using Randomization in Development Economics Research: A Toolkit." Handbook of Development Economics, volume 4. Amsterdam: Elsevier.
Filmer, D. 2000. “The Structure of Social Disparities in Education.” World Bank policy research Working Paper 2268. Washington, DC: World Bank.
Fizbein, A. and N. Shady. 2009. Conditional Cash Transfers: Reducing Present and
Future Poverty. Washington, D.C.: World Bank.
Fryer, R. and S. Levitt. 2004. “Understanding the Black-white Test Score Gap in the First Two Years of School.” The Review of Economics and Statistics 86(2): 447-464. Glewwe, P. and M. Kremer. 2006. “Schools, Teachers, and Education Outcomes in
Developing Countries.” In E.A. Hanushek and F. Welch, eds. Handbook of the
Economics ofEducation. Amsterdam: North Holland, 943-1017.
Glewwe, P., and P. Olinto. 2004. “Evaluating the Impact of Conditional Cash Transfers on Schooling: An Experimental Analysis of Honduras PRAF Program. Final Report for USAID.” International Food Policy Research Institute (IFPRI).
Gould, E., V. Lavy, and D. Paserman. 2004. “Immigrating to Opportunity: The Effect of School Quality Using a Natural Experiment on Ethiopians in Israel.” Quarterly
Guo, J., and W. Zhang. 2008.“The Research on the Economic Development of XX (County name).”Jounral of Shanxi Agricultural University (Social Science Edition) 7(3).
Han, J., C. Cui, and A. Fan. 2009. “Rural Labor-force Allocation Report—an Investigation of 2,749 Villages.” In Cai Fang and Du Yang, eds. The China
Population and Labor Yearbook, Volume1: The Approaching Lewis Turning Point
and Its Policy Implications. Leiden, The Netherlands: Brill, 137–152.
Hanushek, E. A., V. Lavy, and K. Hitomi, 2008. "Do Students Care about School Quality? Determinants of Dropout Behavior in Developing Countries." Journal of
Human Capital. University of Chicago Press 2(1): 69-105.
Koedel, C., & Betts, J. 2009. “Does student sorting invalidate value-added models of teacher effectiveness? An extended analysis of the Rothstein critique.”Working Paper 09-02. Department of Economics, University of Missouri, Columbia, MO. Lai, F., C. Liu, R. Luo, L. Zhang, X. Ma, Y. Bai, B. Sharbono, and S. Rozelle. 2009.
“Private Migrant Schools or Rural/Urban Public Schools: Where Should China Educate Its Migrant Children?” REAP working paper 224. Stanford University. Li, D. 2010. “Nongcun Chuzhong Xuesheng Chuoxue Wenti Zhi Wojian (A Note on the
Dropout Problem among Rural Junior high school Students).” Kexue Jiaoyu
(Science Education) 2 (16): 94-95.
Liu, C., L. Zhang, R. Luo, S. Rozelle, B. Sharbono, and Y. Shi. 2009. “Development
Challenges, Tuition barriers, and High School Education in China.” Asia Pacific
Journal of Education 29(4): 503 – 52.
Liu, C., L. Zhang , R. Luo, S. Rozelle , and P. Loyalka, 2010. “The Effect of Primary School Mergers on Academic Performance of Students in Rural China”.
International Journal of Educational Development 30 (6): 570-585.
Orfield, G., and J. Wald. 2001. “High Stakes Testing.” In Motion Magazine April 2001. Park, A., F. Cai, , and Y. Du, 2007. “Can China Meet Her Employment Challenges?”
Paper presented at the conference on Growing Pains: Tensions and Opportunity in China’s Transformation, Stanford University, November, 2007.
Reardon, S. and C. Galindo. 2002. “Do High-Stakes Tests Affect Students?” Decisions to Drop Out of School? Evidence from NELS.” Paper presented at the Annual Meeting of the American Educational Research Association. New Orleans, LA.
Rivkin, S.G., E.A. Hanushek, , and J.F. Kain. 2005. “Teachers, Schools, and Academic achievement.” Econometrica, 73(2): 417-458.
Rockoff, J. E. 2004. “The Impact of Individual Teachers on Student Achievement: Evidence from Panel Data.” American Economic Review 94: 247-252.
Schady, N., and M. C. Araujo. 2008. “Cash Transfers, Conditions, and School Enrollment in Ecuador.” Economía 8 (2): 43–70.
Schultz, T. P. 2004. “School Subsidies for the Poor: Evaluating the Mexican
PROGRESA Poverty Program.” Journal of Development Economics 74 (1):199– 250.
Sina News. 2010. Alarm! Child Labor in Manufacturing Industries.
http://news.sina.com.cn/c/2010-07-17/142820700245.shtml
Sina News. 2011. No Way to Curb Child Labor? Comments from Gangqiao Wang.
http://news.sina.com.cn/pl/2011-04-01/073322220386.shtml
Tong, L. 2010. “Chuoxue: Nongcun Zhongxuesheng Shuzai Qipaoxian (Left Behind Before Start: Dropping out of Rural Junior high school Students).” Fazhi yu Shehui
(Rule by Law and the Society) 6: 59.
UNDP. 2003. Human Development Report. United Nations Development Programme. New York.
UNESCO. 2002. Education for All: Is the World On Track? UNESCO Publishing: Paris. UNESCO. 2003. UNESCO Institute of Statistics Electronic Database.
http://www.uis.unesco.org/ev.php?URL_ID=5187&URL_DO=DO_TOPIC&URL_ SECTION=201
UNESCO. 2009. Global Report of Adult Education. Hamburg: UNESCO Institute for Lifelong Learning.
Velez, W., and R. Saenz. 2001. “Toward a Comprehensive Model of the School Leaving Process Among Latinos.” School Psychology Quarterly 16: 445-467.
Valenzuela, A. 2000. “The Significance of the TAAS Test for Mexican Immigrant and Mexican American Adolescents: A Case Study.” Hispanic Journal of Behavioral
Sciences22: 524–539.
World Bank. 2003. World Development Indicators 2003. Washington, DC.
World Bank. 2008. 2005 International Comparison Program: Tables of final results.
Zhuo, M. 2006. “Primary School Consolidation in Rural China: Advantages,
Disadvantages and Solutions”. Education Forum, The Education Department of Fujian Province.
Table 1. Comparisons of Student Characteristics, Family Characteristics, Other Characteristics about Schooling and Homeroom Teacher Characteristics between Treatment and Control group 1 and Treatment and Control Group 2, Based on Baseline Survey, 2009. Treatment Group Control Group 1 Control
Group 2 Group comparison
Difference P-value Difference P-value
[1] [2] [3] [1]-[2] [1]-[3]
Poverty indicator
1. Household assets value (1000
yuan)a 1.47 1.45 2.70 0.02 0.89 -1.24 0.00
Student characteristics
2. Pre-test score (units of standard
deviation)b -0.71 -0.72 0.18 0.01 0.95 -0.89 0.00
3. Gender (1=boy) 0.51 0.48 0.54 0.03 0.57 -0.03 0.53
4. Age of student (number of years) 12.87 12.81 12.91 0.06 0.58 -0.05 0.61
Family characteristics
5. Sibling (1=has sibling; 0=only child) 0.99 0.98 0.96 0.01 0.65 0.03 0.07
6. Father's education (1=finished
elementary school; 0=otherwise) 0.9 0.88 0.94 0.02 0.58 -0.04 0.07
7. Mother's education(1=finished
elementary school; 0=otherwise) 0.81 0.84 0.92 -0.03 0.45 -0.12 0.00
Other characteristics about schooling
8. Commuting time between home and
school (number of minutes)c 52.42 56.68 25.94 -4.26 0.56 26.48 0.00
9. Living with family (1=yes;0=living
in the boarding facilities of the school) 0.54 0.51 0.79 0.03 0.65 -0.25 0.00
10. Plan to continue education after
junior high school (1=yes;0=work)d 0.88 0.91 0.96 -0.03 0.46 -0.08 0.00
Homeroom teacher Characteristics
11. Gender (1=male) 0.47 0.4 0.53 0.07 0.25 -0.06 0.17
12. Teaching experience (number of
years) 8.25 7.95 15.84 0.3 0.76 -7.59 0.00
13. Award based on academic performance of students (1=get awarded if students perform outstandingly, 0=otherwise)
0.67 0.73 0.15 -0.06 0.26 0.52 0.00
a This variable is calculated based on household assets which includes electric appliances,
such as color TV sets, water heaters, DVD players, range hoods, microwave ovens, refrigerators and washing machines.
b Pre-test score is the score on the standardized math test that was given to all students in
the sample county (to all grade 7 students in all junior high schools) before treatment.
c Commuting time refers to the length of time students spend on their way from home to
school by their usual transportation means.
d Students who plan to continue education after junior high school include those who
Table 2. Attendance in Junior high school in 2009 and 2010 and Rate of Dropout in Junior high schools in North/Northwest China Sample Junior high schools.
Quantile categories Attendance in 2009 Attendance in 2010 Change in attendance between 2009 and 2010 (column 2 minus column 1) Dropout rate (%) 1.Full sample 1507 1401 -106 7.0
2.Control group 1&2 1357 1259 -98 7.2 3.Pre-test score Lower 1/3 528 462 -66 12.5 (units of standard
deviation) a Middle 1/3 419 393 -26 6.2
Upper 1/3 410 404 -6 1.5
Lower 90% 1211 1117 -94 7.8
4.Rich (based on
assets value) b Highest 10% 148 144 -4 2.7
5.Gender Girl 633 599 -34 5.4
Boy 724 660 -64 8.8
6.Student ages <=12 468 453 -15 3.2
(number of years) 13 529 494 -35 6.6
>=14 360 312 -48 13.3
a Pre-test score is the score on the standardized math test that was given to all students in
the sample county (to all grade 7 students in all junior high schools) before treatment.
b The variable of rich is calculated based on household assets value. It equals 1 if students
Table 3. Probit Regression Analysis Examining the Determinants (correlates) of Dropouts of Grade 7 Sample Junior high school Students in North/Northwest China (Marginal effects in brackets).
Dependent variable: Dropout, 1=yes, 0=no
[1] [2] [3] [4] [5] [6] [7]
-0.39*** -0.39*** -0.38*** -0.38*** -0.37*** -0.22*** -0.24***
1. Pre-test score (unit of standard
deviation) a [-0.04] [-0.04] [-0.03] [-0.03] [-0.03] [-0.01] [-0.01]
-0.41* -0.41* -0.38 -0.36 -0.34 -0.18 -0.11
2. Rich (1=highest 10% in assets value;
0=otherwise) b [-0.03] [-0.03] [-0.03] [-0.02] [-0.02] [-0.01] [-0.01]
3. Gender (1=boy) 0.26** 0.26** 0.25** 0.25** 0.23** 0.25** 0.23*
[0.03] [0.02] [0.02] [0.02] [0.02] [0.02] [0.01]
0.28*** 0.28*** 0.29*** 0.28*** 0.29*** 0.28*** 0.28***
4. Age of student (number of years)
[0.03] [0.03] [0.03] [0.02] [0.03] [0.02] [0.02]
Family characteristics
0.80* 0.78* 0.86** 0.87* 0.81** 0.92**
5. Sibling (1=has sibling; 0=only child)
[0.04] [0.04] [0.04] [0.04] [0.03] [0.03]
-0.26 -0.27 -0.25 -0.31 -0.29 -0.31
6. Father's education (1=finished elementary
school; 0=otherwise) [-0.03] [-0.03] [-0.03] [-0.03] [-0.02] [-0.02]
0.00 0.01 0.05 0.03 0.09 0.16
7. Mother's education(1=finished elementary
school; 0=otherwise) [-0.00] [0.00] [0.00] [0.00] [0.01] [0.01]
Other characteristics about schooling
0.03** 0.01
8. Commuting time between home and
school (number of minutes)c [0.00] [0.00]
-0.52*** -0.71***
9. Living with family (1=yes;0=live in the
boarding facilities of the school) [-0.06] [-0.08]
-0.87*** -0.54***
10. Plan to continue education after
junior high school, (1=yes;0=work)d [-0.15] [-0.04]
Homeroom teacher characteristics
11. Gender (1=male) -0.14 -0.07
[-0.01] [-0.00]
-0.03** -0.03**
12. Teaching experience (number of years) [-0.00] [-0.00]
0.15 0.07
13. Award based on academic performance of students (1=get awarded if students
perform outstandingly, 0=otherwise) [0.01] [0.00]
14. School dummy No No No No No Yes Yes
15. Constant -5.40*** -5.91*** -6.05*** -5.66*** -5.25*** -5.34*** -4.72***
16. Obs. 1357 1357 1357 1357 1357 1357 1357
a Pre-test score is the score on the standardized math test that was given to all students in
the sample county (to all grade 7 students in all junior high schools) before treatment.
b The variable of rich is calculated based on household assets value. It equals 1 if students
are from the highest 10% of households; it equals 0 if students are from the lower 90% of households.
c Commuting time refers to the length of time students spend on their way from home to
school by their usual transportation means.
d Students who plan to continue education after junior high school include those who
expressed their will to attend high school or vocational school after graduation from junior high school; the rest of the students expressed their will to join labor force. Significance level: * significant at 10%; ** significant at 5%; *** significant at 1%. Robust standard errors are in brackets.
Table 4. Dropout Rates of Grade 7 Students in Sample Junior high school Students by Experiment (Treatment/Control) Arm in North/Northwest China.
Dropout rate (%)
Sample (No.) Treatment group Control group 1 P-value
Total
[1] [2] [1]-[2]
1. Total 300 7.0 5.3 13.3 0.02
Groups divided by the following characteristics
2. Pre-test score (units of
standard deviation) a Lower than the median 141 5.1 6.1 15.2 0.02
Higher than the median 159 8.7 2.8 7.9 0.33
3. Household assets value
(1000 yuan) b Lower than the median 157 10.3 7.2 14.9 0.13
Higher than the median 143 8.3 3.0 12.8 0.05
4. Gender Girl 151 5.1 2.7 11.5 0.04
Boy 149 8.7 7.8 15.3 0.15
5. Student ages (number
of years) <13 114 7.9 1.8 13.6 0.02
>=13 186 10.2 7.4 13.2 0.19
a Pre-test score is the score on the standardized math test that was given to all students in
the sample county (to all grade 7 students in all middle schools) before treatment.
b This variable is calculated based on household assets which include the electric
appliances, such as color TV set, water heater, DVD player, range hood, microwave oven, refrigerator and washing machine.
Table 5. Probit Regression of the Impact of the Conditional Cash Transfer Treatment on Dropouts of Grade 7 Sample Junior high school Students in North/Northwest China (Marginal effects in brackets).
Dependent variable: Dropout, 1=yes, 0=no
[1] [2] [3] [4]
1. Treatment (Conditional Cash Transfer—CCT=1) -0.45** -0.49** -0.47** -0.53** [-0.08] [-0.08] [-0.08] [-0.07] 2. Pre-test score (units of standard deviation ) a -0.18* -0.16 -0.16
[-0.03] [-0.03] [-0.02] 3. Household assets value (1000 yuan) b -0.22* -0.22* -0.16
[-0.04] [-0.04] [-0.02]
4. Gender (1=boy) 0.17 0.15 0.14
[0.03] [0.02] [0.02] 5. Age of student (number of years) 0.07 0.1 0.05
[0.01] [0.02] [0.01]
Family characteristics
-1.34** -1.04* 5. Sibling (1=has sibling; 0=only child) [-0.40] [-0.26] -0.21 -0.32 6. Father's education (1=finished elementary school;
0=otherwise) [-0.04] [-0.05]
0.32 0.37 7. Mother's education(1=finished elementary school;
0=otherwise) [0.04] [0.04]
Other characteristics about schooling
0.03** 8. Commuting time between home and school (number of
minutes)c [0.00]
-0.02 9. Living with family (1=yes;0=living in the boarding
facilities of the school) [-0.00]
-0.64** 10. Plan to continue education after junior high school,
(1=yes;0=work)d [-0.12]
Homeroom teacher Characteristics
11. Gender (1=male) -0.44*
[-0.06] -0.03** 12. Teaching experience (number of years)
[-0.00] -0.56*** 13. Award based on academic performance of students
(1=get awarded if students perform outstandingly,
14. Constant -1.05*** -1.84 -0.97 0.47
15. Obs. 300 300 300 300
16. Pseudo R-sq 0.025 0.059 0.095 0.172
a Pre-test score is the score on the standardized math test that was given to all students in
the sample county (to all grade 7 students in all middle schools) before treatment.
b This variable is calculated based on household assets which include the electric
appliances, such as color TV set, water heater, DVD player, range hood, microwave oven, refrigerator and washing machine.
c Commuting time refers to the length of time students spend on their way from home to
school by their usual transportation means.
d Students who plan to continue education after junior high school include those who
expressed their will to attend high school or vocational school after graduation from junior high school; the rest of the students expressed their will to join labor force. Significance level: * significant at 10%; ** significant at 5%; *** significant at 1%. Robust standard errors are in brackets.
Table 6. Heterogeneous Effects of the Conditional Cash Transfer Treatment on Dropouts of Grade 7 Sample Junior high school Students in North/Northwest China (Probit
estimation with marginal effects in brackets).
Dependent variable:
Dropout, 1=yes, 0=no Pre-test score a Household assets value b Gender Student ages
Lower than
the median Higher than the median Lower than the median Higher than the median Girl Boy <13 >=13
[1] [2] [3] [4] [5] [6] [7] [8] 1. Treatment (Conditional Cash Transfer—CCT=1) -0.70** -0.18 -0.60** -0.82** -1.17** -0.38 -1.49*** -0.29 [-0.11] [-0.02] [-0.08] [-0.07] [-0.06] [-0.07] [-0.11] [-0.04]
2. Control variables c Yes Yes Yes Yes Yes Yes Yes Yes
3. Obs. 114 157 157 142 133 149 105 186
4. Pseudo R-sq 0.185 0.153 0.170 0.205 0.306 0.113 0.279 0.144
a Pre-test score is the score on the standardized math test that was given to all students in
the sample county (to all grade 7 students in all middle schools) before treatment.
b Household assets value (in 1000 yuan) is calculated based on household assets which
include the electric appliances, such as color TV set, water heater, DVD player, range hood, microwave oven, refrigerator and washing machine.
c Control variables include all the variables presented in Table 1.
Wald-test does not reject that there is no difference between the coefficients of treatment among subgroups of different household assets value (p-value=0.64)
Significance level: * significant at 10%; ** significant at 5%; *** significant at 1%. Robust standard errors are in brackets.