Genetic similarity among strawberry cultivars assessed by RAPD
and ISSR markers
Rafael Gustavo Ferreira Morales
1,
Juliano Tadeu Vilela Resende
2, Marcos Ventura Faria
2, Marcela
Carvalho Andrade
3, Luciane Vilela Resende
4, Carla Andrea Delatorre
5, Paulo Roberto da Silva
6*
1UNICENTRO – Programa de Pós-Graduação em Agronomia.2
UNICENTRO – Depto. de Agronomia, C.P. 3010 – 85040-080 – Guarapuava, PR – Brasil.
3
UFLA – Programa de Pós-Graduação em Agronomia/Fitotecnia.
4UFLA – Depto. de Agricultura – Lab. de Eletroforese, C.P. 3037 – 37200-000 – Lavras, MG – Brasil.
5UFRGS/Faculdade de Agronomia – Depto. Plantas de Lavoura, C.P. 15 100 – 91501-970 – Porto Alegre, RS – Brasil. 6UNICENTRO – Depto. de Ciências Biológicas, C.P. 3010 – 85040-080 – Guarapuava, PR – Brasil.
*Corresponding author <prsilva@unicentro.br> Edited by: Leonardo Oliveira Medici
ABSTRACT:Most strawberry (Fragaria × ananassa Duchesne) cultivars used in Brazil are developed in other countries, it became clear the need to start the strawberry breeding program in the country. To start a breeding program is necessary the genetic characterization of the germplasm available. Molecular markers are important tools that can be used for this purpose.The objectives of the present study were to assess the genetic similarity among 11 strawberry cultivars using RAPD and ISSR molecular markers and to indicate the possible promising crosses. The DNA of the eleven strawberry cultivars was extracted and amplified by PCR with RAPD and ISSR primers. The DNA fragments were separated in agarose gel for the RAPD markers and in polyacrylamide gel for the ISSR markers. The genetic similarity matrix was estimated by the Jaccard coefficient. Based on this matrix, the cultivars were grouped using the UPGMA method. The dendogram generated by the RAPD markers distributed the cultivars in three groups while the ISSR markers generated two groups. There was no direct relationship between the marker groups when the two types of markers were compared. The grouping proposed by the ISSR markers was more coherent with the origin and the genealogy of the cultivars than that proposed by the RAPD markers, and it can be considered the most efficient method for the study of genetic divergence in strawberry. The most promising crosses, based on the genetic divergence estimated from the RAPD and ISSR molecular data were between the Tudla and Ventana and the Oso Grande and Ventana cultivars, respectively.
Keywords:Fragaria × ananassa, plant breeding, genetic divergence, molecular markers
Introduction
Strawberry (Fragaria × ananassa Duchesne) is greatly ap-preciated all over the world. The largest producers and con-sumers are first world countries such as the United States of America, Spain, Italy and Japan. In these countries there are breeding programs focused on yield and shelf-life increase, and pest and disease resistance (Camargo and Passos, 1993). In tropical countries, such as Brazil, the cultivars used have been, on the whole, imported from temperate countries, which have a different climate. Thus it has become necessary to develop new cultivars adapted to the climatic conditions of these tropical countries. To start a breeding program it is essential to characterize the available germplasm, either mor-phologically or molecularly. The germplasm characterization by DNA based molecular markers allows a better understand-ing of genetic variability. This is due to the determination of the level of genetic divergence and the molecular pattern of each cultivar. With these data the breeder can plan crosses using molecular and field data which can result in the devel-opment of superior cultivars more quickly and economically (Lörz and Wenzel, 2005).
Several techniques based on DNA analysis are avail-able for genetic divergence studies. In strawberry, Random Amplification of Polymorphic DNA (RAPD) and Inter
Simple Sequence Repeat (ISSR) markers are efficient for genetic divergence studies (Gidoni et al., 1994; Parent and Page, 1995; Graham et al., 1996; Conti et al., 2002a; 2002b; Zebrowska and Tyrka, 2003; Arnau et al., 2003; Kuras et al., 2004; Hussein et al., 2008). Kuras et al. (2004) studied the genetic relationship among 24 strawberry cultivars using RAPD and ISSR markers and obtained similar results for both the techniques.
The decision of which method to use depends on the available resources and the degree of reliability of the method. Thus the objectives of this study were to assess the genetic similarity of 11 strawberry cultivars using RAPD and ISSR markers and to infer, from the genetic divergence, the most promising crosses.
Materials and Methods
The following cultivars were used in the present study: Aro-mas, Camarosa, Camino Real, Campinas, Diamante, Dover, Oso Grande, Sweet Charlie, Toyonoka, Tudla and Ventana. These cultivars were cultivated in a controlled environment to obtain plant material for DNA extraction. DNA was extracted from young leaves collected separately from each cultivar and kept in liquid nitrogen until extraction. For both techniques, RAPD and ISSR, the DNA was extracted following the modified CTAB
protocol proposed by Mercado et al. (1999). After extraction, the DNA was quantified in a spectrophotometer and stored at -20 ºC until use.
For the RAPD marker technique, the DNA of each cul-tivar was amplified by PCR (Polymerase Chain Reaction) us-ing 40 RAPD primers. For the PCR a solution was prepared containing PCR buffer (1x), MgCl2 (2.5 mM), dNTPmix (0.2 mM), primer (25 ng), Taq DNA polymerase (1 U) and DNA (20 ng). The amplification program started with pre-denaturation at 95 ºC for 2 min, followed by 45 cycles at 94 ºC for 1 min, 42 ºC for 1 min and 72 ºC for 2 min. After amplification the reaction was incubated for 10 min at 72 ºC for the final extension of the fragments. The amplified fragments were separated in 1.5 % agarose gel in a 100 mA electric current. The gel was stained in a SYBR Green solu-tion (1.5 L water for 50 μL SYBR Green) and visualized with ultraviolet light. The size of amplified DNA fragments was estimated by comparison with molecular weight marker 100 pb DNA Ladder.
For the ISSR markers technique, the DNA from each cultivar was amplified with 16 ISSR primers in the following reaction: 40 ng of genomic DNA, 2.5 μL of 1x PCR buffer, 1.5 mM of MgCl2, 200 μM of each dNTP, 10 μmol of primer, 1
U Taq polymerase and water to complete the volume to 25 μL. The thermocycler program for PCR consisted of a first step of 15 min at 95 oC to denature the DNA followed by 35 cycles at
94 ºC for 30 s, 50 ºC for 45 s and 72 ºC for 2 min. At the end of the 35 cycles a step at 72 ºC for 7 min was performed for the final extension of the amplified fragments. After amplifica-tion, the fragments were separated in 6 % polyacrylamide gel in a constant 2000 V current for 3 h and visualized by staining with silver nitrate. The size of amplified DNA fragments was estimated by comparison with molecular weight marker 123 pb DNA Ladder.
A binary matrix was generated from the gel readings for each technique used (RAPD markers and ISSR markers) where the individuals were genotyped for presence (1) or absence (0) of the locus in question. The genetic similarity was calculated from this matrix by the Jaccard coefficient (Sneath and Sokal, 1973), using the NTSYSpc 2.1 Software (Rohlf, 2000). The dendrogram was formed using unweighted pair-group mean analysis (UPGMA).
Results and Discussion
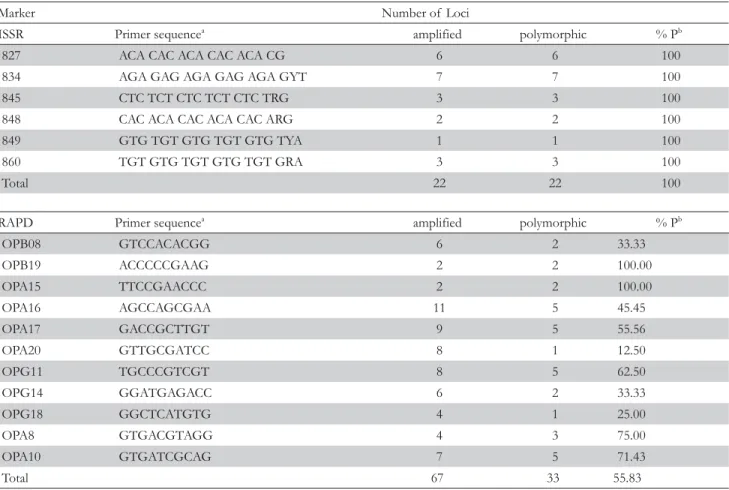
Only 11 of the 40 RAPD markers primers assessed were polymorphic (Table 1). The others did not amplify or pre-sented low amplification quality and were not considered in the final data analysis. These 11 primers amplified 67 loci, of which 33 were polymorphic (55.83 % polymorphism), rang-ing in size from 500 to 2000 pb. Four primers (A10, A16, A17 and G11) amplified five loci and two primers (A20 and G18)
Table 1 – Primer sequence and number of loci amplified and polymorphic in 11 strawberry cultivars.
Marker Number of Loci
ISSR Primer sequencea amplified polymorphic % Pb
827 ACA CAC ACA CAC ACA CG 6 6 100
834 AGA GAG AGA GAG AGA GYT 7 7 100
845 CTC TCT CTC TCT CTC TRG 3 3 100
848 CAC ACA CAC ACA CAC ARG 2 2 100
849 GTG TGT GTG TGT GTG TYA 1 1 100
860 TGT GTG TGT GTG TGT GRA 3 3 100
Total 22 22 100
RAPD Primer sequencea amplified polymorphic % Pb
OPB08 GTCCACACGG 6 2 33.33 OPB19 ACCCCCGAAG 2 2 100.00 OPA15 TTCCGAACCC 2 2 100.00 OPA16 AGCCAGCGAA 11 5 45.45 OPA17 GACCGCTTGT 9 5 55.56 OPA20 GTTGCGATCC 8 1 12.50 OPG11 TGCCCGTCGT 8 5 62.50 OPG14 GGATGAGACC 6 2 33.33 OPG18 GGCTCATGTG 4 1 25.00 OPA8 GTGACGTAGG 4 3 75.00 OPA10 GTGATCGCAG 7 5 71.43 Total 67 33 55.83
amplified only a single locus (Table 1). The B5 RAPD primer, considered one of the best primers in the study by Radmaan et al. (2006), amplifying up to 14 polymorphic loci, presented very low polymorphism in the cultivars under study and was not selected in the present study. The B8 and B19 primers each amplified two polymorphic loci, a result that contrasted with the six and ten polymorphic loci, respectively, observed by Conti et al. (2002a). The number of fragments amplified in the present study was considered low. Factors such as genome size and composition, genomic DNA extraction methods and the reaction conditions interfered in the number of loci am-plified by RAPD marker primers (Williams et al., 1990). The size of the fragments obtained (between 500 and 2000 pb) are in accordance with those reported in the literature for RAPD primers (Williams et al., 1990).
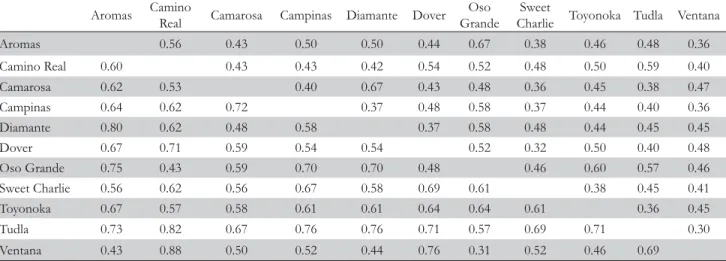
The mean similarity calculated was 46 %, ranging from 30 % (between Ventana and Tudla) to 67 % (between Camarosa and Diamante and Oso Grande and Aromas) (Table 2). These values were similar to those observed by Zebrowska and Tyrka (2003), who reported 53 % mean similarity, with values ranging from 32 to 77 %. These authors concluded that the RAPD markers were efficient to study genetic diversity in strawberry. Considering the mean similarity of each cultivar compared to the other ten cultivars, the Sweet Charlie cultivar presented the lowest mean similarity (40 %) and the Oso Grande cultivar the greatest (54 %). Thus the Sweet Charlie cultivar may be of interest for use in crosses because of its genetic divergence compared to the other cultivars evaluated.
Three groups were formed based on the genetic similar-ity, considering a cutting point of 46 % genetic similarity equivalent to the mean genetic similarity of all the cultivars (Figure 1). Group 1 was formed by seven cultivars (Aromas, Oso Grande, Campinas, Toyonoka, Dover, Camino Real and Tudla), group II was formed by three cultivars (Camarosa, Diamante and Ventana), and group III was formed by a single cultivar (Sweet Charlie), that one presented the greatest ge-netic distance compared to all the other cultivars. Radmann et al. (2006) studied strawberry genetic similarity using RAPD markers and obtained the formation of one group (Dover,
Campinas, Tudla, Aromas, Camarosa, Oso Grande and Sweet Charlie), similar to that obtained in the present study. This fact shows that in spite of the low experimental repeatability, the RAPD markers were efficient to study strawberry genetic divergence, corroborating the studies from Conti et al. (2002a) and Radmann et al. (2006).
The low genetic similarity in strawberry cultivars observed by Radmann et al. (2006) was attributed to the genealogy of the cultivars, because most of them not have a common parent. These authors emphasized in their study that the possibility of forming groups could be linked to the sharing of genetic material from one distant common ancestor; it would explain the genetic similarity. In this sense, the presence of common ancestors might have influenced the similarity among the cul-tivars in the present study. For example, the culcul-tivars Dover, Camarosa, Tudla and Oso Grande have as common ancestors the cultivars Sequoia and Tioga (Camargo and Passos, 1993; Faedi et al., 2009), and these cultivars were placed in group I (Figure 1), except for the Camarosa cultivar, placed in group II (Figure 1). The Tudla and Oso Grande cultivars have also the common parent Parker (Faedi et al., 2009), that did not guaran-tee high genetic similarity (57 %) but may have influenced the
Figure 1 – Dendrogram of genetic similarity among eleven straw-berry cultivars, obtained from RAPD markers using the UPGMA method. The dotted line indicates the cutting point based on the calculated mean similarity.
Table 2 – Matrix of genetic similarity among 11 strawberry cultivars based on RAPD markers (above diagonal) and ISSR markers (below diagonal) calculated by Jaccard's coefficient.
Aromas Camino Real Camarosa Campinas Diamante Dover GrandeOso CharlieSweet Toyonoka Tudla Ventana
Aromas 0.56 0.43 0.50 0.50 0.44 0.67 0.38 0.46 0.48 0.36 Camino Real 0.60 0.43 0.43 0.42 0.54 0.52 0.48 0.50 0.59 0.40 Camarosa 0.62 0.53 0.40 0.67 0.43 0.48 0.36 0.45 0.38 0.47 Campinas 0.64 0.62 0.72 0.37 0.48 0.58 0.37 0.44 0.40 0.36 Diamante 0.80 0.62 0.48 0.58 0.37 0.58 0.48 0.44 0.45 0.45 Dover 0.67 0.71 0.59 0.54 0.54 0.52 0.32 0.50 0.40 0.48 Oso Grande 0.75 0.43 0.59 0.70 0.70 0.48 0.46 0.60 0.57 0.46 Sweet Charlie 0.56 0.62 0.56 0.67 0.58 0.69 0.61 0.38 0.45 0.41 Toyonoka 0.67 0.57 0.58 0.61 0.61 0.64 0.64 0.61 0.36 0.45 Tudla 0.73 0.82 0.67 0.76 0.76 0.71 0.57 0.69 0.71 0.30 Ventana 0.43 0.88 0.50 0.52 0.44 0.76 0.31 0.52 0.46 0.69
fact that both were placed in the same group (Figure 1). The three cultivars in group II being placed together was coherent with their origin, because they came from the USA, as result of crossing among cultivars of the University of California, but it was not possible to identify the degree of kinship between them, because was found only the first-degree parent to the cultivars Diamante ('Cal. 87112-6 × Cal. 88270-1') and Ventana ('Cal.93.70 -606 × Cal.92.35-601').
The high genetic divergence found may have been because the strawberry, according to Camargo and Passos (1993), has a highly heterozygote genetic structure, due to the high ploidy level and the hybrid origin. The garden strawberry (Fragaria × ananassa) is octaploid and came from two octaploid spe-cies that were autopolyploid. The polymorphism found was in agreement with the results obtained for other strawberry cultivars by Conti et al. (2002a). However, these authors reported that the mean similarity of the cultivars was 62 %, greater than that observed in the present study (46 %), a fact explained since the cultivars used by these authors had a com-mon origin.
Six of the 16 ISSR marker primers assessed presented good amplification and were selected for analyses of straw-berry cultivars. These six primers amplified 22 polymorphic loci, of estimated sizes from 200 to 2700 pb, varying from seven polymorphic loci for primer 834 to one locus for the primer 849 (Table 1).
The mean similarity assessed by the ISSR markers was 62 %, ranging from 30 % (Ventana and Oso Grande) to 88 % (Camino Real and Ventana) (Table 2). These values showed high polymorphism and were consistent with results obtained for other strawberry cultivars (Graham et al., 1996; Arnau et al., 2003; Kuras et al., 2004). The Aromas and Diamante cultivars presented one of the greatest similarity values (80 %) probably due to the common parents (‘Cal. 87.112-6’ × ‘Cal. 88.270-1’) (Shaw 1998a; 1998b). Conversely, Tudla cultivar presented less similarity with Oso Grande cultivar, its half-sib, than with all the other cultivars evaluated, showing that the similarity between sibs is greatly affected by the parents’ level of similarity. However, a high degree of similarity was ob-served between the Camino Real and Ventana cultivars (88 %), even though they do not have common parents, but they came from the same breeding program and may share ancestors. Moreover, the selection for important agronomic traits reduces the diversity in crops. The coefficients of similarity among some cultivars in the present study were generally similar with those reported in the literature (Arnau et al., 2003; Kuras et al., 2004; Radmann et al., 2006), indicating great reliability of the molecular data.
The mean similarity calculation allowed the division of the cultivars into two groups (Figure 2). Group I was formed by the cultivars Dover, Ventana and Camino Real, and Group II was formed by the other cultivars (Figure 2). The three cultivars in group I came from the USA but from different breeding programs: the Camino Real and Ventana cultivars were developed at the University of California while the Dover cultivar was developed at the University of Florida. Although they came from different breeding programs, the exchange of genetic resources may have influenced the grouping of these
cultivars (Darrow, 1966). Group II was not coherent with the country of origin; it contained cultivars from the United States, Spain, Japan and Brazil. The Aromas and Diamante cultivars, classified by light requirement as neutral days, were grouped together with the short day cultivars (Group II); suggesting that the clustering of cultivars was independent of their agronomic features. These two cultivars share several genes in common coming from the wild F. virginiana species, the main source of insensitivity to light requirement (Hancock et al., 2002).
The ISSR markers are obtained with primers that amplify inter-SSR regions (short tandem repeats of 1–4 bases of DNA) of the genome and allow the observation of variations in these regions. These primers are techni-cally as easier as RAPD markers to develop (Kuras et al., 2004). Genetic divergence studies in strawberry using ISSR markers are restricted to few works. Hussein et al. (2008) studied the genetic diversity of six strawberry cul-tivars by ISSR markers and observed that the technique was adequate to distinguish all the strawberry cultivars studied. These authors conclude that the ISSR has great potential in the study of genetic divergence to be highly discriminating, reliable and combine simplicity and speed. Korbin et al. (2002) and Kuras et al. (2004) comparing the ISSR technique with other molecular techniques have also reached the same conclusion.
The genetic divergence results based on the RAPD and ISSR markers differed in some points. The highest mean simi-larity obtained with ISSR markers (62 %) is superior than the one obtained by RAPD markers (46 %). Kuras et al. (2004) studied the genetic relationship among 14 strawberry cultivars and mean similarity values obtained with ISSR markers were also higher than those obtained with RAPD markers. These authors used 23 RAPD primers and 11 ISSR primers, many more than used in the present study, that thus indicated that even when a smaller number of primers was used they were efficient for the genetic study in strawberry.
Comparison of the similarity values between the two methods showed important differences among the genetically close cultivars. With the RAPD markers, the Camarosa and Diamante cultivars presented one of the greatest similarity values (67 %) but with the ISSR markers the two cultivars Figure 2 – Dendrogram of genetic similarity among eleven
straw-berry cultivars, obtained from ISSR markers using the UPGMA method. The dotted line indicates the cutting point based on the calculated mean similarity.
presented one of the smallest similarity values (48 %) show-ing a certain incongruence between the techniques. A similar fact can be observed between the Camino Real and Ventana cultivars, where 88 % similarity was observed with the ISSR markers but only 40 % with the RAPD markers. These differ-ences are mainly due to the presence of false positives RAPD bands that may have been analyzed.
Fifty-five possible interactions were observed based on the coefficients of similarity between the 11 strawberry cultivars (Table 2). Eleven interactions from RAPD markers showed similarity values up to 10 percentage points (pp) lower than those obtained with ISSR markers; 19 presented values between 10 and 20 pp lower, other 19 presented values lower than 20 pp, only in five cases the similarity values in RAPD markers were superior to those obtained by ISSR markers and only one case [between Tudla and Oso Grande cultivars (57%)] the values were identical (Table 1). The lower similarities obtained by the RAPD compared to ISSR markers were also observed by Korbin et al. (2002), who reached the conclusion that six times more RAPD marker primers were necessary to reach values similar to those obtained by the ISSR markers. This fact was related to the low repeatability of the RAPD markers caused by its elevated sensitivity to experimental conditions (Jones et al., 1997), which can be considered the main limiting factor of the technique.
When the groupings were analyzed by the ISSR markers technique, Group I, consisting of the Dover, Ventana and Camino Real cultivars, grouped coherently with origin. However, using the RAPD marker technique, the same cultivars were not placed in the same group. The Sweet Charlie cultivar did not group with any cultivar with the RAPD markers but with the ISSR markers it grouped with other seven cultivars forming the group I.
The study of genetic divergence by the similarity coefficients or dendograms helps to identify parents suitable for obtaining hybrids with greater heterotic effect and with greater segregation during the recombination, so that superior individuals can be se-lected (Cruz and Carneiro, 2003). In this sense, only considering the RAPD markers, it could be inferred that crosses involving the Sweet Charlie cultivar were the most interesting, due to the low similarity (41 %) to all the other cultivars (Table 1, Figure 2). It was inferred that the most promising cross would be Tudla and Ventana, due to the 70 % dissimilarity. Considering the means among the two methods, the Ventana cultivar presented the greatest dissimilarity (48 %) and the cross that might give the greatest heterotic effect would be between Ventana and Oso Grande.
Based on the similarity matrixes and the dendograms of the two molecular markers under study, the ISSR markers were more efficient than the RAPD markers to study strawberry genetic similarity, although the RAPD markers were coherent in grouping the cultivars, and up to a certain point, with the genealogy and country of origin, and can be used to study genetic similarity. The similarity values obtained in the analyses reinforced that there was genetic divergence among the cultivars, especially due to the use of genotypes derived from different breeding programs.
Acknowledgements
To the Fundação Araucária de Apoio ao Desenvolvimento Científico e Tecnológico do Paraná for providing the funds for this study.
References
Arnau, G.; Lallemand, J.; Bourgoin, M. 2003. Fast and reliable strawberry cultivar identification using inter simple sequence repeat ISSR amplification. Euphytica 129: 69-79.
Camargo, L.S.; Passos, F.A. 1993. Morango. p. 411-432. In: Furlani, A.M.C.; Viégas, G.P., eds. Plant breeding in the Campinas Agronomic Institute. Instituto Agronômico, Campinas, SP, Brazil.
Conti, J.H.; Minami, K.; Gomes, L.H.; Tavares, F.C.A. 2002a. Estimate of the genetic similarity and identification of strawberry cultivars by RAPD analysis. Horticultura Brasileira 20: 145-152 (in Portuguese, with abstract in English).
Conti, J.H.; Minami, K.; Tavares, F.C.A. 2002b. Comparison of morphological and agricultural characters with molecular ones in Brazilian strawberries. Horticultura Brasileira 20: 419-423 (in Portuguese, with abstract in English).
Cruz, C.D.; Carneiro, P.C.S. 2003. Biometric models applied to genetic improvement. Editora UFV, Viçosa, MG, Brazil.
Darrow, G.M. 1966. The Strawberry: History Breeding and Phisiology. Holt Rinehart and Wiston, New York, NY, USA.
Faedi, W., Baruzzi, G.; Lovallo, F.; Sbrighi, P., Lucchi, P. 2009. Monograph of Cultivars of Strawberry. Experimental Institute for Fruit Culture, Rome, Italy (in Italian).
Gidoni, D.; Rom, M.; Kunik, T.; Zur, M.; Izsak, E.; Izhar, S.; Firon, N. 1994. Strawberry cultivar identifi cation using randomly amplifi ed polymorphic DNA (RAPD) markers. Plant Breeding 113: 339-342.
Graham, J.; Mcnicol, R.J.; Mcnicol, J.W. 1996. A comparision of methods for the estimation of genetic diversity in strawberry cultivars. Theoretical and Applied Genetics93: 402-406.
Hancock, J. F.; Luby, J. J.; Dale, A.; Callow, P. W.; Serçe, S.; El-Shiek, A. 2002. Utilizing wild Fragaria virginiana in strawberry cultivar development: Inheritance of photoperiod sensitivity, fruit size, gender, female fertility and disease resistance. Euphytica 126: 177-184.
Hussein, T.S.; Tawfik, A.A.; Khalifa, M.A. 2008. Molecular identification and genetic relationships of six strawberry varieties using ISSR markers. International Journal of Agriculture and Biology 10: 677-80.
Jones, C.J.; Edwards, K.J. S. Castaglione, S.; Winfield, M.O.; Sala, F.; Van deWiel, C.; Bredemeijer, G.; Vosman, B.; Matthes, M.; Daly, A.; Brettschneider, R.; Bettini, P.; Buiatti, M.; Maestri, E.; Malcevschi, A.; Marmiroli, N.; Aert, R.; Volckaert, G.; Rueda, J.; Linacero, R.; Vazquez, A.; Karp1, A. 1997. Reproducibility testing of RAPD, AFLP, and SSR markers in plants by a network of European laboratories. Molecular Breeding 3: 381-390.
Korbin, M.; Kuras, A.; Zurawicz, E. 2002. Fruit plant germplasm characterization using molecular markers in RAPD and ISSR-PCR. Cellular and Molecular Biology Letters 7: 785-794.
Kuras, A.; Korbin, M.; Zurawicz, E. 2004. Comparison of suitability of RAPD and ISSR techniques for determination of strawberry (Fragaria × ananassa Duch) relationship. Plant Cell, Tissue and Organ Culture 79: 189-193.
Lörz, H.; Wenzel, G. 2005. Molecular Marker Systems in Plant Breeding and Crop Improvement. Springer, New York, NY, USA.
Mercado, J.A.; El Mansouri, I.; Jimenez-bermudez, S.; Pliego-alfaro, F.; Quesada, M.A. 1999. A convenient protocol for extraction and purification of DNA from Fragaria. In Vitro Cellular & Developmental Biology 35: 152-153.
Parent, J.G.; Pagé, D. 1995. Authentification of the 13 strawberry cultivars of Quebec's certification program by random polymorphic DNA analysis (RAPD). Canadian Journal of Plant Science 75: 221-224.
Radmann, E.B.; Bianchi, V.J.; Oliveira, R.P.; Fachinello, J.C. 2006. Characterization and genetic diversity of strawberry cultivars. Horticultura Brasileira 26: 84-87 (in Portuguese, with abstract in English).
Rohlf, F.J. 2000. NTSYS-PC Numerical Taxonomy and Multivariate Analysis System: Manual Applied of Biostatistics. Exeter Software,
Setauket, NY, USA.
Shaw, D.V. 1998a. Strawberry plant named ‘Aromas’. USA, The Regents of the University of California, Plant Patent 10451.
Shaw, D.V. 1998b. Strawberry plant ‘Diamante’. USA, The Regents of the University of California, Plant Patent 10435.
Sneath, P.H.; Sokal, R.R. 1973. Numerical Taxonomy: The Principles and Practice of Numerical Classifi cation. Freeman, San Francisco, CA, USA.
Received November 04, 2010 Accepted March 31, 2011
Williams, J.G.K.; Kubelik, A.R.; Livar, K.J.; Rafalski, J.A.; Tingey, S.V. 1990. DNA polymorphisms amplifi ed by arbitrary primers are useful as genetic markers. Nucleic Acids Research 18: 6531-6535. Zebrowska, J.I.; Tyrka, M. 2003. The use of RAPD markers for
strawberry identifi cation and genetic diversity studies. Journal of Food Agriculture and Environment 1: 115-117.