DMZ - IV.4 : 1.-M.A.W. Morel, H. Kamermans & A. Visser
Summary
Spatial Analysis of Bone Refuse
in a Roman Harbour
Velsen I is a two-period military base connected to harbour installations. Excavations were carried out between 1973 and 1982 (Morel, in press) and further work will be done from 1985 onwards. The site, dated to about 15-30 AD, lies approximately 15 km to the west of Amsterdam.
The harbour installations consist of several phases including various combina-tions and placements of jetties and piers. Dredging had also taken place whereby rubbish and natural layers were redeposited to deeper harbour areas. Rubbish built up on this dredge layer as well as on the scraped harbour bottom.
For analyzing disposal pattern, and for helping to determine the phasing of pier /jetty use, the materials were collected from the harbour layers by 1 m2•
One of the best materials for giving an idea about how garbage was thrown away is food refuse, i.e. in the form of bone.
The bone material has been counted and weighed in 8 categories for each square meter: large domestics, small domestics, industrial waste products, wild animals, birds, fish, human bone and « undetermined ». For storing and selecting data, SIR2 was used (H. Kamermans). Maps were produced usihg SURFACE II (A. Visser). Data used for producing the distribution maps were the weights of small and large domestics, counted together and treated as altitude points, thus giving a contour map of grams per square.
It is apparent that the post-dredge layer has two main clusters : one near the end of the western mole and a second near the end of the western jetty. The first certainly reflects the throwing of garbage as far away as possible in the deepest part of the harbour prior to the construction of te jetties. The second cluster shows that once the jetty was added to the western mole, the garbage was thrown away from here.
Remarkable is the absence of a cluster in the vicinity of the end of the northern jetty, probably reflecting a wish to keep the shallower entrances to the harbour area free of excess debris.
1. Introduction
Between 1973 and 1982 the site of Velsen 1 has been the subject of annual excavation campaigns, carried out by the Albert Egges van Giffen Instituut voor Prae- en Protohistorie (IPP) in close cooperation with the AWN (Netherlands Association of Amateur Archaeologists). The settlement, which has now been almost totally uncovered, consists of a two-phase fort (the temporary construction camps which preceded each of these phases are ignored in the following discussion) with associated harbour works. In the Roman period this fort must have lain on what was probably a side branch of the so-called
« Oerij » (the primeval form of the present River 11), which at that time may have formed the most nothernly branch of the Rhine delta (see fig. 1, top left).
ORGINAL SHORElINE (PRESUMED)
VELSEN 1
/ /
/
/ / /
/
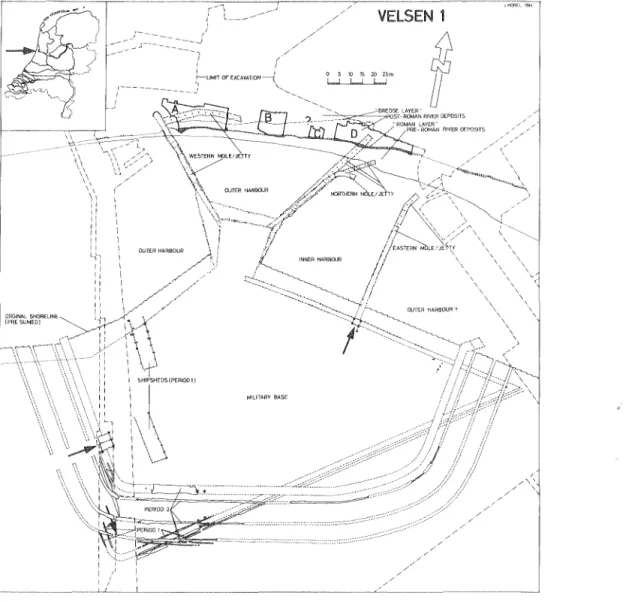
Fig. 1. Velsen 1, situation and features, period 1 and 2.
/
/
Bone refuse in a Roman harbour 199
In period 1 the fort was more or less triangular in plan (see Fig. 1),
with landward defences formed by two box-ramparts set at right angles, and an entrance in the corner. Another box rampart was constructed along the river bank, with a gateway giving access to the eastern harbour mole. The first harbour works were laid out in this period. They consisted of a platform projecting into the river from which two massive moles (the Western and the Northern Mole) extended to form an inner harbour, with a separate mole (the Eastern Mole) leading from the gateway in the riverside defences. The prevailing we sternly winds and the accumulation of river deposits associated with them made certain modifications to the harbour installations necessary already during the first period. The sides of the platform were extended outwards and the western and northern moles were both fitted out with additional reinforcements.
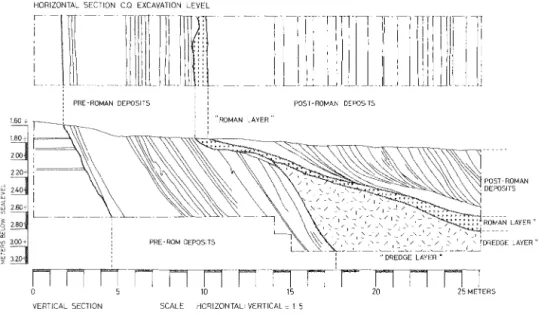
In period 2 the lay-out of the fort was completely overhauled and the plan became more or less trapezoidal. The defences now consisted of an earthern rampart with triple ditches in front. No new defences were, apparently, constructed along the river bank, but the harbour works were modified. An open jetty was added at right angles to the head of the western mole; the northern mole was completely demolished and was replaced by an open jetty which projected even further into open water. In line with this, a jetty was also added to the eastern mole (Morel, in press). The site has been subjected to heavy riverine abrasion subsequent to the Roman occupation and this has left only the deepest features untouched. To the east, it has even removed all trace of the defensive ditches, while in the harbour the river deposits have been truncated by upto 2 m, resulting on the disappearance of the entire Roman forshore and shallows. Consequently, the first river deposits to be revealed in the present excavated area now lie considerably further out into the river than they did in the Roman period. Only the head of the western mole, the entire length of the later jetty and the head of the northern jetty still project into extent river deposits in the harbour. In horizontal section (Le. excavation level), the river deposits are formed of pre-Roman, Roman and post-Roman deposits (Fig. 2, top). The vertical section (Fig. 2 bottom) shows that the Roman level is less steeply inclined than either the pre-Roman or post-Roman deposits. This is because the harbour wad dredged out, probably already in period 1, and certainly before the addition of the open jetties to the moles. In this process, material dredged up from the shallowest part of the harbour was dragged into the deepest part of the navigation channel. This deposit, here called the
difference between the two is that the Dredge layer consists of material redeposited by the Romans themselves, which has been preserved entire on account of the depth at which it was deposited - while the Roman layer is composed of rubbish lying where it was thrown. Much of the Roman layer, however, has been destroyed by the processes of erosion. In the horizontal section, only the Roman layer is visible, not the Dredge layer lying below, though it's extent is indicated on Fig. 1.
That the river originally ran much closer to the fort is already apparent from the wharfs lining the platform. The first, innermost wharfs (Fig. 1) are constructed of alder posts, a single row forming the eastern and the western ones, and a double row lining the nothern one. The extended wharfs of the second phase are all of single post rows, but although the western and eastern wharfs again use alder, the northern wharf was constructed of oak. Thus in both phases the northern wharf of the platform was extra strong in its construction which suggests that it was a mooring dock : consequently the harbour basin must have been navigable up to the platform.
2. The excavation of the harbour basin
In 1982 areas of the deposits preserved in the harbour basin were excavated (figs. 1, 3 & 4, Trenches A, B, C, D). Sections were drawn at regular intervals and the depth and thickness of both the Roman and the Dredge layer were measured at all intersections of the one metre squares in which the trenches were excavated. These measurements give an indication of the course of the - undredged - deepest part of the river bed (the bottom of the Dredge layer) and of the navigation channel after dredging (the bottom of the Roman layer). It was also apparent that slightly deeper dredging channels ran roughly parallel to the modes and that a navigation channel had been deepened out to the head of the northern mole.
The finds were collected in one metre squares, and were allocated their square number, the date and the level identification (i.e. Roman or Dredge layer). The grid reference for the square is alphabetical (A-C, AA-AZ etc.) from east to west, and numerical from south to north.
Bone refuse in a Roman harbour
HORIZONTAL SECTION C Q EXCAVATION LEVEL
i-
r--1-llm~1
wi:
: III . III II I
it
111\'[
PRE~ROMAN DEPOSITS
"ROMAN LAYER"
II~
nT-I\r.
IJlllJJI
pOST-ROMAN DEPOSITS
VERTICAL SECTION SCALE HORIZONTAL VERTICAL = 15
J MOREL 1984
Fig. 2. Velsen 2, horizontal and vertical section of the creek bed. (erratum: --1.60 m NAP should be --2.60, etc.).
201
LAYER"
LAYER '.
production of distribution maps. The data were transmitted to the Univer-sity Computing Centre SARA and stored in a database which had been defined by means of the database management system SIR (Van Wijngaar-den-Bakker, this volume).
3. The relevance oj the zoological material
Finds may be subjected to various forms of analysis. Pottery may be examined on typology or technology, bones on animal species, element or age etc. Here, however, the material is used to obtain a distribution pattern as if it was a feature in the soil. The question is: where was rubbish dumped and what is its significance?
food remains. Food remains - in this case primarily bone debris - is composed of butchery offal, kitchen refuse and remnants as habitual refuse, being produced on a daily basis.
In addition to the domestic animals, a wide variety of game, birds, fish and shellfish complemented the daily menu of the inhabitants of Velsen 1.
Here, too, however, the concept « daily» must be used with care. Game animals, birds, fish and molluscs must be caught or collected, numbers and availability depend on the natural environment, season, weather conditions etc. In fact, only domesticates can be regarded as satisfying the continued and daily requirements for food (unless, of course, calamities interrupt the supply). In the strict sense, therefore, out of all the refuse accumulations, including nonorganic, only the bones of domestic animals may be regarded as representative of the daily pattern. Furthermore, they represent the refuse produced by the entire population : most other material categories are more or less bound by age, sex, status or occupation.
4. Analysis
For the reasons outlined above it was decided to produce a distribution map of the osteological remains of the domestic animals, using a simple retrieval program. All that is required is the identification of each square, the x-coordinate, the y-coordinate and the combined weights of the large and small domesticates. It would also be possible to construct a distribution map using
Bone refuse in a Roman harbour 203
the numbers of bones recovered in each square, but since the butchery methods affect the number of bones, this technique was not considered suitable for the present purposes. Any squares which had been disturbed in whole or in part were excluded as this analysis is based on the quantities per square metre.
There are several techniques of graphic representation available to produce the distribution maps themselves e.g. a dot map, in which the symbol increases in proportion to the quantity of refuse present (e.g. fig. 6, here drawn by hand, but also to be achieved by a computer program such as DrSPLA (Integrated software systems corporation, 1981). In the present case, however, it was decided to employ a contour map, in which the quantity (here, weight in grams) was used as the « height» measurement, utilizing the program Surface II (Sampson, 1978; fig. 5, by A. Visser, showing the program for the Roman layer).
The maps were produced by the computer to a scale of 1 :50 (line 270/2-3 ; 2.54 cm per inch) with contours every 50 gramme (line 250/3:50). The outline of the excavated areas was produced simultaneously, using the corner coordinates (input: line 170 = ROUT, output: line 260
=
POUT. Although the grid coordinates in reality are one metre apart (line 180 =EXTR) a grid of 50 cm (line 190 = GRID) was selected for the computer map in order to smooth the transitions, even though this represents a considerable increase in computer time. Features and the outlines of the moles and jetties were added by hand (Fig. 4 Dredge layer, Fig. 5 Roman layer). The Dredge layer is only plotted for trenches A and B since the dredged material was dragged further out into the creek channel to the east and thus falls outside the area of the other two trenches .
.5. Results
The general picture is that refuse was thrown from the western mole and its jetty, where maxima of over 1800 gr domestic bones debris per square metre (Trench A) occur. The quantities decrease gradually to the east (Trench B). It is noteworthy that very little material is found at the northern jetty (Trench D), despite the fact that this jetty head projects well into the still extent portions of the Roman layer. In addition, the effects of the prevailing winds and of any current present run primarily from west to east, which suggests that some of the material at the northern jetty may even have been transported from the denser concentrations. This all points to a conscious refuse disposal policy. The area around the northern jetty was evidently kept free, thus suggesting that the access to the northern jetty in particular and to the inner harbour between the two moles must have been of considerable importance.
In detail, two cluster concentrations may be distinguished around the western harbour works, one near the head of the mole (coordinates 5.50, 8.50, 10.50, 12.50 and 14.50), the other towards the head of the jetty (coordinates 27.50, 28.50 and 29.50). Unfortunately the area immediately surrounding the mole head was disturbed by pre-1982 excavations, but the general trend is still clear. The Roman layer was, as has already been mentioned, deposited after dredging. As is apparent from the dredging channels, the western jetty similarly post-dates the dredging activities. It is probable that some time elapsed between the dredging and the construction of the jetty, allowing the accumulation of some material belonging to the Roman level before the jetty was built. It would seem that refuse was dumped as far out into the harbour basin as was possible at first from the mole head and later, after the addition of the jetty from the jetty's end.
The comparison of the computer distribution maps of the Dredge and the Roman layers emphasises the more easternly extent of the refuse concentration which is caused chiefly by the presence of the jetty for most of the period. It must, however, be borne in mind that the dredge layer consists of re-deposited material which can only give a very general impression.
Bone refuse in a Roman harbour 205
REFERENCES
INTEGRATED SOFTWARE SYSTEMS CORPORATION, 1981, DISPLA, Display integrated software system and plotting language, User's manual, San Diego.
MOREL, .T.-M. A. W., in press, The early Roman defended harbours at Velsen, in Akten XIII. Limeskongress Aalen.
SAMPSON, R . .T., 1978, Surface II Graphics System, Kansas.
WIJNGAARDEN-BAKKER, L.H. VAN, Scientific information retrieval of zooarchaeological data, in this volume.
H. KAMERMANS
Instituut voor Prehistoric Reuvcnsp!aats 4
2311 BE LEIDEN, Netherlands
1.-M.A.W. MOREL & A. VISSER
Albert Egges van Giffen Instituut voor Prac- en Protohistorie Singe! 453
1012 WP AMSTERDAM, Netherlands
COMMENTS
It will be obvious that the contour distribution maps allow conclusions to be drawn as to the processes of rubbish disposal and the importance of particular areas of the harbour which would not otherwise have been apparent. The advantages of the use of a computer are self-evident. Although it did take some time to modify the programs so that they answered the purposes of this investigation, it will be possible to process the data much more quickly in the future. The programs are also suitable for plotting the distribution of other categories of finds. In addition, data from the coming seasons of excavation can be incorporated rapidly to complete the picture. Assuming that the data are read in correctly - which is fairly easy to check - we are assured of faultless maps produced by the computer. A few reservations remain, however.
NOTES