PORATION OF BIOLOGICAL MEMBRANES BY ANTIMICROBIAL PEPTIDES AND PRESSURE, INSIGHTS FROM COMPUTER SIMULATIONS
Ardeshir Goliaei
A dissertation submitted to the faculty of the University of North Carolina at Chapel Hill in partial fulfillment of requirements for the degree of Doctor of Philosophy in the Department of
Biochemistry and Biophysics.
Chapel Hill 2016
Approved by:
Max Berkowitz
Barry Lentz
Brian Kuhlman
Qi Zhang
iii ABSTRACT
Ardeshir Goliaei: Poration of Biological Membranes by Antimicrobial Peptides and Pressure, Insights from Computer Simulations
(Under the direction of Max L. Berkowitz)
The plasma membrane is the boundary of the cell that separates the outside world from its interior. It is the first barrier that any exogenous compound faces upon transferring to the cytoplasm. Additionally, this boundary plays a variety of biochemical roles for the cell including energy transfer, signal transduction, solute transport, etc. Lipids, proteins, and carbohydrates are three major components of the plasma membrane and their type and percentage differs
depending on the specific cell, organelle, or tissue type.
iv
There are a variety of experimental methods available for membrane research such as X-ray and neutron scattering, AFM, Fluorescence probing, and NMR. Additionally, molecular dynamics computer simulations can also be used in different research settings, to provide more atomistic insight into the processes that take place in the plasma membrane. A variety of force fields are available which provide different levels of atomic representation of the system in question and open the door for more detailed understanding of the nature of the cell membrane and how it behaves.
In this thesis, we used molecular dynamics computer simulations to ask two major
questions. First, what mechanisms are involved in opening of the plasma membrane? We studied Antimicrobial peptides (AMPs) and how their mechanism of action can be envisioned by
v
ACKNOWLEDGMENTS
I would like to express my most sincere gratefulness to my PhD advisor Prof. Max Berkowitz for his generous and constant support throughout my work. Whether it was a
scientific question or a personal one, he was always available with helpful comments, ideas, and guidance. I sincerely cannot imagine having a better advisor during my PhD program. I can confidently say that he knew what I liked to do, even better than myself. That is why we had such an amazing communication and his guidance has helped me so significantly.
Very sincerely, I would like to express my gratitude to Prof. Barry Lentz and Lisa Phillippie, for their outstanding support and help during my graduate life. I cannot thank Barry enough for his mentorship, support, and guidance in finding the best lab for my research and throughout my graduate work. The amount of care and attention that I have received from him is beyond my expectations. Additionally, Lisa has played a tremendous role in shaping my
graduate time at UNC. At any time that I needed help and advice she was always available with open arms and that means a lot to me. Simply, without Barry and Lisa, continuing graduate school would have been impossible for me and for that reason I am very grateful to both of them.
I would like to thank all the members of my committee Professors Barry Lentz, Brian Kuhlman, Alexander Tropsha, and Qi Zhang for their valuable guidance and support. I
vi
development. He was always available when I needed help and advice and I have used his
guidance to be a better thinker and a more independent researcher. I appreciate his time and help.
I would also like to thank Sheeba Irudayam, Santo Kolattukudy Poulose, and Upendra Adhikari, all the members of Berkowitz group. I have always had scientific discussion and fruitful collaborations with them. In addition I would like to thank all my friends and administrative staff in the Department of Biochemistry and Biophysics, the Program in
Molecular and Cellular Biophysics, the Program in Bioinformatics and Computational Biology (BCB), and the Biological and Biomedical Sciences Program (BBSP).
vii
TABLE OF CONTENTS
Page
TABLE OF CONTENTS ... vii
LIST OF TABLES ... xi
LIST OF FIGURES ... xii
LIST OF ABBREVIATIONS ... xv
CHAPTER 1: INTRODUCTION ... 1
1.1 Plasma membrane and its importance ... 1
1.2 The plasma membrane and its therapeutic potentials ... 2
1.3 Tools and techniques used for plasma membrane research ... 3
1.4 Molecular dynamics computer simulation technique ... 4
1.5 The research goals and approaches taken in this study ... 5
1.6 What mechanisms are involved in opening of the plasma membrane? ... 6
1.6.1 Antimicrobial peptides (AMPs) ... 6
1.6.2 Shock wave induced nano-bubble collapse and its impact on the plasma membrane ... 7
1.7 What mechanisms membrane sealants employ to restore the integrity of a damaged membrane? ... 8
CHAPTER 2: LOCAL PRESSURE CHANGES IN LIPID BILAYERS DUE TO ADSORPTION OF MELITTIN AND MAGAININ-H2 ANTIMICROBIAL PEPTIDES: RESULTS FROM COMPUTER SIMULATIONS ... 11
2.1 Introduction ... 11
viii
2.3 Results and Discussion ... 18
2.3.1 Membranes Containing 12 AMPs (P/L = 1/50) ... 18
2.3.2 Membranes Containing 18 AMPs (P/L = 3/100) ... 20
2.4 Conclusions ... 21
CHAPTER 3: MECHANISM OF MEMBRANE PORATION BY SHOCK WAVE INDUCED NANOBUBBLE COLLAPSE: A MOLECULAR DYNAMICS STUDY ... 29
3.1 Introduction ... 29
3.2 Methods... 32
3.3 Results ... 34
3.3.1 Shock Wave Simulations with Particle Velocity (νp) = 1.0 km/s ... 35
3.3.1.1 (a)Simulations with τs = 3 ps ... 35
3.3.1.2 (b)τs = 5 ps... 39
3.3.2 Shock Wave Simulations with Particle Velocity (νp) = 0.5 km/s ... 40
3.3.3 Shock Wave Simulations with a Smaller Nanobubble (Diameter, D = 20 nm) ... 41
3.3.4 Spontaneous Nanobubble Collapse (without Shock Wave) ... 42
3.4 Discussions and Summary ... 43
CHAPTER 4: OPENING OF THE BLOOD-BRAIN BARRIER TIGHT JUNCTION DUE TO SHOCK WAVE INDUCED BUBBLE COLLAPSE: A MOLECULAR DYNAMICS SIMULATION STUDY ... 70
4.1 Introduction ... 70
4.2 Results and Discussion ... 72
4.3 Conclusion ... 76
4.4 Methods... 76
ix
5.1 Introduction ... 85
5.2 Methods... 88
5.2.1 Coarse-Grained Force Field ... 88
5.2.2 Setup of Molecular Dynamics (MD) Runs ... 88
5.2.3 Simulations of Poloxamers in Bulk water... 89
5.2.4 Simulations of Poloxamers in the Presence of a Bilayer Membrane ... 90
5.2.5 Simulations of Poloxamer Micelles in the Presence of a Bilayer Membrane Containing a Pore ... 91
5.3 Results and Discussion ... 91
5.3.1 Radii of Gyration (Rg) ... 91
5.3.2 Interaction of Poloxamers with Membrane ... 92
5.3.3 Interaction of Poloxamer Micelles with the DMPC Bilayer ... 94
5.3.4 Does the P188 Micelle Seal the Pores in the Membrane? ... 94
5.4 Summary ... 96
CHAPTER 6: BEHAVIOR OF P85 AND P188 POLOXAMER MOLECULES: COMPUTER SIMULATIONS USING UNITED-ATOM FORCE-FIELD ... 109
6.1 Introduction ... 109
6.2 Methods... 112
6.2.1 United-Atom Force-Field Parameters ... 112
6.2.2 Molecular Dynamics Simulations ... 113
6.3 Results ... 117
6.3.1 Simulations of P85 and P188 in Water ... 117
6.3.2 Simulations of P85 and P188 at the Air/Water Interface ... 118
6.3.3 Interaction of P85 and P188 Poloxamers with the DLPC Model Membrane ... 119
x
6.3.5 Interaction of P85 and P188 Poloxamers with Damaged DLPC
Model Membrane ... 121 6.4 Discussion and Conclusions ... 122
xi
LIST OF TABLES
Page Table 3.1: Summary of the results from shock wave simulations. ... 46 Table 4.1. Impulse and velocity of the shock wave at the time when it
hits the bilayer for different piston stopping time (τs). ... 79
Table 5.1: Nonbonded parameters for the interaction of PEO and PPO
xii
LIST OF FIGURES
Page Figure 2.1: Lateral pressure profiles from simulations in the
NPT ensemble. ... 24
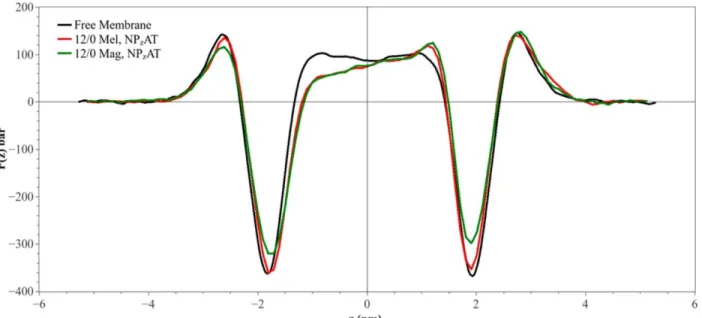
Figure 2.2: Lateral pressure profiles from simulations in the NPzAT ensemble. ... 25
Figure 2.3: Lateral pressure profiles from simulations in the NPT ensemble. ... 26
Figure 2.4: Lateral pressure profiles from simulations in the NPzAT ensemble. ... 27
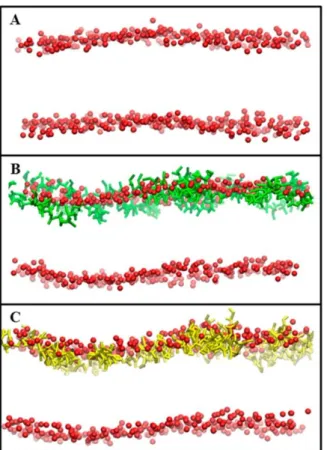
Figure 2.5: Bilayer structures obtained from some of the simulations performed in this study. ... 28
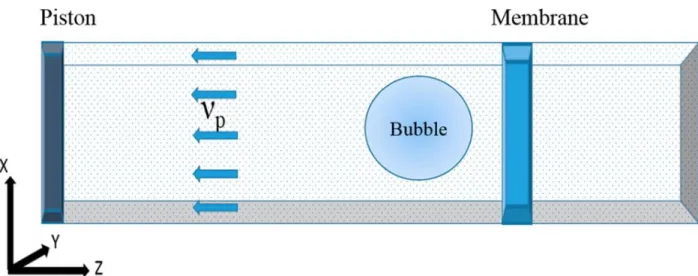
Figure 3.1: Representation of systems simulated in this work. ... 47
Figure 3.2: 2-Dimensional water density maps ... 48
Figure 3.3: 2-Dimensional water density maps ... 49
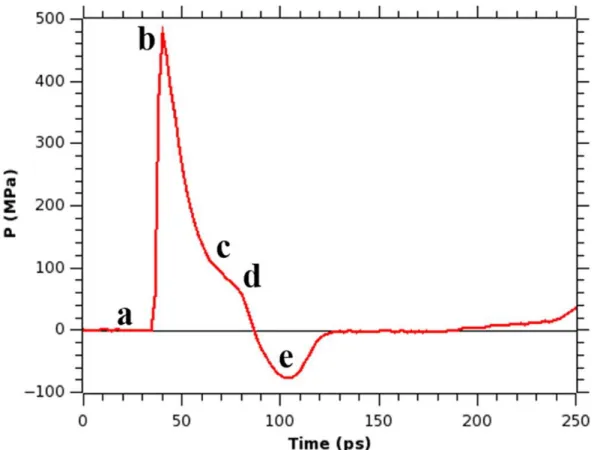
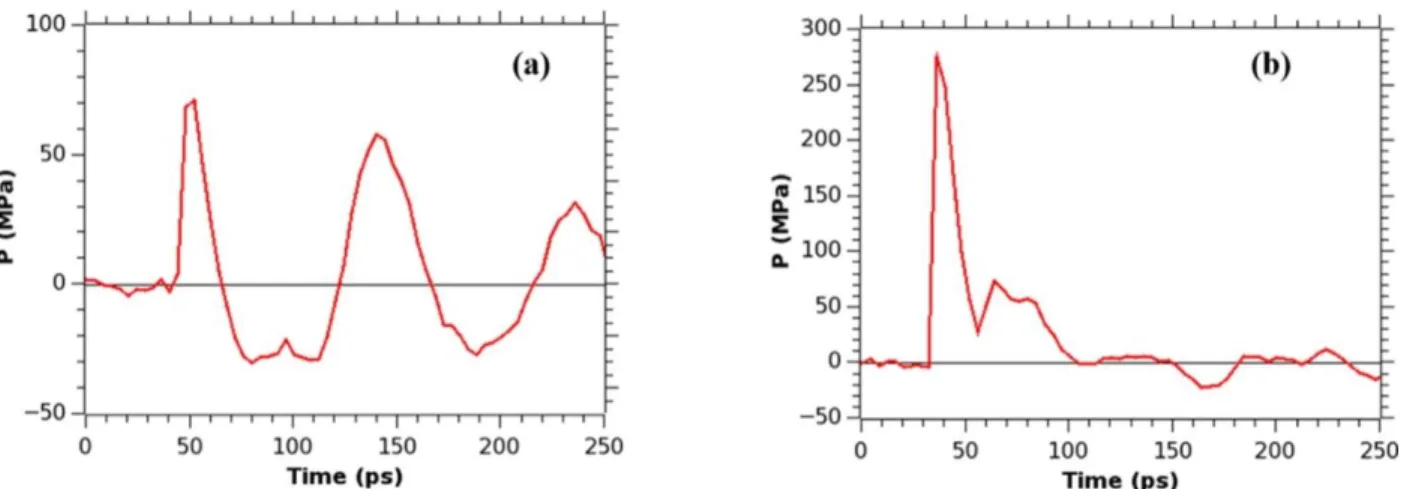
Figure 3.4: Time dependence of the pressure normal to the membrane surface ... 50
Figure 3.5: 2-Dimensional pressure maps at the membrane position ... 51
Figure 3.6: Snapshots of the bilayer membrane at various times of the simulations ... 52
Figure 3.7: Pressure profile at the membrane ... 53
Figure 3.8: 2-Dimensional pressure maps at the membrane position ... 54
Figure 3.9: Snapshots of the bilayer membrane at various times of the simulations ... 55
Figure 3.10: Pressure profiles at the membrane position ... 56
Figure 3.11: 2-dimensional pressure maps calculated at the membrane position ... 57
xiii
Figure 3.13: 2-dimensional pressure maps calculated at the
membrane position ... 59
Figure 3.14: Bilayer membrane at various times of the simulation ... 60
Figure 3.15: Pressure profiles at the membrane position ... 61
Figure 3.16: 2-dimensional pressure maps calculated at the membrane position ... 62
Figure 3.17: Bilayer membrane at various times of the simulation ... 63
Figure 3.18: 2-dimensional pressure maps calculated at the membrane position ... 64
Figure 3.19: Bilayer membrane at various times of the simulation ... 65
Figure 3.20: Pressure profile at the membrane position ... 66
Figure 3.21: 2-dimensional pressure maps calculated at the membrane position ... 67
Figure 3.22: Bilayer membrane at various times of the simulation ... 68
Figure 3.23: Water density and snapshots of membrane. ... 69
Figure 4.1: Initial configuration of the model TJ. ... 80
Figure 4.2: Shock wave simulations with and without a nanobubble... 81
Figure 4.3: RMSD curves for each of the claudin-15 proteins. ... 82
Figure 4.4: Number of contacts between interacting protein pairs. ... 83
Figure 4.5: Overall progress of the simulation during the 60 ps shock wave propagation ... 84
Figure 5.1: Time dependence of radius of gyration of P85 poloxamer molecule ... 99
Figure 5.2: Time dependence of radius of gyration of P188 poloxamer molecule ... 100
Figure 5.3: Snapshots of micelles of P85 (aggregation number = 60; left) and P188 (aggregation number = 21; right) ... 101
xiv Figure 5.5: Various stages of insertion of Poloxamer
P85 into the DMPC bilayer. ... 103
Figure 5.6: Various stages of insertion of Poloxamer P188 into the DMPC bilayer. ... 104
Figure 5.7: Density profiles ... 105
Figure 5.8: Interaction of P85 micelle with the DMPC bilayer. ... 106
Figure 5.9: Interaction of P188 micelle with the DMPC bilayer. ... 107
Figure 5.10: Snapshots of interaction of P188 micelle with the DMPC bilayer containing a pore. ... 108
Figure 6.1: Chemical structure of poloxamers. ... 127
Figure 6.2: The radius of gyration of P85 in water. ... 128
Figure 6.3: The radius of gyration of P188 in water. ... 129
Figure 6.4: P85 molecules at the interface of air/water. ... 130
Figure 6.5: P188 molecule at the interface of air/water. ... 131
Figure 6.6: Radius of gyration of PPO block of P85 molecules at air/water interface. ... 132
Figure 6.7: Radius of gyration of PPO block of the P188 molecule at the air/water interface. ... 133
Figure 6.8: Interaction of P85 poloxamer with the DLPC model membrane. ... 134
Figure 6.9: Interaction of P188 poloxamer with the DLPC model membrane. ... 135
Figure 6.10: Self-assembly of P85 poloxamer, DLPC lipid monomers, and water molecules. ... 136
Figure 6.11: Interaction of five P85 poloxamers with a damaged DLPC model membrane. ... 137
xv
LIST OF ABBREVIATIONS
AA All atom
AMP Antimicrobial peptide BBB Blood-brain barrier
bTBI Blast-induced traumatic brain injury CG Coarse-grained
COM Center of mass
DLPC 1,2-dilauroyl-sn-glycero-3-phosphocholine DMPC 1,2-dimyristoyl-sn-glycero-3-phosphocholine DOPC 1,2-dioleoyl-sn-glycero-3-hosphatidylcholine DPPC 1,2-dipalmitoyl-sn-glycero-3-phosphocholine FF Force-field
GUV Giant unilamellar vesicles HLB Hydrophilic–lipophilic balance K Kelvin
MD Molecular dynamics MDR Multi-drug resistant
mTBI Mild traumatic brain injury nm Nanometer(s)
xvi ns Nanosecond(s)
PBC Periodic boundary conditions PDB Protein data bank
PEO Poly(ethylene oxide) PME Particle mesh Ewald PPO Poly(propylene oxide) ps Picosecond(s)
PtP Peak-to-peak Rg Radius of gyration
RMSD Root-mean-square deviation SPC Simple point charge
1
Chapter 1: Introduction
1.1 Plasma membrane and its importance
The plasma membrane provides a barrier that separates the interior of the cell from the outside world. Interestingly, this barrier plays a variety of biochemical functions such as: compartmentalization, solute transport and permeability, responding to external signals and signal transduction, conversion of different energy types, and providing a scaffold for
intercellular connections. The significance of these functions is highlighted when we realize that eukaryotic cells devote a large number of their genes to synthesize different lipids1; one of the building blocks of the plasma membrane. Other major components of the plasma membrane are proteins and carbohydrates. Numerous lipid types in combination with varied proteins and carbohydrates at different ratios are responsible for the diversity of biological membranes in a cell (e.g. Golgi or endoplasmic reticulum) or an organism (e.g. eukaryotes or prokaryotes) or a specific tissue (e.g. heart or skin or kidney).
In general, membrane lipid molecules are amphipathic, meaning they have a hydrophilic head group which interacts with the solution on either side of the bilayer, and a hydrophobic tail where its packing with the neighboring lipid tails generates the core of the membrane.
2
1.2 The plasma membrane and its therapeutic potentials
The fact that the plasma membrane is a barrier that keeps the integrity of the cell intact provides a huge potential for therapeutical purposes. Any exogenous compound that is used as a medicine in an organism will face the challenge of being transported to the cell interior or interacting with the signaling receptors residing in the membrane surface. In addition,
permeability of the plasma membrane toward water and specific ions play a significant role in the electrochemical gradient across the membrane; a major application of this gradient is
observed in neuronal cell signal transduction. Consequently, keeping the membrane healthy and intact is a crucial task and when a factor or trauma results in damage to the cell membrane and its permeability, a disease state is developed which needs medical intervention. There are a majority of traumas that are potentially harmful to the integrity of the membrane such as heat or electric shock.
Keeping the plasma membrane healthy and intact is not always favorable from a
therapeutic point of view; it depends on the context and the organism in question. A significant part of medicine deals with preventing opportunistic and pathological organisms, including bacteria, viruses, and fungi from growing and reproduction in the host. Since these opportunistic microorganisms are encapsulated in a plasma membrane, one of the approaches for antibiotic intervention is to interfere with the permeability of the invading microorganism’s plasma membrane or its cell membrane synthesis machinery. Daptomycin, as an example, is a lipopeptide antibiotic which targets bacterial cell membrane specifically. Following insertion into the bacterial membrane, it aggregates with other daptomycin molecules and generates holes in the membrane. The leakage from the bacterial cell through these holes results in
3
antifungal drug, works by depleting the ergosterol, resulting in a less stable cell membrane which eventually interferes with all activities of the membrane including transfer of nutrients and chitin synthesis3.
From another perspective, since the plasma membrane is the first barrier in front of any exogenous material, breaking open this barrier in a controlled and reversible manner would be potentially useful for drug and macromolecule delivery to the intercellular space. One promising approach to fulfill this has been the application of shock waves4–8. Needless to say, when the
shock wave is produced uncontrollably, similar to the ones that appear during an explosive blast, depending on the case they could be detrimental or pathogenic. More specifically, exposure of neural cells to uncontrolled shock waves, in the human brain, can predispose the individual to blast-induced traumatic brain injury (bTBI)9.
1.3 Tools and techniques used for plasma membrane research
4
that reproduces every aspect of membrane or protein biology is not available and computational experiments always are meaningful within considering certain assumptions.
1.4 Molecular dynamics computer simulation technique
Molecular dynamics is a computer simulation technique in which movement and position of atoms is predicted by numerically solving Newton’s equations of motion resulting in
trajectories of the particles which represent the way the particles evolve over time. Calculating averages over these trajectories enables us to connect the microscopic representation of the system with the macroscopic experimental measurable quantities.
At the heart of the technique, there is the notion of a force-field (FF), which is defined as a set of parameters to calculate potential energy between interacting particles. It is the force-field that determines the accuracy of the prediction of the particle position at any step; accordingly, to have a reliable prediction and accurate trajectory one requires a carefully defined and evaluated force-field. In other words, the force-field that reproduces the experimentally measured
quantities more accurately is a better parameter set.
Force-fields come in with employing different representations of particles. When every atom type in the system is represented as an explicit and separate particle it is called “all-atom” (AA), whereas merging hydrogen with carbon and making individual single particles such as CH, CH2, or CH3 types results in “united-atom” (UA) force field. The merging of the hydrogens
with the carbons reduces the computational cost of the calculations. In order to reduce the calculation time even more and reach larger size and time scales, sometimes another
5
merged together, making the representation even more crude. However, the gain is an increase in the speed and the size of the system to be simulated. The factor that determines the choice of the force-field is the research goals and the type of the questions in the study. As an example, if the researcher is interested in studying the interaction of a small molecule or drug with the active site of an enzyme, it makes more sense to use an all-atom representation of the system since
understanding the atom-atom interactions are the key. On the other hand, when the research interest is about the bulk properties of a patch of membrane and how they change under different conditions, it is more reasonable to simulate a larger system represented in a coarse-grained field, since each individual interaction is not that informative. Among the available force-fields for simulating biological systems, CHARMM18 (AA), AMBER19 (AA), OPLS20 (AA), GROMOS21 (UA), and MARTINI22 (CG) are more reliable, carefully tested, and more commonly used.
1.5 The research goals and approaches taken in this study
The overall purpose of this dissertation was to utilize molecular dynamics computer simulations technique to study different approaches to the plasma membrane. Our force-field of choice was MARTINI22 (CG) model were the coarse-grained nature of the atomic resolution allowed us to simulate large size patches of membrane and achieve longer time scales. When more detailed output was required, we used GROMOS 53A623 (UA).
6
favorable or pathogenic interpretations; when the purpose of the study is to develop an understanding on how specific molecules attack bacterial membrane selectively and make it leaky, it has favorable pharmaceutical applications (e.g. antibiotic production). However, if we are interested to understand how neural cell membranes react to uncontrolled shock waves impact and how this membrane and cell damage can cause brain injury, it can provide
explanation on the pathogenicity of the blast exposure. Interestingly, the same shock wave, when used under control can be utilized in delivery of molecules to the cell, which is therapeutically applicable. In addition, the second route provides molecular pictures on how trauma to the membrane is sealed and its significance in pharmaceutical research and treatment procedures is therefore helpful.
1.6 What mechanisms are involved in opening of the plasma membrane?
1.6.1 Antimicrobial peptides (AMPs)
In Chapter two, we studied two antimicrobial peptides melittin and magainin and how their absorption to the surface of a model lipid bilayer changes the local pressure. Antimicrobial peptides are the first line of defense against bacterial invasion before a more sophisticated host response is involved. Their specificity toward bacteria highlights their role as potential candidate for antibiotic development. The main goal in our research was to shed light on how these
7
task that is experimentally impossible to do, evaluating this hypothesis on empirical bases was not feasible. However, we employed molecular dynamics computer simulations where the local pressure profile in the membrane, within any arbitrary interval along the normal axis (z) to the membrane surface can be measured. In addition, to better emulate the initial non-equilibrium state of the interaction of the peptides with the membrane, before pore formation or membrane rupture, we tested two ensembles, NPT (constant pressure, temperature, and number of particles) versus NPzAT (constant normal pressure, area, temperature, and number of particles), to test
which one captures the state of the initial absorption better.
1.6.2 Shock wave induced nano-bubble collapse and its impact on the plasma membrane
Chapter three looks at the molecular mechanisms behind membrane damage under the impact of a shock wave. There are numerous studies in the literature highlighting the importance of collapse of bubbles close to biological membranes, upon the impact of a shock wave26–31.
8
Building on our better understanding of the role of cavitation in shock wave induced membrane damage, we applied molecular dynamics simulations to model how shock wave induced nano-bubble collapse can damage blood-brain barrier (BBB). We describe this part of the work in Chapter four. The idea comes from the pathophysiology of blast-induced traumatic brain injury (bTBI) where exposure to blast shock waves results in BBB openings and
consequently leakage of compounds from the blood to the brain tissue. The accumulation of these unwanted compounds in the brain will result in neuro-inflammation and other
complications that veterans and military personnel who served in active war zones suffer from32. From another point of view, the same principle can be used in a controlled way to reversibly and temporarily open the BBB to achieve delivery of chemotherapeutical agents to brain tumors; a route which is closed under normal conditions33,34. Interestingly, administration of micro-bubbles into the blood stream, prior to the local shock wave exposure, reduces the energy of the ultra sound required to open the BBB35. Since we already observed how cavitation enhances the damaging effect of the shock wave (Chapter three), we investigated the role of cavitation in the vicinity of a model tight junction (TJ). Our TJ represents a very simple imitation of the
connecting blocks of endothelial cells in brain capillaries. Our computer simulations provided evidence on significance of cavitation in the pathophysiology of blast-induced TBI and shock wave exposure.
1.7 What mechanisms membrane sealants employ to restore the integrity of a damaged membrane?
9
industry as surfactants. They also have applications in drug delivery and membrane healing36–40. We focused on two prototypical polymers P85 and P188. The former is a hydrophobic polymer with tendency to cross the membrane (drug delivery applications37) and induce conformational changes in membrane proteins41, while the latter is a more hydrophilic polymer with
therapeutical applications in burned patients42.
To study how these polymers interact with membranes, we focused on both individual and micelle interaction of triblock copolymers with bilayers. To reduce the cost of calculations and achieve a larger time scale, we developed a set of coarse-grained (CG) parameters for simulating these polymers both in solution and in close proximity of a patch of lipid bilayer. The importance of our simulation was employing polarizable water model in the coarse-grained resolution since polarization of water will capture the interaction of polar groups in Poloxamers with polar or charged groups in the lipids in a more realistic way. In addition, we investigated the interaction of a micelle of P188 Poloxamer close to a damaged model membrane. Our study is the first attempt in providing molecular pictures of membrane healing by P188 micelles in the literature.
10
proteins will lose most of the side chain resolution of amino-acids and specific interactions will be lost. A higher resolution force-field on the other hand will preserve the interacting particles and provides a better and clearer picture of the way P85 interacts with proteins. Our goal of the study was to provide such a force filed.
To achieve this we started by a modified united-atom force field (GROMOS 53A6_OE43)
11
Chapter 2: Local Pressure Changes in Lipid Bilayers Due to Adsorption of Melittin and Magainin-h2 Antimicrobial Peptides: Results from Computer Simulations1
2.1 Introduction
Antimicrobial peptides (AMPs) often represent the first line of defense against invading bacteria; they work by damaging the invaders membrane. In spite of a large amount of work to understand the molecular mechanism of AMP action, the details still remain unclear44. Different scenarios were proposed to explain damage to membranes, including creation of pores of
different architecture, like barrel-stave or toroidal, or rupture of membranes by peptides that act as surfactants (so-called carpet model)45–47. Experiments indicate that, once adsorbed on the bilayer surface, different AMPs act in different ways. For example, it is suggested that melittin permeates the membrane and creates transient pores24. As a result of such permeation the number of peptides increases on the other leaflet of the membrane bilayer, until an equal amount of peptides is located on surfaces of both leaflets: after that a permanent toroidal shape pore is created with its walls containing melittin and lipid headgroups24. A different scenario of action is
proposed for another AMP, magainin. In this case it is proposed that peptides do not permeate the membrane; instead they create a pore due to tension that exists in the membrane because of the peptides presence on the membrane surface25. These two distinct mechanisms of pore
creation in the membrane are consistent with two different patterns of dye leakage from the giant
1 This chapter previously appeared as an article in the Journal of Physical Chemistry B. The original citation is as
12
unilamellar phospholipid vesicles (GUV) exposed to solution of AMPs. When AMP in the experiment is melittin, the dye leakage from the vesicle is graded (gradual),48 due to transient
pores in GUV and also, perhaps, presence of rather small permanent pores. When AMP is magainin, some of the vesicles open pores under tension and some do not, while magainin does not permeate the membrane and stays on the membrane surface25,49. The dye leaks only from the vesicles with open pores, while no leakage occurs from the vesicles that are intact. Therefore, the mechanism of dye leakage in this case is called all-or-none. While the two mechanisms look different, it is proposed that a common feature for both of them is that peptides exert tension in each case and membrane ruptures, although to a different degree, in order to release this tension.
In addition to a large amount of experimental work that studied the interaction between membranes and AMPs, computer simulations were also performed that can provide detailed molecular information about the interaction between peptides and lipid membranes50–63. To
imitate the experimental situation AMPs were often placed on the surface of the bilayer, and the development of the system was followed. Most of the simulations containing lipid membrane and AMPs were performed using constant pressure, constant temperature (NPT) ensemble. In these simulations the pressure was chosen to be equal in all three directions, which is equivalent to setting the value of the total stress experienced by the membrane to zero. Indeed, the stress on the membrane is given by the equation
𝜎 = − ∫ [𝑃𝐿(𝑧) − 𝑃𝑁(𝑧)] 𝑧2
𝑧1
𝑑𝑧 = − ∫ 𝑃(𝑧)𝑑𝑧 𝑧2
𝑧1
( (2.1) where PL(z) = (Pxx + Pyy)/2 is the local lateral pressure depending on the z-coordinate which is
normal to the membrane surface, PN(z) is the local normal pressure, which is a constant along the
13
positions are taken to be outside the bilayer where the values of the integrand P(z) are zero). P(z), the difference between lateral and normal pressure, is also often called the lateral pressure,
since the shape and values of the P(z) profile are mostly determined by PL(z). Thus, eq 2.1
predicts that by using an NPT ensemble with equal pressure in all three directions the value of stress equal to zero is obtained for the bilayer. That the total stress on the membrane bilayer is equal to zero in the NPT simulations of systems containing asymmetric distribution of AMPs on the bilayer leaflets does not mean that the stress acting on each leaflet is also zero. Indeed, one can consider the bilayer as two monolayers and, therefore, represent the integral for stress from eq 2.1 as sum of two integrals
𝜎 = − ∫ 𝑃(𝑧)𝑑𝑧 𝑧0
𝑧1
− ∫ 𝑃(𝑧)𝑑𝑧 𝑧2
𝑧0
( (2.2) where z0 is the z coordinate of the normal to bilayer line that divides the bilayer into two
monolayers. In eq 2.2 every integral represents the stress on the corresponding monolayer.
If all peptides are initially placed on one of the leaflets, and the simulation is performed using the NPT ensemble with equal pressure in all three directions, the total stress on the
14
on the membrane surface, the values of the stress acting on each monolayer are different. In this case the simulations should be performed using a different ensemble, for example constant normal pressure, constant area, and constant temperature (NPzAT) ensemble when the area is known. Using the latter ensemble, the simulation usually produces a nonzero stress in the bilayer.
In this paper we report the results from simulations performed to study how the local pressure profiles change with the change in the total stress acting on the membrane. Therefore, we perform simulations in both NPT and NPzAT ensembles, since they produce different total stress in the membrane. Our simulations are done on systems with bilayers containing 1,2-dioleoyl-sn-glycero-3-phosphatidylcholine (DOPC) lipids and AMPs, either melittin or magainin, adsorbed on one of the monolayers. We chose the lipid to be DOPC, since
experimental data are available to us for the systems containing DOPC and melittin peptides at different P/L ratios64. We also want to understand how the difference in stress produced by melittin or magainin can produce a difference in their mode of antimicrobial action. Since the activity of the AMPs depends on their peptide to lipids ratio (P/L), we performed our simulations at different P/L. We use a coarse-grained force field MARTINI65 in our simulations, since by using this force field we can run our simulations for longer time to accumulate more data and produce smoother pressure profiles.
2.2 Methods
15
of 600 lipid molecules was generated using the “insane.py” script provided by the MARTINI Web site (http://md.chem.rug.nl/cgmartini/images/tools/insane/insane.py). Na+ and Cl– ions were
added to maintain an ion concentration of 0.1 M. The generated membrane was energy
minimized and equilibrated for 2 μs using the NPT ensemble. Temperature at 303 K and pressure at 1.0 bar (semi-isotropic coupling) were maintained using the Berendsen coupling scheme68 with time constant of 2 ps. Compressibility value was 3 × 10⁻⁴ bar–1 for pressure coupling. The cutoff for the Lennard-Jones interactions was set to 1.2 nm, and the reaction-field scheme69 was
used for the electrostatics with a cutoff of 1.2 nm and a dielectric constant of 2.5. The time step for integration was 20 fs.
The peptides in this study are melittin and magainin-h2. Melittin has the following sequence: GIGAVLKVLTTGLPALISWIKRKRQQ. The initial structure of melittin was obtained from the available crystal structure70,71. Total charge of +6 was considered, which
originates from the following residues: protonated Glycine1 (at physiological condition72), Lysine7, Lysine 21, Arginine 22, Lysine 23, and Arginine 24. The sequence of the second peptide, magainin-h2 is IIKKFLHSIWKFGKAFVGEIMNI. This peptide is an analogue of the magainin-2 which is widely studied experimentally73. Magainin-h2 has a net charge of +3 due to Lysine 3, Lysine 4, and Lysine 11 residues. Initial structure for magainin-h2 was generated by mutating the corresponding residues in the NMR structure of magainin-274 using the Pymol software75. In any simulation containing melittin or magainin-h2 a corresponding number of Cl– ions were added to keep the systems neutral. We performed simulations on eight systems containing lipid bilayers and AMPs; in all of our systems peptides were located on just one side of the bilayer. In four of our systems the peptide was melittin, and in the other four it was
16
so our simulations were performed at P/L of 1/50 and 3/100. Each system was simulated in both NPT and NPzAT ensemble. Initially, in every simulation our peptide molecules were randomly inserted into the bilayer (containing 600 lipid molecules) with peptide helices oriented parallel to membrane surface and located just below the phosphate headgroup regions. The assembled system was energy minimized and equilibrated for 2 μs.
For the simulations with peptides, performed in the NPzAT ensemble, we needed to know values of the area, A. Initially we found the area per lipid for pure DOPC bilayer by performing simulations in the NPT ensemble on this system (area per lipid: 67.8 Å2). In order to find the area change when melittin peptides were added, we used the available experimental data that showed the change in the hydrophobic length of the membrane with the addition of melittin peptides at different P/L ratios64. To find the change in the area, we followed the same argument as used in the experimental analysis. Assuming that the volume of the hydrocarbon region of a membrane does not change upon insertion of a peptide, the value of the final area (in the presence of peptides) relative to the initial area (peptide free membrane) can be obtained from the following formula:
𝑉𝑖𝑛𝑖𝑡𝑖𝑎𝑙 = 𝑉𝑓𝑖𝑛𝑎𝑙, (
(2.3) or
𝐴𝑖𝑛𝑖𝑡𝑖𝑎× 𝑍𝑖𝑛𝑖𝑡𝑖𝑎𝑙 = 𝐴𝑓𝑖𝑛𝑎𝑙× 𝑍𝑓𝑖𝑛𝑎𝑙,
17
𝐴𝑓𝑖𝑛𝑎𝑙 = 𝐴𝑖𝑛𝑖𝑡𝑖𝑎𝑙× ( 𝑍𝑖𝑛𝑖𝑡𝑖𝑎𝑙
𝑍𝑓𝑖𝑛𝑎𝑙).
( (2.5) The ratio of Zinitial/Zfinal was obtained from the experimental data64 and for the Ainitial the
average value of the area of the DOPC simulation after 2 μs equilibration was selected (67.8 Å2). After calculating the Afinal, box-X and box-Y values of the protein containing simulations were
changed to reach the calculated value, using eq 2.5, for the final area (area per lipid: 71 Å2). Since the experimental data for bilayers containing magainin-h2 peptide are not available to us, we assumed that the areas of the bilayers with melittin and magainin-h2 are the same. This allows us to concentrate on the effect produced only by the difference in the composition of the peptides. Experiments show that, for melittin, when the P/L ratio reaches the value of 1/50, the area stops changing with the increase of the P/L64. Therefore, the NPzAT simulations with P/L = 3/100 for melittin were done at the same value for area as when P/L was 1/50. Moreover, since we assumed that areas in NPzAT simulations with melittin and magainin-h2 were the same, it follows that all our simulations with AMPs in the NPzAT ensemble were performed at the same value of the area.
Calculations of the pressure profiles in this work were done using the new method developed recently76 which relies on a previous local pressure code implementation77. The new
code correctly provides a constant value of Pzz for both coarse grained and atomistic simulations. Prior to pressure calculations each system was equilibrated for 5 μs followed by the data
18
calculations was set to 1 Å. Visualization of the resultant trajectories was performed using the VMD78 software. We did not observe any spontaneous pore creation in our simulations.
2.3 Results and Discussion
To study the difference between results obtained from simulations on systems containing AMPs adsorbed on membrane surfaces by using the NPT ensemble with equal pressure in all three directions and simulations where the NPzAT ensemble was used, we studied systems containing melittin and magainin-h2 peptides adsorbed on the outer surface of the DOPC membrane at different P/L ratios. We started our simulations by placing peptides in the phosphate headgroup region of the membrane. This was done because when peptides were placed into the solution on top of the bilayer, they tended to aggregate into a big globular structure, which did not interact with the membrane. Accordingly, our simulations capture the sequence of events following the adsorption of peptides on the bilayer surface. We observed that, during the simulations, several peptides sometimes combined into small aggregates for short periods of time, but most of the time peptides were distributed throughout the whole bilayer area without aggregation.
2.3.1 Membranes Containing 12 AMPs (P/L = 1/50)
Four simulations were performed for systems containing 12 peptides: 2 contained melittin and 2 magainin-h2. Figure 2.1 shows the lateral pressure profile obtained from
19
stronger repulsion between these tails. This is happening because the AMPs compress the lipids in this leaflet. The local pressure in the tail region of the opposing leaflet is reduced, since the leaflet slightly expands. The negative dips located in the regions of water/headgroup interface of the monolayers are also slightly reduced, indicating a reduction in the hydrophobic tension. It is interesting that the dip is reduced stronger by magainin-h2, indicating that it acts as a better surfactant. We calculated that the total stress on the upper layer due to the presence of melittin is −6.4 ± 0.2 mN/m, while it is 6.9 ± 0.8 mN/m for the lower. These are equal (within an error bar) in their absolute value, as expected. For magainin-h2 the values are −7.7 ± 0.6 mN/m and 7.7 ± 0.3 mN/m for upper and lower layers, respectively. As we can see, the stresses in the monolayers caused by melittin and magainin-h2 are quite similar if the ensemble used is NPT, although magainin-h2 produces a somewhat larger stress. Finally, for comparison, the average area per lipid in the systems with peptides simulated in the NPT ensemble was 72.1 Å2 for simulations
with melittin and 72.8 Å2 with magainin-h2.
20 2.3.2 Membranes Containing 18 AMPs (P/L = 3/100)
Four simulations were also performed on systems containing 18 peptides. Figure 2.3 shows pressure profiles from simulations performed using the NPT ensemble. The shapes of the curves are similar to the shapes from Figure 2.1, although the deviations from the curve for the free bilayer are much larger in Figure 2.3. Particularly large deviations are observed in the region of the negative dip, especially in case of magainin-h2. The values of the stress in these
simulations are −8.8 ± 0.3 mN/m for upper monolayer and 9.4 ± 0.3 mN/m for the lower bilayer in the case of melittin. For magainin-h2 the corresponding numbers are −10.4 ± 0.7 mN/m for upper monolayer and 11.1 ± 0.4 mN/m for lower monolayer. The absolute value of the stress on each monolayer increased relative to the value of the stress experienced by monolayers, when the ratio was 1/50. Also, the stress due to magainin-h2 was ∼10% larger than the stress due to
melittin. Average areas per lipid obtained for the systems with peptides simulated in the NPT ensemble were the following: with melittins, 73.6 Å2, and with magainin-h2, 75 Å2.
21
1.4 mN/m for upper leaflet and 8.4 ± 0.3 mN/m for lower leaflet. For the case with magainin-h2 the results for stress are −14.8 ± 0.6 mN/m for upper leaflet and 8.5 ± 0.5 mN/m for the lower leaflet. As we can see, the stress induced by magainin-h2 on the leaflet of the bilayer on which the peptides are adsorbed is much stronger than the stress due to action of melittin. The absolute values of the total stress induced by melittin and magainin-h2 are also different: it is ∼2 mN/m in case of melittin and 3 times larger value (∼6 mN/m) for magainin-h2.
2.4 Conclusions
There are two issues we attempt to understand by performing simulations described here. The experimental papers dealing with the AMPs action often refer to the importance of stress caused by the presence of peptides in the system. Therefore, the first issue we consider is related to the somewhat paradoxical situation, that when NPT simulations with equal pressure in three directions are performed, the total stress experienced by the bilayer is zero, even in the presence of AMPs adsorbed on the bilayer surface. The second issue is related to the difference in action of AMPs such as melittin and magainin-h2, and its connection to the difference in stress profiles produced by these AMPs.
22
opposite directions on upper and lower leaflets, membranes may bend. In our simulations we observed that the values of the stresses on monolayers we obtained from the NPT simulations of bilayers with melittin and magainin-h2 are similar; this makes it difficult to explain the
difference in the mode of magainin versus melittin action as due to difference in stress.
Free lipid bilayers in equilibrium experience no stress. When AMPs are adsorbed on the surface of one of the leaflets, the system may find itself initially in a nonequilibrium state with a total stress not equal to zero. To remove the stress the bilayer will rearrange through creating pores and bending, thus moving to a new equilibrium state with the total stress again equal to zero. The NPzAT simulations are better in mimicking the initial stage when the total stress is nonzero. In these simulations the stresses on each monolayer, although still different in the sign, are not equal in their absolute values. The action of a pair of forces acting in different directions and of unequal value should result in a creation of a bilayer with a larger curvature. Figure 2.5 shows the shape of the bilayers with the 18 AMPs adsorbed on the upper leaflet when
simulations were done in NPzAT ensemble. For comparison, the shape of the pure bilayer obtained from the NPT simulation is also shown. While there is little curving present in the simulation of pure lipid bilayer, the curving of the bilayers with AMP is clearly seen. Nevertheless, some words of caution are required to be said here: the geometry of our simulations that are performed using periodic boundary conditions may suppress the curving tendency, or produce a wrong curvature.
23
the bilayer (i.e., simulations performed in NPzAT ensemble) show that magainin-h2 at larger P/L produces a larger stress on the bilayer compared to stress produced by melittin. This observation is consistent with the suggestions about the mechanism of magainin antimicrobial activity made by Tamba et al. based on their experimental work25.
24
25
26
27
28
29
Chapter 3: Mechanism of Membrane Poration by Shock Wave Induced Nanobubble Collapse: A Molecular Dynamics Study2
3.1 Introduction
The interaction of shock waves with biological cells is a subject of active research79–85. This interaction can produce both positive and negative effects: controlled shock waves have a potential for medical use, since they increase the permeability of cell membranes86 and this allows various macromolecules, such as drugs and also genetic material to enter the cell4,26,27,87– 92. On the negative side uncontrolled shock waves produced during a blast may damage brain
cells, thus causing blast induced traumatic brain injury (bTBI) and neural cell damage or even its death. To understand the details and the role of shock waves in bTBI, experiments9,82,93,94 using shock tubes and also computer simulations83,95 have been performed. However, the mechanisms behind the bTBI, especially mild TBI (mTBI) are still not clearly understood, as the severity of TBI depends on several factors, such as shock wave amplitude, duration of exposure, distance from the blast, etc.
The effect of shock waves on biomembranes can be enhanced by the collapse of bubbles present in the vicinity of these membranes26–31. Thus, ultrasound induced collapse of
microbubbles is found to be responsible for the permanent poration of cell membranes26,96–99 due
to the formation of a fluid jet as a result of a bubble collapse. Not only the collapse of
2 This chapter previously appeared as an article in the Journal of Physical Chemistry B. The original citation is as
30
microbubbles, but also of nanobubbles is considered to have a potential to produce substantial pores in a cell membrane due to a shock wave impact79,83,100. Although there was some debate
about the existence of nanobubbles in the past, recent research suggests their viability101–106.
Detailed information about the process of nanobubble collapse due to an impinging shock wave and the resulting damage to a biomembrane can be obtained from molecular simulations. Recently Choubey et al.79 observed in their all-atom molecular dynamics (MD) simulations a shock wave induced nanobubble collapse that formed a nanojet. This nanojet had a high velocity and moved toward the membrane, creating a nanopore in it, thus allowing permeation of water and other bigger molecules across the membrane. Our group also investigated recently83,100 the effect of shock wave induced collapse of a single and also multiple nanobubbles by using coarse-grained (CG) MD simulations. The results from our CG MD simulations were in a nice
agreement with the all-atom simulations performed by Choubey et al.79 Although, as we
observed, the pores often recovered, some lipids from membranes were expelled out of the bilayer, even forming micelles in some cases, depending on the shock velocities. Also, as we observed, the damage to the membrane depended on the size of the nanobubbles. For instance, the collapse of a nanobubble of a diameter D = 40 nm produced a bigger pore and it took a longer time for the membrane to recover, compared to the case when a nanobubble of a diameter D = 20 nm collapsed. We also studied the effect on the membrane when multiple nanobubbles,
31
The previous work that studied the effect of shock waves, but in the bubble absence, demonstrated that the peak pressure and the duration of the membrane exposure to the shock wave are major contributing factors that determine the degree of cell membrane damage. It was determined in that work that when the shock wave impinges on the membrane, it is the pressure impulse, rather than the peak value of the pressure, that is usually considered80,81,99. The impulse (I) is defined as the time integral over shock wave pressure profile:
𝐼 = ∫ 𝑃(𝑡) 𝑑𝑡 𝑡+
0
( (3.1) where P(t) is the shock wave pressure and t+ is the time duration of the positive phase of the shock wave80. It was also observed80,86 that when the impulse was above a certain value, the cell membrane as a whole became severely damaged, resulting in a cell death. In the presence of bubbles, a bubble collapse produces a nanojet that causes a localized damage to the membrane by creating small pores in it. Can an impulse, defined above, still be a measure of the possible damage produced by shock waves to membranes when a bubble is present? There are some other questions related to the understanding of a nanobubble collapse induced membrane poration that still require answers. For example, why a shock wave of certain impulse and shock velocity does not form a pore in the membrane, whereas a nanojet formed by a nanobubble collapse produces one? What are the major differences in the shock wave impact in the presence and absence of nanobubbles in the vicinity of the membrane?
32
shock waves hit nanobubbles next to lipid bilayers that model cell membranes. In our simulations nanobubbles (diameter D = 60 nm) are induced to collapse via shock wave
propagating toward the bilayer membrane. Different impulses of shock wave and various particle velocities are chosen to create various magnitudes of damage to the membrane. Pressure
distribution at the membrane position is calculated at various stages of shock wave simulation, both in the presence and absence of the nanobubble. Nanobubble with a diameter D = 20 nm is also considered for a comparison purpose. We observe that 2-dimensional pressure distributions obtained at the membrane position accurately reflect the difference between the shockwave impact in the presence and in the absence of nanobubbles. We also studied what happens when a nanobubble collapses without the presence of a shock wave and the effects observed in this case are compared with the effects produced in the presence of shock waves.
3.2 Methods
All computer simulations were performed using Gromacs 4.6.6 package,67,107–109 except that the pressure calculation was done using Gromacs-4.0.2_local pressure77 version of Gromacs. We described the interactions by the CG MARTINI22,110 force field, since it is widely and often
33
run was 30 fs, and Berendsen’s scheme68 was used to keep constant temperature and pressure.
The time constants for temperature and pressure couplings were equal to 0.3 and 3 ps
respectively, and compressibility was 3 × 10⁻⁵ bar. Nonbonded interactions were cut off at 1.2 nm using the shift scheme. The size of the system after equilibration was 101.1 × 103.4 × 137.5 nm in x, y and z directions, respectively, with the membrane positioned in parallel to the xy plane at z ≈ 90 nm.
Shock wave simulations were performed on this equilibrated system with added spherical nanobubbles that were created by removing water molecules from the inside of the bubble (i.e., actually creating a void). The shock waves were generated by using the momentum mirror protocol applied in this kind of simulations in the past79,111,112. In this protocol all particles move with velocity νp toward the mirror placed at the end of the box in the −z direction; they get
reflected upon impact, thus creating a shock wave moving with velocity greater than νp in the +z
direction. This procedure in effect is equivalent to having a massive piston moving toward the +z direction with velocity νp and reflecting all the particles coming in contact with it, thus creating a
shock wave. Periodic boundary conditions (PBC) were applied only in the x and y directions and not in the z direction. A 2 nm vacuum layer was added at the end of the system along the z direction, so that the particles would not overlap and collide with the mirror at the very beginning of the simulation. To mimic the propagation of smaller by value shock pulses, the piston was stopped after a short time and the shock wave formed was allowed to continue with its motion in the +z direction. Various piston stop times were chosen to create shock waves of various impulses. All shock simulations were performed in constant energy ensemble and the cutoff value for interactions was 1.4 nm instead of the usual 1.2 nm for better energy
34
in the shock simulations was 4 fs. The shock velocity was calculated by identifying the discontinuity in density along the +z direction. Pressure was calculated by using the method developed by Ollila et al.77 and was obtained by discretizing the system into small cubes of dimensions 0.5 nm. The time intervals reported here are actual simulation times and not the equivalent times often reported for simulations with MARTINI. Figures were created using the VMD program78.
For a given choice of a piston velocity or stoppage time, presence or absence of a bubble, we performed a number of simulations that differed from each other by a choice of the initial conditions. In all simulations with the same parameters, but different initial conditions, the results looked very similar and therefore we report here the results from one of each of the simulations of certain type. The types of the systems we discuss in this paper are summarized in Table 3.1
3.3 Results
As stated in the Methods, shock waves were created using the momentum mirror approach, a diagrammatic sketch of which is shown in Figure 3.1. Once the particles hit the piston with velocity νp (particle velocity), they are reflected and create a region of higher density
that moves with a higher velocity νs (shock wave velocity). After a short time (denoted by “τs”
35
the shock wave continues to propagate, both its intensity and velocity decrease. For
completeness and comparison of the density profiles of water when the shock wave propagates in the systems with and without the bubble we show in Figure 3.3 the 2-dimensional water density plots in the presence of the nanobubble. More details about these density plots and water jet properties when the bubble collapses, can be found in the previous work83. In this work we concentrate on the study of pressure profiles in the membrane region.
By stopping the piston at various times, shock waves with various impulses can be
created. Similarly, one can vary particle velocities to change the shock wave impulses. Below we report results from simulations using different values of νp, different τs and also different values
of the nanobubble diameter. To understand the role of the bubble we also simulated a system with no bubble present.
3.3.1 Shock Wave Simulations with Particle Velocity (νp) = 1.0 km/s
Here we discuss the results from simulations with νp = 1.0 km/s. To see how the piston
stop time influences these results, we performed simulations with τs = 3 ps, and 5 ps. Because the
shock wave is moving in the z-direction, we calculated the change of the normal pressure component, Pzz, and since we are interested in the properties of the membrane, we measured the pressure at the membrane position and studied it as a function of time.
3.3.1.1 (a)Simulations with τs = 3 ps
The change in average normal pressure across membrane surface (the pressure profile) for simulation with τs = 3 ps of a system without a bubble is shown in Figure 3.4. This pressure
36
very rapid decrease of pressure, which reaches a minimum at a negative value, and then the pressure rises again toward the normal pressure. The pressure value remains at 1 bar until the shock wave arrives. Upon the shock wave arrival, the pressure rises very sharply up to a value of 478 MPa (at ∼40 ps of the simulation time), then it gradually decreases, becoming negative and reaches the peak negative pressure value (−76 MPa) at ∼104 ps. As in the Friedlander curve, the pressure returns to normal, and in our simulation it happens at time ∼128 ps. Although the pressure peak value is very high, the duration of the shock impulse is very short and therefore the value of the impulse I from eq 3.1 in our simulation is only 8.96 mPa s. This value is much smaller than the experimentally measured80 value of an impulse of 54 Pa s, that caused only an uptake of calcein molecules into the cell, but not the cell death. Therefore, we should not expect that a major damage to the membrane occurs when a shock wave with an impulse of 8.96 mPa s hits a cell membrane. A two-dimensional diagram showing the pressure across the x and y axes of the membrane helps to understand how the distribution of normal pressure changes as the shock wave passes through the lipid bilayer, and this diagram is depicted in Figure 3.5. Notice that the average pressure calculated from the 2-d map at a certain time corresponds to a value of the pressure from Figure 3.4 at that particular time. For instance, the average pressure of Figure 3.5b is equal to 478 MPa corresponding to the value of pressure at point “b” in Figure 3.4. As we can see from Figure 3.5, for a system containing just water and the bilayer and exposed to a shock, the pressure is distributed homogeneously along the surface of the bilayer and the values of the pressure fluctuations are very small. Thus, as the shock arrives at the membrane, the entire bilayer is experiencing the same pressure with forces pointing in the same direction. The
37
a peak pressure of 478 MPa, the membrane remains intact. Although no pore formation was observed, the bilayer has undergone slight compression as the shock wave reached the membrane at 40 ps, but it returned to an original shape after the shock wave passed through, as can be seen from Figure 3.6.
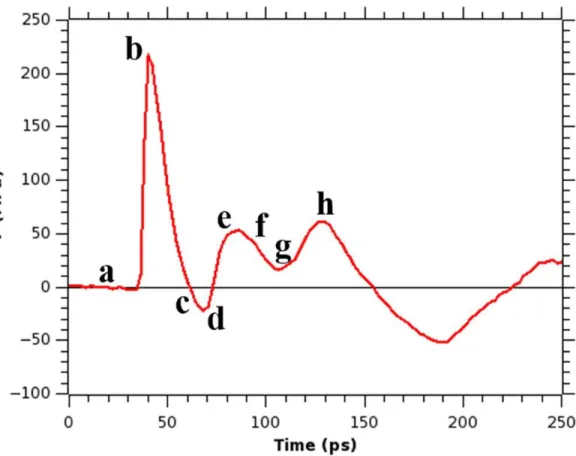
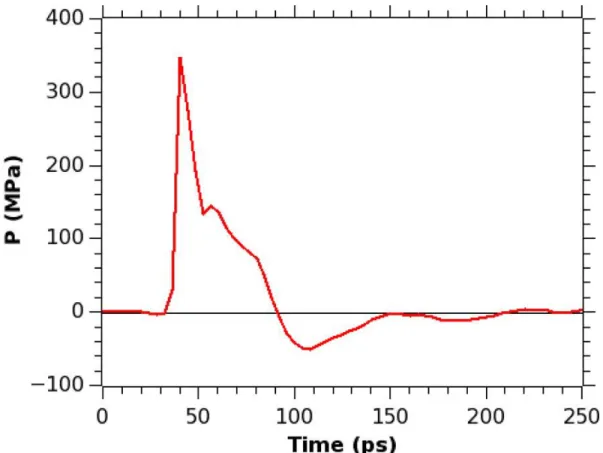
A completely different scenario is observed when a nanobubble is present in the vicinity of the membrane. In our simulations of systems containing a nanobubble with a diameter D = 60 nm, the bubble was placed at a distance about 3 nm away from the membrane and its center coincided with the membrane center in x and y directions. As the shock wave propagated toward the membrane, it initially impinged on the nanobubble and after some period of time hit the bilayer. The shock wave induced nanobubble collapse produced a nanojet of water particles moving with high velocity, and this nanojet moved in the same direction as the shock wave. The profile of the membrane pressure (for simulation with τs = 3 ps) in the presence of the
nanobubble is shown in Figure 3.7. Several differences can be seen between the profiles from Figure 3.4 (simulation without a bubble) and Figure 3.7 (simulation with a bubble). Although the shock wave hits the membrane at the same time (∼40 ps), the peak pressure (∼217 MPa) and the impulse due to the shock wave (2.52 mPa s) measured as an integral over pressure values in the first positive region in Figure 3.7 are smaller in the latter case. These smaller values are due to the presence of the bubble that hinders the shock wave propagation. Another clear difference in this pressure profile can be seen in the behavior of the pressure, after the shock wave pressure enters its negative phase. Unlike in the case of the bubble absence, after the shock wave entered its negative phase, the pressure started to rise toward high positive values reaching a value of
38
positive impulse and that the peak pressure initially had a smaller value in case when the
nanobubble was present, we observed that the collapse of a nanobubble resulted in a formation of a pore in the membrane.
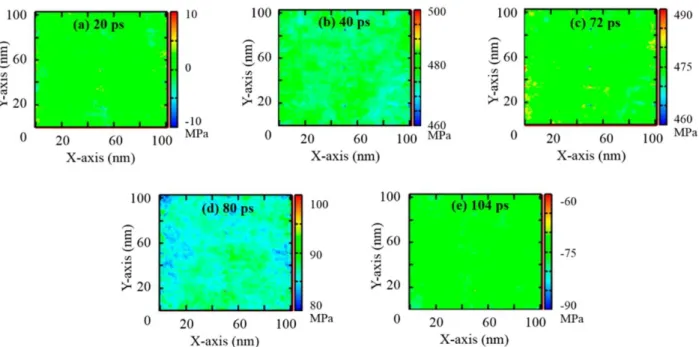
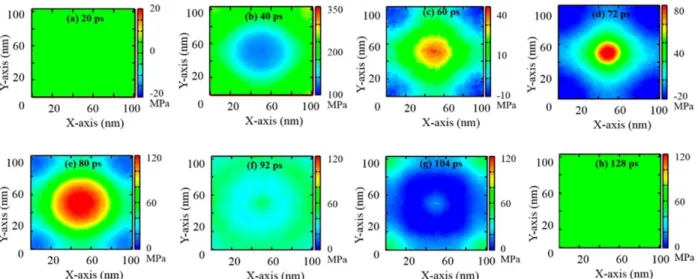
To understand why poration occurred we again looked at the distribution of the pressure on the membrane surface. Since the nanobubble is located next to the membrane center along x and y axes we expected to see a high pressure region at the center of the membrane after the nanobubble collapses into it. Indeed, the 2-dimensional pressure maps at various simulation times, shown in Figure 3.8, display an interesting pattern of pressure distribution along the x and y axes. Before the shock wave hits the membrane (Figure 3.8a), the pressure is close to 0 MPa,
39
it is responsible for the poration of the membrane, since it produces forces acting on the membrane in different directions. After the nanojet passes through, the pressures gradually decrease and their distribution becomes homogeneous again (Figure 3.8h). The snapshots of the membrane for this simulation are shown in Figure 3.9. We observe that as the difference in pressure values builds up at the membrane, the pore formation starts (∼80 ps, see Figure 3.9e) and a bigger pore can be observed at ∼128 ps of the simulation time (Figure 3.9h).
3.3.1.2 (b)τs = 5 ps
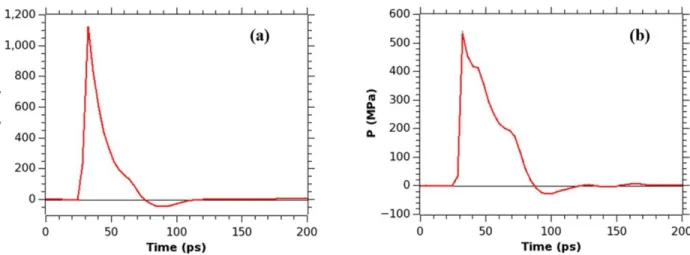
As expected, similar results are obtained when the piston is stopped after 5 ps of its motion, instead of 3 ps, but the effects of the shock wave impact are much more pronounced in this case. The pressure profiles at the membrane for τs = 5 ps are given in Figures 3.10a and
3.10b. Figure 3.10a represents the pressure profile for the system with no bubble. The shock wave hits the membrane at 32 ps, slightly earlier than in case when τs = 3 ps, and the peak
pressure reaches a value of 1126 MPa, which is more than twice the value of pressure reached in the simulation with τs = 3 ps. The positive phase impulse is 17.57 mPa s. The negative phase also
starts earlier, at about 78 ps. No pore formation is observed even when transferring this impulse. Just like in case of τs = 3 ps, the pressure distribution map shows an equal pressure distribution
along the x and y axes of the membrane. The pressure distribution maps and snapshots of the membrane at various simulation times are given in Figures 3.11 and 3.12.
40
observed due to shock wave and nanojet, in τs = 5 ps case the nanojet pressure peak hits almost
immediately after the shock wave has passed. This is not surprising given the velocity of the shock wave, so that nanojet moves much faster than in case with τs = 3 ps. The total positive
impulse is 14.93 mPa s and the peak pressure is 533 MPa. The pressure distribution map is similar to that of the map in case τs = 3 ps, but the difference in values for the higher (red at the
center) and lower (blue) pressure regions is much larger in this case. This bigger inequality in pressure results in the formation of a larger sized pore and more damage to the membrane. The 2-dimensional pressure maps and snapshots of the membrane at various simulation times are presented in Figures 3.13 and 3.14, respectively.
3.3.2 Shock Wave Simulations with Particle Velocity (νp) = 0.5 km/s
Two piston stopping times (τs = 5 and 10 ps) were chosen for the simulations with 0.5
km/s particle velocity. The pressure profiles obtained at these conditions are shown in Figure 3.15. As the particle velocity is smaller than in the previously described cases, the shock wave velocity also becomes smaller. Because of this reason the shock wave arrives at the membrane later and the peak pressure is smaller as well.
When τs = 5 ps, the shock wave arrives at the membrane at about 48 ps. The peak
pressure is just 71 MPa and the total positive impulse is 2.27 mPa s. These values are around five times smaller than in case when νp = 1.0 km/s. The pressure wave generated by the nanojet
41
km/s. But the unequal distribution of the high and the low pressure regions is substantially
smaller (maximum 30 MPa), and as a result no pore formation in the membrane occurs. If τs = 10
ps, the shock wave arrives at the membrane at 36 ps, slightly earlier than when τs = 5 ps. The
peak pressure rises up to 276 MPa and the total impulse is 5.49 mPa s. These values are close to the corresponding ones from simulations with νp = 1.0 km/s and τs = 3 ps. The normal pressure
distribution along x and y axis at the membrane and size of the pore formed also resemble that of νp = 1.0 km/s and τs = 3 ps (as shown in Table 3.1). The pressure maps and snapshots of the
membrane at various simulation times are provided in Figures 3.18 and 3.19, respectively. Thus, our simulations show that one can vary either the particle velocity or the time of the piston motion creating the shock wave to produce same result.
3.3.3 Shock Wave Simulations with a Smaller Nanobubble (Diameter, D = 20 nm)
A system having a smaller nanobubble (D = 20 nm) was also considered for the
comparison purposes. Particle velocities of 1.0 km/s, and τs = 3 ps were chosen in this case. The
42
distribution along the x and y axes of the membrane is similar to the distribution observed in case of the bigger bubble, as expected, but the impact of the nanojet pressure is focused on a smaller area of the membrane. This results in the formation of a smaller pore in the membrane. The 2-d pressure maps and snapshots of the membrane at various times are given in Figures 3.21 and 3.22.
3.3.4 Spontaneous Nanobubble Collapse (without Shock Wave)
The nanobubble can collapse spontaneously. If the surrounding is symmetrical, the bubble collapse will be also symmetrical, but if the bubble is located next to a membrane the collapse is asymmetrical and it may produce membrane damage. To see what happens during the spontaneous collapse of the nanobubble, we simulated a system containing a membrane and a nanobubble with D = 60 nm. The time step of 20 fs was used in these simulations. The results depended on the ensemble used. In case of the constant pressure and temperature (NPT)
43
observed. Thus, a spontaneous bubble collapse next to the membrane did not produce damage to membrane in the form of a pore.
3.4 Discussions and Summary
To understand the role of cavitation effect in the presence of nanobubbles, we performed simulations on systems containing model membranes and considered what happened when shock waves impinged on them, in absence or presence of the bubbles. As we observed, in the absence of a bubble a shock wave impulse of a rather small value of around 18 mPa s does not damage the membrane. We study cases with a small value of impulse, because we are interested in the possible damage to cell membranes produced during mild traumatic brain injury. We observed that the membrane was compressed for a short duration, but recovered within a short time. Our results are consistent with earlier simulations by Koshiyama et.al81 that did not see creation of pores in membranes, even when a shock wave had an impulse of 50 mPa s, but are in
contradiction with the conclusion from the recently reported in the literature simulation86 that an impulse bigger or equal to 0.45 mPa s damages the bilayer to an unrecoverable state. It should be noted that the system considered in that study was very small and a different methodology was applied for shock wave generation.
44
pressure impulse in the system with no bubble can be larger than in the system with a bubble? To understand this we calculated pressure distributions along the plane of the membrane and found them to be very informative. Pressure distribution maps revealed that when the shock wave passes over the membrane it creates a negative pressure region on the membrane surface. At the same time due to the bubble collapse a positive pressure region appears at the membrane center. For example, in the case when νp = 1.0 km/s, and τs = 3 ps, the difference between positive and
negative pressures is quite large, around 100 MPa. This unequal distribution of pressures causes a disbalance of stresses acting in different direction on the membrane, resulting in pore
formation. Since it is the pressure distribution that is responsible for the membrane damage, we cannot use the impulse delivered to the membrane (eq 3.1) as the quantitative parameter that is correlated to the degree of the membrane damage. One can consider the total impulse that includes the impulse after the first shock and the consequent impulse due to pressure rise after the jet reaches the membrane as a factor in measuring the disruption, but more work needs to be done to establish quantitative criteria that predict membrane damage.
We already mentioned that a choice of parameters τs and νp plays an important role. In
fact, the unequal distribution of pressure on the membrane becomes much more pronounced if the piston is stopped at 5 ps instead of 3 ps. When τs = 5 ps, the difference between the highest
and lowest pressures is larger than 300 MPa, three times the difference observed in case when τs
= 3 ps. When we reduced νp from 1.0 km/s to 0.5 km/s the maximum difference between the high
and low pressure regions was not larger than 40 MPa and we did not observe a pore formation in the membrane. Interestingly, when the piston was stopped at 10 ps, (but νp was still 0.5 km/s),
45