TRANSCRIPTOME-WIDE STUDY OF ALTERNATIVE SPLICING ACROSS MULTIPLE CANCER TYPES
Yi-hsuan Tsai
A dissertation submitted to the faculty at the University of North Carolina at Chapel Hill in particial fulfillment of the requirements for the degree of Doctor of Philosophy in the
Department of Bioinformatics and Computational Biology.
Chapel Hill 2015
Approved by Shawn M. Gomez, Scott M. Hammond, Alain Laederach, Jan Prins,
ii
iii
ABSTRACT
Yi-hsuan Tsai: Transcriptome-wide study of alternative splicing across multiple cancer types (Under the direction of Zefeng Wang and Shawn M. Gomez)
Alternative splicing (AS) is a very important cellular process in eukaryote, which contribute to both the proteome diversity and control of gene expression levels. It is tightly
regulated in different tissues and developmental stages and dysregulation of splicing can lead
iv
v
ACKNOWLEDGMENTS
This work would not have been possible without the support of my two awesome advisors, Zefeng Wang and Shawn Gomez. All the advice and guidance they have given me over the past years has been incredible. Both Zefeng and Shawn are brilliant scientists with keen insights. Their mentorship, knowledge has taught me how to think, how to ask research questions and how to conduct scientific research in my scientific and personal development. I really appreciate that they give me a lot of flexibility in my research and have always being supportive about my research projects, both financially and mentally.
I’m thankful for the past and present members of the Wang lab and Gomez lab for their support, encouragement and expertise: Yang Wang, Daniel Dominguez, Wenjing Zhang, Rajarshi Choudhury, Shuyun Dong, Russell Maxwell, HuanHuan Wei, Yun Yang, Miaowei Mao, Kyla Collins, Janet Doolittle, Matt Berginski, Alicia Midland, Kwangbom Choi, Jennifer Staab. Yang and Daniel have left the lab last year, but they have been there since I joined the lab. Although the collaboration with Daniel can sometimes be stressful, it gave me the chance to my first high-throughput sequencing data analysis which prepare me for the skills I need for the future. During the past years, those lunch time together, holiday parties and birthday celebrations, all have made my stressful working day (sometimes), more cheerful, and I thank them for the accompany.
vi
to Dr. Prins inviting me to their weekly RNA-seq meeting in computer science department. I have learned many techniques I need for my research there and learned how to see research questions from a different angle in those meeting.
Another collaborator I would like to thank to is Joel Parker, who has been really helpful in providing the TCGA data and answers to all the questions I have about the data. His special skills and knowledge in breast cancer have been a great help.
vii
TABLE OF CONTENTS
LIST OF TABLES ... xi
LIST OF FIGURES ... xii
LIST OF ABBREVIATIONS ... xiv
CHAPTER 1 ... 1
INTRODUCTION ... 1
1.1 Next-‐generation sequencing and RNA-‐seq ... 2
1.2 Alternative splicing and its regulation ... 3
1.3 RNA binding proteins and its role in splicing regulation ... 4
1.4 Splicing in cancers ... 6
CHAPTER 2 ... 9
IDENTIFICATION OF PREVALENT RNA RECOGNITION MOTIF DUPLICATION IN THE HUMAN GENOME. ... 9
2.1 Overview ... 9
2.2 Introduction ... 10
2.3 Results ... 12
viii
2.3.2 Sibling RRMs are more similar to each other ... 13
2.3.3 Sibling RRM pairs in species-‐specific RBPs are more similar to each other ... 16
2.3.4 Recent RRM duplication in DAZ proteins. ... 16
2.3.5 Ancient RRM duplications in PABPs ... 18
2.3.6 Similarity between sibling RRMs is associated with RBP functions ... 20
2.3.7 RRM-‐containing RBPs are enriched with repetitive motifs ... 22
2.4 Discussion ... 23
2.5 Materials and Methods ... 25
2.5.1 RNA binding proteins and RNA recognition motifs ... 25
2.5.2 Sequence similarity score calculation ... 26
2.5.3 Sequence composition and composition distance ... 26
2.5.4 RBP orthologs ... 27
2.5.5 Analyses of DAZ and PABP protein family ... 27
2.6 Supplementary Material ... 37
CHAPTER 3 ... 74
TRANSCRIPTOME-‐WIDE IDENTIFICATION AND STUDY OF CANCER-‐SPECIFIC SPLICING EVENTS ACROSS MULTIPLE TUMORS ... 74
3.1 Overview ... 74
3.2 Introduction ... 75
3.3 Results ... 77
3.3.1 Identification of cancer-‐specific AS events common to multiple cancers. ... 77
3.3.2 Consistent change of cancer-‐specific AS events across tumor types. ... 79
ix
3.3.4 Sequence characteristics of cancer-‐specific AS events. ... 81
3.3.5 Splicing of cancer-‐specific AS events are highly fluctuated. ... 82
3.3.6 Cancer-‐specific AS events as molecular biomarkers. ... 84
3.3.7 Ratio of different splicing variants can serve as predictor of cancer survival. ... 86
3.3.8 Possible regulators of cancer-‐specific AS. ... 87
3.3.9 Cancer-‐specific AS events common to 13 cancers ... 88
3.4 Discussion ... 90
3.5 Materials and Methods ... 93
3.5.1 Data acquisition and sequence processing. ... 93
3.5.2 Determination of AS events shared between cancer types. ... 93
3.5.3 Analyses of protein-‐protein-‐interaction among cancer-‐specific AS events. ... 94
3.5.4 Calculation of evolutionary score. ... 94
3.5.5 Motif enrichment analysis. ... 95
3.5.6 Principal Component analysis (PCA). ... 95
3.5.7 Survival analysis for breast cancer patients. ... 96
3.5.8 Correlation between gene expression and AS. ... 96
3.6 Supplementary Material ... 105
CHAPTER 4 ... 120
GLOBAL INTRON RETENTION IN HUMAN KIDNEY TUMORS CORRELATES WITH PATIENT SURVIVAL ... 120
4.1 Overview ... 120
4.2 Introduction ... 121
4.3 Results ... 122
x
4.3.2 Some kidney tumors express significant more retained introns than the others ... 123
4.3.3 High intron retention is not correlated with any known mutations, but correlated with a recently defined subclass in kidney cancer and expression levels of some genes ... 124
4.3.4 Intron retention in kidney cancer is highly correlated with patient survival ... 125
4.4 Discussion ... 127
4.5 Materials and Methods ... 128
4.5.1 Kidney tumor classification using retention score and splicing event correlation analysis ... 128
4.5.2 Motif enrichment analysis ... 129
4.5.3 Survival analysis for kidney, liver, lung and breast cancer patients. ... 129
CHAPTER 5 ... 135
CONCLUSIONS AND FUTURE DIRECTIONS ... 135
5.1 Work summary/Important findings ... 135
5.2 Weaknesses/limitations of the study and future direction ... 138
5.2.1 Weaknesses/limitations in chapter 2 and future works ... 138
5.2.2 Weaknesses/limitations in chapter 3 and future works ... 139
5.2.3 Weaknesses/limitations in chapter 4 and future works ... 140
BIBLIOGRAPHY ... 141
xi
LIST OF TABLES
Table 2.1 Number of proteins containing different RBDs in five species as reported from
Ensembl biomart 0n 07/09/13 ... 29
Table 3.1 Summary of cancer dataset ... 97
Table S 2.1 Detailed information of RRM-containing RBPs in human ... 44
Table S 2.2 RRM-containing RBPs unique to four species and their multiRRM scores ... 63
Table S 2.3 RRM-containing RBP orthologs in four species and their multiRRM scores ... 65
Table S 2.4 DAZ orthologs identified in different species (InParanoid and manual Blast) ... 71
Table S 3.1 162 Cancer-specific AS events and their average PSI values in three types of normal and tumor samples ...111
Table S 3.2 MCODE Cluster Results of corresponding proteins of cancer-specific AS ... 118
xii
LIST OF FIGURES
Figure 1.1 Schematic diagram of splicing regulation. ... 8
Figure 2.1 Elevated sequence similarity between sibling RRMs in human RBPs. ... 30
Figure 2.2 Sibling RRM pairs in species-specific proteins are more conserved. ... 32
Figure 2.3 An RBP family with recent RRM duplications. ... 33
Figure 2.4 An RBP family with ancient RRM duplications. ... 34
Figure 2.5 Gene Ontology analysis of human RBPs with multiple RRMs. ... 35
Figure 2.6 Sequence motifs enriched in the RRM-containing RBPs. ... 36
Figure 3.1 Identification of AS events altered in cancers. ... 98
Figure 3.2 Examples of cancer-specific AS events. ... 99
Figure 3.3 Molecular features of AS events changed in cancers. ... 100
Figure 3.4 PCA analysis using cancer-specific AS events. ... 101
Figure 3.5 Using cancer-specific AS events to separate breast cancer subtypes. ... 102
Figure 3.6 Genes associated with cancer-specific AS events. ... 103
Figure 3.7 Cancer-specific AS events among 13 cancer types. ... 104
Figure 4.1 Comparing AS variability among normal vs. tumor in KIRC and other cancers. ... 131
Figure 4.2 Intron retention is widespread in kidney cancers ... 132
Figure 4.3 Mutation profiles of kidney cancer in the two defined classes and genes up-regulated in the HIR class ...133
xiii
Figure S2.1 Increased numbers of RRMs within a single RBP in mammals. ... 37
Figure S2.2 The similarity scores of RRMs measured with different scoring matrices. ...38
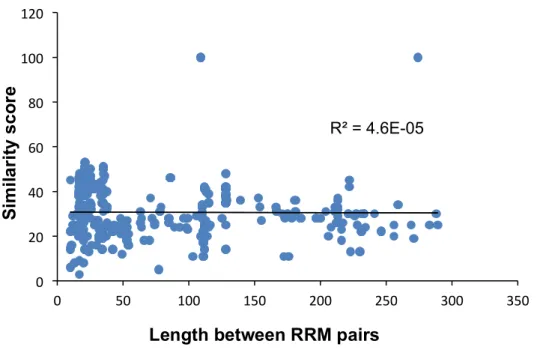
Figure S2.3 The lengths between sibling RRMs do not affect the similarity. ... 39
Figure S2.4 Similarity scores between RRM pairs in D. melanogaster RBPs and pairs of KH
domain in human RBPs. ... 40
Figure S2.5 Amino acid composition frequency and composition distance in real RRM-pairs. .. 41
Figure S 2.6 Sequence motifs enriched in human RBPs containing KH domain(s). ... 42
Figure S2.7 Sequence motifs enriched in human RBPs containing Zinc finger C2H2
domain(s). ... 43
Figure S 3.1 The percentage of genes change in both expression level and splicing and the
splicing isoform change in four AS modes. ... 105
Figure S 3.2 Gene ontology analysis of AS events altered in three cancer types: BRCA (A),
LIHC (b) and LUSC (C). ... 106
Figure S 3.3 Enriched motifs near cancer-specific skipped exons. ... 107 Figure S 3.4 Scatter plots of the standard deviation of PSI vs. mean of PSI. ... 108
Figure S 3.5. Histograms of the standard deviation of PSI for all AS events (top) or for 163
cancer-specific AS events (bottom). ... 109
xiv
LIST OF ABBREVIATIONS RNA – Ribonucleic acid
mRNA – messenger RNA AS – Alternative splicing
TCGA – The Cancer Genome Atlas
BPS – Branch Point Sequence
3’SS – 3’ Splice Site
5’SS – 5’ Splice Site
SRE – Splicing Regulatory Elementary
ESEs – Exonic Splicing Enhancers
ESSs – Exonic Splicing Silencers
ISEs – Intronic Splicing Enhancers
ISSs – Intronic Splicing Silencers
RBP – RNA Binding Protein RRM – RNA Recognition Motif KH – K Homology
PAZ – Piwi/Argonaute/Zwille RBD – RNA Binding Domains
hnRNP – Heterogeneous nuclear riboncleoprotein
SR – Serine-Argine
ELAV – embryonic lethal abnormal vision
CELF – CUG-BP and ETR-like factor
xv
PUF – Pumilio/FBF
CSD – Cold-Shock Domain nt – nucleotides
DAZL – DAZ like
PABPs – Polyadenylate-Binding Proteins UTR – UnTranslated Regions
GO – Gene Ontology PSI – Percent Spliced In MISO – Mixture of isoforms
BRCA – BReast invasive CArcinoma LUSC – LUng Squamous cell Carcinoma LIHC – LIver Hepatocellular Carcinoma SE – Skipped Exon
RI – Retained Intron
A3SS – Alternative 3’ Splice Site A5SS – Alternative 5’ Splice Site NMD – Nonsense Mediated Decay PCA – Principal Component Analysis WBP1 – WW domain binding protein 1 BLCA – Bladder Urothelial Carcinoma COAD – Colon adenocarcinoma
xvi
KIRC – Kidney renal clear cell carcinoma KIRP – Kidney renal papillary cell carcinoma LUAD – Lung adenocarcinoma
PRAD – Prostate adenocarcinoma THCA – Thyroid carcinoma
UCEC – Uterine Corpus Endometrial Carcinoma PPI – Protein Protein Interaction
ccRCC – clear-cell renal carcinoma IR – Intron Retention
lncRNA – long non-coding RNA HIR – High Intron Retention NIR – Normal Intron Retention
1
CHAPTER 1
INTRODUCTION
With the very first draft of the human genome announced in 2000 [1, 2], and the following full completion in 2003, people have once believed that the human genetic blueprint, such a big progress in biology, will bring us to the next era of medicine. Decoding of the human genomic sequences indeed took us to the next level of biological research. Hypothesis-driven science has been largely replaced by discovery-driven research because of the large amount of data. However, this is just the beginning of post-genomic revolution. Although we have all the sequence code for building a human being, there are still lots of unknown. What regions are coded for functional genes, what sequences contain regulatory elements and what else are just merely random noises. Genome annotation has progressed very slowly after the completion of human genome. After more than a decade, people are still debating about what percentage of the human genome is actually doing something important. To our surprise, only less than 2 percent of the human genome contains protein-coding sequences. Even when counting the regulatory sequences, the fraction of functional DNA is estimated less than 10-20% [3, 4].
2
1.1 Next-generation sequencing and RNA-seq
The next revolution occurred when the ‘second-generation’ (or next-generation) sequencing was developed. The new high-throughput sequencing technology allows us to sequence DNA/RNA much more quickly and with much lower cost. According to National Human Genome Research Institute’s report, the cost of sequencing a genome was more than 10M in early 2000 and it has dropped to below 10K in around 2011 [5]. Such a dramatically drop in price has outpaced Moore’s law since early 2008 when the next-generation sequencing technology took the place of the Sanger-based sequencing [5]. Because of the low cost, sequence data has been generated in a way that we cannot imagine and cannot finish analyzing them in time. Large consortium, such as ENCODE [6], 1000 genomes [7], and TCGA [8] all have accumulated large amount of data, and most of the data are public accessible. Even though some of these sequence data have been released for a while, we can still see new publications using the data every month. There are still a lot of treasures within these sequencing data waiting for us to discover.
3
different tissues and different developmental stages, not only qualitatively but also quantitatively.
1.2 Alternative splicing and its regulation
Since human transcriptome has been deeply sequenced, it’s been shown that more than
90% of human genes undergo alternative splicing (AS) process to produce more than one
splicing isoforms containing different combinations of exons [10, 11]. This important cellular
process can control the expression level of genes and contribute to the diversity of proteome.
Through AS, same gene can have protein isoforms with totally different functions. For example,
the Fas receptor gene has one soluble and one membrane-bound isoforms with opposing effects
on apoptosis [12]. Another example is the Drosophila fruitless (fru) gene, which is spliced
differently in males and females to control its sexual orientation [13]. Splicing process is also
tightly regulated in different tissues and developmental stages [10, 11], and dysregulation of AS
is closely associated with various human diseases [14, 15].
The specificity of splicing is mainly determined by the core splicing signals including the
5’ or 3’ splice site (i.e. 5’ss or 3’ss) at each end of an intron and the branch point sequence (BPS)
at the upstream of 3’ss. However, the core splice site motifs contain only about half of the
information required to precisely define exon/intron boundaries [16]. In addition to these core
splicing signals, splicing is regulated by multiple splicing regulatory elements (SREs) that
specifically recruit trans-acting splicing factors to activate or repress the use of adjacent splice
sites [17]. There are four types of SRE, two in the exonic region: exonic splicing enhancers
(ESEs) or silencers (ESSs) that function to promote or inhibit inclusion of the exon they reside
4
enhance or inhibit usage of adjacent splice sites or exons (Figure. 1.1) [18]. It is known that the
activities of SREs may depend on the relative locations of the elements in pre-mRNAs, e.g.
G-triplets could act as an ISE when it’s located in intronic locations, but also function as an ESS
when located in exons [19]. This is commonly known as “context dependence” of SREs. Same
effects also apply to splicing factors: the same splicing factor may either activate or inhibit
splicing by binding to its cognate SREs in different pre-mRNA regions [18, 20, 21]. More details
of splicing regulation can be found in some recent reviews [17, 22-25].
1.3 RNA binding proteins and its role in splicing regulation
Many RNA-binding proteins (RBPs) facilitate splicesome assembly on pre-mRNA during splicing process. In addition to RNA splicing, specific interactions between RBPs and RNAs also play essential roles in many other mRNA metabolism, including RNA editing, translocation, and degradation [26]. Altering the expression of RBPs can have dramatic impact on in various RNA-related cellular functions, and aberrant RBP function can also lead to a wide range of human diseases including cancer [27] and neurodegenerative diseases [28, 29].
5
required for target binding. Previous study has shown that multicellular organisms have more RBPs than single cell organisms and the number of RBD within a RBP has expanded significantly in mammal as well [32]. However, the mechanism by which the number of RBPs and RBDs increase during evolution and the functional implication of such expansion remain unclear.
One of the most important cellular process RBPs regulate is AS which is the main subject
of this study. Some RBPs that regulate splicing have been identified, however, many of them
have different functions when binding to different sequence targets [18, 23], which makes the
splicing regulation more complicated. For example, the CUGBP2 splicing factor can promote the
inclusion of cTNT exon 5 via biding to its downstream intron region, while in the brain, it can
silence the N1 exon of the NMDA R1 receptor through binding to its upstream intron region [33,
34]. Some of the splicing regulation proteins can compete with each other for the binding sites.
For example, in HIV tat exon 3, both hnRNPA1 and SF2 can bind to the exon to inhibit or to
enhance the splicing respectively [35]. A1 binds to an ESS to repress the splicing but the SF2 can
also bind to the ESEs located in the same exon to promote the splicing. When SF2 presents, it
blocks the A1 repression and allow the exon inclusion. Another example is the regulation of
exon 11 of the insulin receptor gene, where hnRNP F and SRSF1 compete with the hnRNP A1
for the binding site to promote or inhibit exon 11 inclusion [36]. Some of the splicing regulation
proteins are dosage depend. For example, the relative ratio of A1 to ASF/SF2 can regulate
splicing patterns differently [37] [38].
Although it’s believed that many more proteins can regulate RNA splicing, the four
major groups of known splicing regulators are: the heterogeneous nuclear riboncleoprotein
6
and CUG-BP and ETR-like factor (CELF) proteins [39]. Review of these proteins can be found
in [40-43].
1.4 Splicing in cancers
The mis-regulation of splicing is a common cause of various human diseases including cancer. Hundreds of genes are mis-spliced in a typical cancer cell, and many cancer-specific splicing isoforms play key roles in pathogenesis and growth of tumors. For example, in glioblastoma, a tumor-specific α-exon skipping isoform, FDFR1β is overexpressed in the tumor cells and the overexpression is regulated by the increase in expression of a splicing inhibitory, PTB (hnRNPI) [44]. As one of the molecular hallmarks of human cancer, the splicing mis-regulation is thought to be controlled by the changes of expression levels and/or activity of certain splicing factors. Several splicing factors, including SRSF1 and hnRNP A2, were found to act as a proto-oncogene to induce malignant transformation of normal cells [45-47], while other splicing factors, such as RBM5 [48] and RBM4 [49], can serve as tumor suppressor genes to inhibit cancer growth. Therefore the relationship between splicing factors and the cancer-specific splicing profile is a very important research subject.
7
It has been shown that the changes of alternative splicing can be used as a powerful biomarker to diagnose cancer or to predict the response to therapy [51, 52]. In the past, several studies were designed to perturb each splicing factor and further determine how an individual splicing factor affected splicing of specific genes or entire transcriptome. However the TCGA consortium presented a unique dataset that mimic the perturbance of various splicing factors at same time in a large number of clinical samples. Therefore we can study the splicing regulation in cancer by measuring the correlation of splicing changes with levels of all known and putative splicing factors across all samples. Through investigating the correlation between splicing and gene expression, we aim to identify key splicing factors that responsible for the splicing mis-regulation in cancers. Furthermore, these findings can provide novel anti-cancer therapeutic targets based on the cancer specific RNA-RBP interactions.
8
Figure 1.1 Schematic diagram of splicing regulation.
9
CHAPTER 2
IDENTIFICATION OF PREVALENT RNA RECOGNITION MOTIF DUPLICATION IN THE HUMAN GENOME.1
2.1 Overview
The sequence-specific recognition of RNA by proteins is mediated through various RNA binding domains, with the RNA recognition motif (RRM) being the most frequent and present in >50% of RNA-binding proteins (RBPs). Many RBPs contain multiple RRMs, and it is unclear how each RRM contributes to the binding specificity of the entire protein. We found that RRMs within the same RBP (i.e., sibling RRMs) tend to have significantly higher similarity than expected by chance. Sibling RRM pairs from RBPs shared by multiple species tend to have lower similarity than those found only in a single species, suggesting that multiple RRMs within the same protein might arise from domain duplication followed by divergence through random mutations. This finding is exemplified by a recent RRM domain duplication in DAZ proteins and an ancient duplication in PABP proteins. Additionally, we found that different similarities between sibling RRMs are associated with distinct functions of an RBP and that the RBPs tend to contain repetitive sequences with low complexity. Taken together, this study suggests that the
1
This chapter previously appeared as an article in the Journal of RNA. The original citation is as
10
number of RBPs with multiple RRMs has expanded in mammals and that the multiple sibling RRMs may recognize similar target motifs in a cooperative manner.
2.2 Introduction
Specific interactions between RNAs and proteins play an essential role in regulating mRNA processing, including RNA splicing, polyadenylation, translocation, and degradation [26]. Altering the level or activity of RNA-binding proteins (RBPs) has a dramatic impact on various RNA-related cellular functions, with aberrant RBP function leading to human diseases [27]. For example, many RBPs specifically recognize regulatory cis-elements in pre-mRNA and thereby inhibit or promote use of nearby splicing sites [17, 18]. The binding between these splicing factors and their RNA target is crucial to many cellular processes, as most human genes undergo alternative splicing to produce multiple isoforms with distinct functions. Therefore, examining the interactions between different RBPs and their RNA targets is an important component in understanding various gene regulation pathways.
The sequence-specific interaction between RBPs and single-stranded RNAs is usually mediated through various RNA binding domains (RBDs) including the RNA recognition motif (RRM), the pentatricopeptide repeat (PPR), the K homology (KH), the zinc-finger, the Pumilio/FBF (PUF), and the cold-shock (CSD) domains [53]. Although protein sequence elements outside of the RBD may contact RNA and affect RNA binding [54, 55], the RBD is the key determinant of RNA binding specificity [56]. Among them, the RRM is the most abundant and present in over 50% of RBPs in humans [31]. A typical RRM contains 80–90 aa that fold into a β1α1β2β3α2β4 topology, where the four anti-parallel β-sheets and the two additional α
11
RRM consists of two short sites (6–8 aa) in β1 and β3 (named RNP-2 and RNP-1, respectively) that are crucial for RNA interaction [57-59]. However, recent structures of various RRMs bound by their cognate RNA show that RRMs may interact with RNA through diverse mechanisms [60-62]. For example, hnRNP I (poly-pyrimidine tract binding protein or PTB) has four RRMs with similar specificities. The β3 of each RRM contributes only weakly to RNA binding, whereas the hydrophobic side chains in β2 are responsible for binding to RNA bases through hydrophobic interactions [60]. In other cases, like hnRNP F, interactions between the RNA target and the RRM were found mainly in the loop region rather than in the β-sheet of the RRM [63, 64].
RRMs usually recognize a short RNA element of 2–5 nt (nucleotide), and some RBPs contain multiple RRMs. The tandem RRMs in the same RBP can either bind to similar RNA sequences and function cooperatively [62, 64] or have very different RNA binding activities/specificities [65], or only one/some of the RRMs are functional while the others do not exhibit RNA binding [66]. Therefore, for RBPs with multiple RRMs, the general rules for how each RRM contributes to binding specificity are largely unclear.
12
sequence regions outside RRMs have a strong bias for low complexity and/or repetitive sequences. Altogether, these analyses reveal important implications regarding RBP evolution.
2.3 Results
2.3.1 Increased numbers of RBPs in mammals.
13
2.3.2 Sibling RRMs are more similar to each other
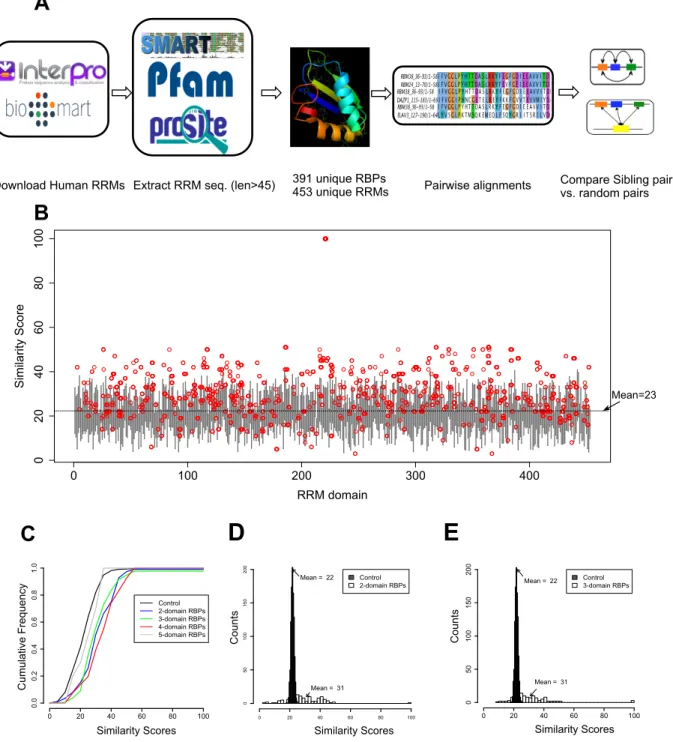
To study these questions, we analyzed RRM-containing RBPs at a proteome-wide scale across multiple species. We applied a series of filters to obtain unique human RBPs that have well-defined RRM domains and extracted the sequence of each RRM using the consensus annotation from three domain annotation databases (Figure 2.1A). This process was repeated for three other species (Mus musculus, Drosophila melanogaster, Caenorhabditis elegans), and both the species-specific and conserved RBPs were extracted by the same set of filters for further analyses (see Materials and Methods). After filtering for gene duplication and database redundancy, we extracted 453 unique RRMs from human RBPs.
14
similarity is not limited to a single species, as the same results were obtained when we analyzed the sibling RRMs in the D. melanogaster genome (Supplemental Figure S2.4A). In addition to RRM, we also analyzed KH and C2H2 zinc finger domains, both of which are commonly found in human RBPs. While comparing the similarity scores of sibling domain pairs to those of all other pairs (i.e., nonsibling pairs), we again found a higher sequence similarity in sibling pairs in both sibling KH and zinc finger domains (Supplemental Figure S2.4B), suggesting the increased similarity between sibling RNA binding domains is a common feature for different types of RBPs.
There is a possibility that some proteins are under a global selection to preserve certain sequence bias, resulting in the increased sequence similarity between sibling RRM pairs within a single protein compared to random pairs. To measure the potential sequence bias, we calculated the average frequency of each amino acid in RRMs for different RBP groups with 2, 3, 4, and 5 RRM domains (Supplemental Figure S2.5A). These groups include 112 proteins with two RRMs (112 sibling pairs), 44 proteins with three RRMs (132 sibling pairs), 11 proteins with four RRMs (66 sibling pairs), and one protein with five RRMs (10 sibling pairs). Overall, we found that the RRMs from different groups or within the same group have similar sequence composition. Five out of 20 aa have significant differences in mean of frequency between groups as judged by the ANOVA F-statistic (P-value < 0.01). Nevertheless, to better control the subtle sequence bias, we generated control groups of RRM pairs with matched composition distance to the real sibling RRM pairs for the rest of our analyses (see Materials and Methods section for details and Supplemental Figure S2.5B).
15
compared to a control set of 1000 randomly selected RRM pairings, we found that the different sets of RBPs all have higher similarity between their sibling RRMs than the randomly chosen RRM controls (except the 5-domain RBP set that contains a single member), as judged by the right shifts of plots (P = 6.3 × 10⁻¹³, 4 × 10⁻¹², 2.2 × 10⁻¹⁴, and 0.8 for control vs. 2-, 3-, 4-, and 5-domain RBPs, respectively, by the Kolmogorov–Smirnov test) (Figure 2.1C). This result suggests that the higher similarity between sibling RRMs (Figure 2.1B) is a common property for all RBPs with different numbers of RRMs.
16
2.3.3 Sibling RRM pairs in species-specific RBPs are more similar to each other
We further examined the sequence conservation of sibling RRM pairs from different species whose proteomes are well annotated. For each of four species (human, mouse, fruit fly, and worm), we selected the RBPs shared among all species and the RBPs found only in one species (see Materials and Methods) and compared the similarity between sibling RRMs within the same protein. We found that, in all species except worms, the similarity between sibling RRMs is significantly higher in the species-specific RBPs as compared to that of sibling RRMs in RBPs shared across all four species. Generally, genes conserved across multiple species are more ancient, as they appeared before speciation, whereas genes unique to certain species are more recently evolved. According to this simple assumption, our finding suggests that the RRM sibling pairs in “younger” (i.e., species-specific) proteins have higher sequence similarities than those in “older” proteins (i.e., conserved across distant species). A simple explanation is again that most sibling RRMs arose from domain duplication during evolution, which was then followed by sequence drift in each species through random mutations. The sibling RRMs in older proteins resulted from more ancient duplication and, therefore, would be expected to have higher sequence divergence. In particular, such increased similarity was more obvious between the sibling RRMs specific to human and mouse (Figure 2.2A,B), suggesting an extensive RRM duplication in mammals. We are aware that our explanation is based on a usual assumption in gene evolution; however, there is an alternative but less likely scenario that the unique genes could have existed in the commonancestor but were subsequently lost in all species except one.
2.3.4 Recent RRM duplication in DAZ proteins.
17
proteins (i.e., completely identical). The DAZ proteins have four paralogs on the Y chromosome: DAZ1 (3 RRMs), DAZ2 (1 RRM), DAZ3 (1 RRM), and DAZ4 (2 RRMs); one paralog on chromosome 3: DAZL (DAZ like) (1 RRM), and one on chromosome 2: BOLL (1 RRM) (Figure 2.3A). Among these six proteins, the RRMs in four DAZ proteins and DAZL are completely identical, whereas the RRM in BOLL has 53% identity with the others. Previous sequence analyses suggests that at least two gene duplication events were required to generate this protein family: The first duplication gave rise to DAZL and BOLL, which was followed by a second duplication of DAZL to generate Y chromosome-specific DAZ proteins [68-70]. The second duplication could either be a single duplication that generated four DAZ proteins, or alternatively, several sequential duplications that happened within a short time window so as to produce four proteins.
18
proteins with multiple RRMs were detected in macaque but not gorilla. Alternatively, assembly errors in this repetitive region of the Y chromosome could also prevent the detection of DAZ proteins with multiple RRMs in gorilla.
To examine their evolution over a more recent time frame, we further determined the SNP density within the DAZ protein family (Figure 2.3B). We calculated the SNP density (number of SNPs/gene length) for each DAZ gene, as well as the average SNP density of 100 genes randomly selected from the same chromosome (gray bars). The SNP density of BOLL is similar to that of other genes randomly selected from chromosome 2, while the SNP density of DAZL is slightly lower than that of the randomly selected genes on chromosome 3. However, the SNP densities of the four DAZ genes are two orders of magnitude less than the densities of other randomly selected genes on the Y chromosome. Since the majority of gene variation observed in a population is due to random drift of neutral (or nearly neutral) mutations, as proposed by the neutral theory of molecular evolution [71], the SNP density is correlated with the functional importance and evolution time of the gene [72]. Our observation of SNP densities is consistent with the hypothesis that there has been at least one very recent RRM domain duplication event that generated DAZ1 with multiple RRMs.
2.3.5 Ancient RRM duplications in PABPs
19
PAP1M contains two RRMs (Figure 2.4A). The family of PABP proteins in other species (M. musculus, D. melanogaster, C. elegans, and Schizosaccharomyces pombe) contains members
20
These two specific examples in DAZ and PABP families represent both a recent and an ancient RRM duplication, strongly supporting our finding in analyzing all sibling RRMs (Figure 2.1B). Taken together, our results suggest a model wherein RRM duplication has happened frequently during evolution, followed by random evolutionary drift that introduces additional sequence variation. This simple model is consistent with the finding that the number of proteins with multiple RRMs has expanded in humans and other mammals (Supplemental Figure S2.1).
2.3.6 Similarity between sibling RRMs is associated with RBP functions
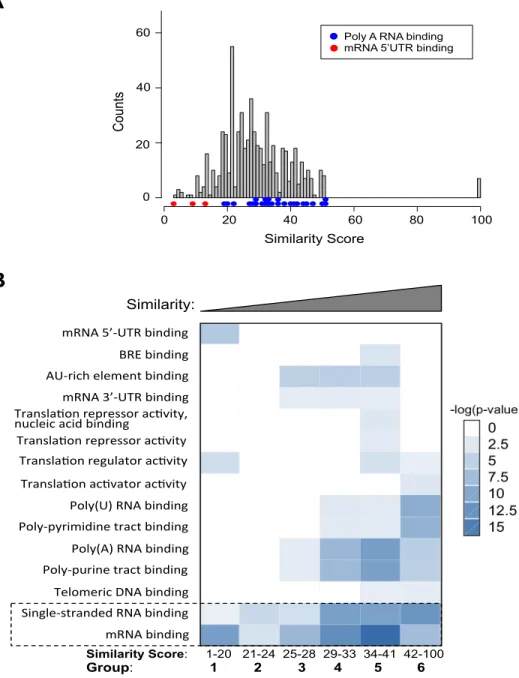
In addition to the time since duplication, other features might also contribute to the similarities between sibling RRMs. For example, evolutionary constraints can also affect how fast the sequence drifts through random mutations after domain duplication. To study if the similarities between sibling RRMs are associated with certain functional preferences of RBPs, we conducted a survey of functional differences in the RBPs with multiple RRMs. We observed a general trend that the proteins that bind to polyadenylated RNA in the 3′ UTR tend to have more similar sibling RRM pairs, whereas the proteins that bind to the 5′ UTR tend to have dissimilar sibling RRMs (Figure 2.5A), suggesting there may be some association between the similarity of sibling RRM and the RBP function.
To further study this potential relationship, we conducted a gene ontology analysis on all human RBPs having multiple RRMs. According to the similarity scores between each RRM pair, we divided all pairs into six groups, each containing ∼100 RRM pairs. The corresponding
21
control. Consistent with the earlier observation, we also found a significant enrichment of “mRNA 5′-UTR binding” (P = 1.8 × 10⁻⁵, fold enrichment = 406) in proteins with dissimilar sibling RRMs (group 1: similarity score = 1–20). In contrast, enrichment of “polyadenylated RNA binding” (P = 5.1 × 10⁻⁵, fold enrichment = 256) occurred in proteins having sibling RRM pairs with the highest similarity (group 6: similarity score = 42–100). In addition, the RBPs with similar sibling RRMs were also found to be enriched in poly(U) RNA binding, poly-pyrimidine track binding, and poly-purine track binding, suggesting that these RRMs are more likely to bind repetitive RNA elements (groups 4–6) (Figure 2.5B). This finding is consistent with the notion
that the requirement of binding to repetitive targets may impose additional selective pressure on these RBPs after RRM duplication. Individual RRMs are known to specifically recognize short sequences (usually 2–5 nt), and thus, RBPs with similar sibling RRMs could be expected to facilitate the binding to longer RNA targets containing repetitive elements.
Compared to other regions of mRNA, the 5′-UTR region usually contains binding sites for factors that affect the translation efficiency of mRNA [75]. On the other hand, the 3′ UTR usually contains more repetitive sequences used to control RNA stability (e.g., AU-rich elements) [76, 77]. As expected, the RBPs with dissimilar sibling RRMs (group 1) are enriched only in 5′-UTR binding and translation regulation (Figure 2.5B). Conversely, proteins with similar sibling RRMs have a small bias toward binding to the 3′ UTR. Recently, a comprehensive identification of the binding motifs for RBPs suggested that the RBDs with higher protein similarity are more likely to bind to similar RNA motifs [53]. Our data raise an interesting prediction that mRNA metabolism is controlled by more diverse elements in the 5′
22
be examined.
2.3.7 RRM-containing RBPs are enriched with repetitive motifs
23
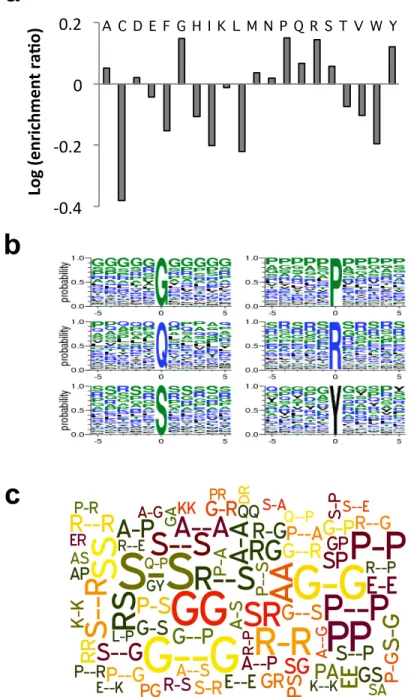
found the RS di-peptide repeats were only found in RRM-containing proteins, whereas the poly-S was found to be enriched in RBPs with the KH and zinc finger C2H2 domain (cf. Figure 2.6B and Supplemental Figures S2.6B, S2.7B).
2.4 Discussion
Proteins that specifically bind to single-stranded RNA play critical roles in regulating various RNA processing pathways; thus a detailed sequence analysis of these RBPs will provide key insights into gene regulation at the RNA level. This study suggests extensive domain duplications of RRM. Such duplications are probably followed by random evolutionary drift that introduces additional sequence variation, leading to the observed higher degree of sequence divergence in old proteins with ancient RRM duplications (Figures 2.2, 2.4). This domain duplication may play a significant role in the function of RBPs. One possible consequence could be that multiple RRMs allow a protein to bind RNA with higher sequence specificity and/or affinity than those RBPs with a single binding domain. Another consequence could be that multiple RRM domains may help RBPs to bind to longer RNA sequences. Typically a single RRM recognizes 2–5 nt; thus tandem RRMs may provide some selective advantage to increase binding specificity and bind to longer RNA targets. Consistent with this notion, the sibling RRMs in several RBPs, for example, PTB [60], were found to recognize similar RNA motifs. The domain duplication of RRMs might provide a possible explanation of why the RRM-containing proteins are so abundant in the human genome.
24
complexity of RNA processing pathways in mammals. For example, the majority of human genes undergo alternative splicing, and a predominant fraction of splicing factors are RBPs with multiple RRM domains. In fact, we observed that the RBPs with different similarities in their sibling RRMs are functionally separated from each other (Figure 2.5). The proteins with very similar sibling RRMs tend to bind the 3′ end of mRNA and might function in RNA polyadenylation, whereas the RBPs with more divergent sibling RRMs tend to bind the 5′ UTR of mRNA and might affect the RNA translation. We speculate that RRM duplication, together with their diverging RNA binding targets in the transcriptome, allows the mutual selection in RNA–protein interaction and eventually leads to the functional divergence of RBPs.
We also found that, compared to all other human proteins, the RRM-containing RBPs are more likely to have repetitive sequences in the regions outside the RRMs. These repetitive sequences frequently mediate protein–protein interactions, as RBPs with low-complexity domains tend to aggregate to form protein fibers [79]. The association of RRM-containing proteins with repetitive sequences (encoded by low complexity DNAs) raises an interesting possibility that these sequences may provide a mechanism for domain duplication, as the repetitive DNA sequences are less stable during replication and tend to cause local DNA duplication/expansions [80, 81]. Alternatively, such repetitive sequences could be a result of RRM duplication that is caused by local DNA duplication; however, the RBPs with a single RRM also contain low-complexity sequences. Nevertheless, the mechanism of domain duplication is an interesting question emerging from our study.
25
within these proteins are more similar to each other than what would be predicted by controls (Figure 2.1). In addition, the sibling RRM pairs are more similar to each other in the species-specific RBPs when compared to the ancient RBPs shared by multiple species, suggesting a general RRM duplication in many genes of the mammalian genome. Such domain duplication is further supported by two extreme examples: In the case of the DAZ protein family, a very recent RRM duplication appears to have happened in humans and several primate species, generating multiple RBPs containing identical sibling RRMs (Figure 2.3). In another case, the RRM duplications within the PABP proteins probably happened in the common ancestor of all eukaryotes, as similar duplication was found from yeast to human (Figure 2.4). Taken together, these results suggested a new and simple model wherein RRM duplication happened frequently during evolution, resulting in increased numbers of RBPs with multiple RRMs.
2.5 Materials and Methods
2.5.1 RNA binding proteins and RNA recognition motifs
26
analysis (Supplemental Tables S2.2, S2.3). Other protein attributes, such as Gene Ontology (GO), Gene Orthologs, and Gene IDs, used in other databases, were downloaded from Ensembl Biomart (www.ensembl.org/biomart/martview). Because protein IDs are not standardized between or even within some databases, we performed a protein ID conversion as well as manual curation to combine our data sources.
2.5.2 Sequence similarity score calculation
ClustalW2 was used to compute all the pairwise alignment scores for every RRM pair. The similarity score was calculated by calibrating the number of identities between the two sequences with the length of alignment, and it is represented as a percentage, i.e., 0–100. The default protein weight matrix (Gonnet 250) was used for all the pairwise alignments in the main text. However, we also compared the similarity scores generated by using Gonnet 250 with BLOSUM30 (Supplemental Figure S2.2A) and PAM350 (Supplemental Figure S2.2B). We also repeated Figure 2.1B by using BLOSUM 30 as the weight matrix and obtained similar results (Supplemental Figure S2.2C).
2.5.3 Sequence composition and composition distance
We calculated the sequence composition as the frequency of the 20 amino acids in each RRM sequence. Therefore, a sequence composition for an RRM is a vector with 20 dimensions. To measure the similarity of sequence compositions between two RRMs, we used the city block distance between two vectors (i.e., sum of the frequency difference of each amino acid). We named such measurement the “composition distance,” which ranges from 0 to 2.
27
control RRM pairs were randomly picked from all RRM pairs with composition distances within the 0.37–0.60 range (i.e., mean ± 1 SD of the composition distance from real sibling pairs) (see Supplemental Figure S2.5B). In Figure 2.1, D and E, all control RRM-pairs have a composition distance within 0.41–0.62 and 0.34–0.57, respectively.
2.5.4 RBP orthologs
H. sapiens, M. musculus, D. melanogaster, and C. elegans ortholog data were
downloaded from the inparanoid database (http://inparanoid.sbc.su.se/download/current/ sqltables/) [82]. We downloaded six files, each containing orthologs between two species. We combined all the files and gathered more than 3000 proteins with orthologs found in all four species and thousands of species-specific proteins. These protein sequences were submitted to Pfam for domain analysis with an E-value cutoff of 0.1 (http://pfam.sanger.ac.uk/search#tabview =tab1). Only proteins with more than one predicted RRM were used to calculate the sequence similarity scores. Among the >3000 orthologs between the four species, 80 are RNA-binding proteins, among which 41 human RBPs, 41 mouse RBPs, 34 fly RBPs and 33 worm RBPs contain more than one RRM. We then extracted RBPs that are unique to the individual species and obtained 9, 12, 19, and 12 species-specific RBPs for human, mouse, fly, and worm, respectively. For the sequence similarity score calculation, the sequence pair of RRM from the same RBP were aligned to each other using ClustaW2. All proteins used are listed in Supplementary Tables S2.2 and S2.3. The location of the RRM sequence and the sequence similarity score were also included in the table.
2.5.5 Analyses of DAZ and PABP protein family
28
(http://inparanoid.sbc.su.se/download/8.0_current/Orthologs/). Six species were examined: chimpanzee, macaque, gorilla, chicken, frog, and zebrafish. When no ortholog was annotated in the inparanoid database for selected species, we manually searched the protein sequence database by blast to identify potential orthologs. If there are one DAZ domain and multiple DAZ-like repeats, we classified it as an ortholog of either DAZ3 or DAZ2, since orthologs of these two proteins are hard to distinguish. When the occurrence of the RRM is two, we consider it as a DAZ4 ortholog. If the occurrence of RRM is three, we count it as a DAZ1 ortholog. All the orthologs identified by both inparanoid and manual searches are listed in Supplemental Table S2.4 with their scores and bootstrap probabilities.
The protein sequences of polyadenylate-binding proteins of five species (H. sapiens, M. musculus, D. melanogaster, C. elegans, and S. pombe) were downloaded from uniprot, and their
29
Table 2.1 Number of proteins containing different RBDs in five species as reported from Ensembl biomart 0n 07/09/13
Domain name
(Interpro ID)
Number of proteins in different species
H.
sapiens
M.
musculus
D.
melanogaster
C.
elegans
S.
cerevisiae
RNA recognition motif (IPR000504)
242 248 139 105 54
K Homology domain (IPR004087)
39 39 29 28 9
C2H2 Zinc finger (IPR007087)
805 693 291 176 48
CCCH Zinc finger (IPR000571)
63 50 30 37 10
S1 RNA-binding domain (IPR022967)
9 9 11 6 7
PAZ domain (IPR003100)
10 9 7 29 NULL
Pumilio RNA-binding repeat (IPR001313)
4 4 3 12 7
Total (without any filter)
63,253 38,561 15,628 46,589 7,126
Data set used: Homo sapiens (GRCh37.p11), Mus musculus (GRCm38.p1), Drosophila melanogaster (BDGP5), Caenorhabditis elegans (WBcel235), and Saccharomyces cerevisiae
30
Figure 2.1 Elevated sequence similarity between sibling RRMs in human RBPs.
(A) Workflowoftheanalyses.ThehumanproteinscontainingRRMs were obtained from the InterPro database, and the RRM sequences were extracted according to the consensus annotations from three different da- tabases. After filtering out the duplicated sequence, 453 RRMs from 391 unique RBPs were analyzed through sequence comparison. (B) Similarity scores between all RRM pairs in human RBPs. Each RRM was aligned with all other 452 RRMs, where the distribution of similarity score is represented by a gray vertical line spanning the mean ± 1×
standard derivation. The similarity score between sibling RRMs was represented as a red circle.
Similarity Score
Count
0 20 40 60 80 100
0 50 100 150 200 Control 3-domain RBPs
Mean = 31 Mean = 22
Similarity Score
Count
0 20 40 60 80 100
0 50 100 150 200 Control 2-domain RBPs
Mean = 31
Mean = 22
Similarity Score C umu la tive F re q.
0 20 40 60 80 100
0.0 0.2 0.4 0.6 0.8 1.0 Control 2-domain RBPs 3-domain RBPs 4-domain RBPs 5-domain RBPs
C
D
E
A
B
Download Human RRMs Extract RRM seq. (len>45) 391 unique RBPs 453 unique RRMs Pairwise alignments Compare Sibling pairs vs. random pairs Figure 1 Similarity Scores C umu la tive F re qu en cy Similarity Scores C ou nt s Similarity Scores C ou nt s
0 100 200 300 400
31
32
Figure 2.2 Sibling RRM pairs in species-specific proteins are more conserved.
(A) HumanRBPs with multiple RRMs were divided into two classes: the proteins shared among four different species (H. sapiens, M. musculus, D. melanogaster, and C. elegans) and the proteins found only in human. The similarity scores between sibling RRMs were calculated for each class and represented as a box plot. The score distributions were compared by t-test with P value indicated. The same analyses were also carried out using RBPs from M. musculus (B), D. melanogaster (C), and C. elegans (D).
Figure 2
Shared n=130 Unique n=16 0 20 40 60 80 100 Al ig n. Sco re Human p=5.5e-03 Shared n=128 Unique n=40 10 20 30 40 50 Mouse p=1.4e-04 Shared n=95 Unique n=33 10 20 30 40 50 Fly p=7.9e-02 Shared n=83 Unique n=21 10 20 30 40 Worm p=0.345 Shared n=130 Unique n=16 0 20 40 60 80 100 Al ig n. Sco re Human p=5.5e-03 Shared n=128 Unique n=40 10 20 30 40 50 Mouse p=1.4e-04 Shared n=95 Unique n=33 10 20 30 40 50 Fly p=7.9e-02 Shared n=83 Unique n=21 10 20 30 40 Worm p=0.345Figure 2
33
Figure 2.3 An RBP family with recent RRM duplications.
(A) ThemembersinthehumanDAZ protein family contain one or more RRMs and DAZ-like domains. All RRMs in DAZ1, DAZ2, DAZ3, DAZ4, and DAZL are identical, whereas the RRM in BOLL has 53% sequence identity with the other RRM. The DAZ1 to DAZ4 are in the Y chromosome, while BOLL and DAZL are in chromosomes 2 and 3. The ortholog genes in other species were identified by a combination of inparanoid annotation and blast search, and species that contain various DAZ proteins were represented with different boxes. The DAZ proteins with multiple RRMs were only found in cer- tain primates. (B) The SNP density of each human DAZ protein was compared with the average density of other genes in the same chromosome. The SNP density ratios between DAZ genes relative to other genes in the same chromosome are indicated. The genes in the Y chromo- some encoding DAZ proteins have lower SNP density, suggesting that they are more recently di- verged genes.
Chr Y Chr 2:
Chr 3:
SN
P
D
en
si
ty
0" 0.005" 0.01" 0.015" 0.02" 0.025"
BOLL" DAZP" DAZ2" DAZ3" DAZ4" DAZ1" DAZ family genes
Average of 100 random genes on correspoing chromosome
0" 0.00004" 0.00008" 0.00012"
BOLL" DAZP" DAZ2" DAZ3" DAZ4" DAZ1" 1.0 0.37 0.016 0.013 0.03 0.003 Ratio
(DAZ/others):
Figure 3
A
B
""Human,"Chimpanzee"
"""Gorilla" """Macaque"
"""Chicken"
34
Figure 2.4 An RBP family with ancient RRM duplications.
(A) The diagram of PABP proteins from five species (H. sapiens, M. musculus, D. mel- anogaster, C. elegans, and S. pombe). The members in this protein family contain one to four RRMs, and some also contain a C-terminal PABC domain. Each RRM is colored according to their relative positions within the protein. (B) The phylogenetic tree of RRMs in the PABP family was visualized via TreeView. The RRMs are colored in the same scheme as in panel A, and the RRMs in the same position are more similar to each other across all species.
Figure 4
PABP5(382) 18-96 106-182 199-276 302-378
PABP4(644) 11-89 99-175 191-268 294-370 551-628 PABP3(631)
11-89 99-175 191-268 294-370 537-614
PABP1(636) 11-89 99-175 191-268 294-370 542-619
EPAB2(278)
147-224
: RRM : PABC
PAP1L(614)
11-89 99-175 191-268 294-370 528-605
PAP1M(200)
2-80 90-166
PAB4L(370) 10-88 98-174 190-267 293-369
PABP2(306) 172-249
PABP1(636)
11-89 99-175 191-268 294-370 542-619
PABP2(302)
168-245
PABP(634)
2-80 90-167 181-259 285-362 552-629
PABP2(224) 96-173
D.m
PAB-2(692) 57-135
145-222 238-317 343-420 601-680
EPAB2(273) 143-220
PAB-1(646)
32-110 120-197 213-289 317-394 566-645
PABP-2(205)
78-155
C.e
PABP(653) 80-158 168-245 261-338 364-441 569-646 PAB2(166)
55-132
PABPX(710)
19-102 222-292 401-474
S.p M.m
H.s
Dm PABP 1 Ce PAB2 1 Ce PAB1 1 Hs PABP3 1 Hs PABP1 1 Mm PABP1 1 Hs PABP4 1 Hs PAP1L 1 Hs PAP1M 1 Hs PAB4L 1 Hs PABP5 1 Sp PABP 1 Dm PABP2 0 Hs PABP2 0 Mm PABP2 0 Ce PABP2 0 Hs EPAB2 0 Mm EPAB2 0 Sp PAB2 0 Sp PABPX 1 Sp PABPX 2 Sp PABPX 3 Dm PABP 2 Ce PAB2 2 Ce PAB1 2 Sp PABP 2 Hs PABP3 2 Hs PABP1 2 Mm PABP1 2 Hs PABP4 2 Hs PAP1L 2 Hs PAP1M 2 Hs PABP5 2 Hs PAB4L 2 Dm PABP 3 Hs PABP5 3 Hs PABP3 3 Hs PABP1 3 Mm PABP1 3 Hs PAB4L 3 Hs PABP4 3 Hs PAP1L 3 Sp PABP 3 Dm PABP 4 Hs PABP3 4 Hs PABP1 4 Mm PABP1 4 Hs PAP1L 4 Hs PABP4 4 Hs PABP5 4 Hs PAB4L 4 Ce PAB2 4 Ce PAB1 4 Sp PABP 4 Ce PAB2 3 Ce PAB1 3
Figure 4
A
B
35
Figure 2.5 Gene Ontology analysis of human RBPs with multiple RRMs.
(A) Sibling RRMs with different similarities tend to bind distinct regions of mRNA. The similarities between sibling RRM pairs are rep- resented with a histogram (gray), with the colored dots indicating the gene ontology (GO) terms enriched in the genes from different bins of the histogram. (B) According to the domain similarity score between sibling RRMs, all RBPs were divided into six groups as equally as possi- ble: 1–20 (108 pairs), 21–24 (92 pairs), 25–28 (106 pairs), 29–33 (104 pairs), 34–41 (97 pairs), and 42–100 (93 pairs). The GO analyses were carried out, and the enriched functional terms in each bin are represented with a heat map to indicate the significance of enrichment. The func- tions common to all groups are marked.
Histogram of real$V1
Scores
Fre
qu
en
cy
0 20 40 60 80 100
0
20
40
60
80
60
0 20 40 60 80 100
Poly A RNA binding mRNA 5’UTR binding
Similarity Score
C
ou
nt
s
Similarity:
Similarity Score: 1-20 21-24 25-28 29-33 34-41 42-100
Group: 1 2 3 4 5 6 mRNA%5’(UTR%binding%
BRE%binding% AU(rich%element%binding% mRNA%3’(UTR%binding% Transla;on%repressor%ac;vity,% nucleic%acid%binding%
Transla;on%repressor%ac;vity% Transla;on%regulator%ac;vity% Transla;on%ac;vator%ac;vity% Poly(U)%RNA%binding% Poly(pyrimidine%tract%binding% Poly(A)%RNA%binding% Poly(purine%tract%binding% Telomeric%DNA%binding% Single(stranded%RNA%binding% mRNA%binding%
Figure 5
A
B
40
20
0
36
Figure 2.6 Sequence motifs enriched in the RRM-containing RBPs.
(A) We removed the RRM sequence from the RBPs and analyzed the re- maining sequence for
amino acid propensities. For all 20 amino acids, their frequencies within non-RRM regions were
compared to other pro- teins in the human proteome and the relative ratio is plotted. (B)
Sequence logos around the most enriched amino acid residues in RBPs. The height of each
single-letter amino acid code corresponds to the probability of occurrence at each position. (C)
Repetitive sequence patterns that significantly co-occur with RRM in all human proteins. The size of each pattern corresponds to the number of occurrence. The word cloud was generated with the Wordle online tool. The top 80 motifs are shown.
Figure 6
a
b
c
!0.4% !0.2% 0% 0.2%
Log$(e
nr
ic
hm
ent$r
a/
37
2.6 Supplementary Material
Figure S2.1 Increased numbers of RRMs within a single RBP in mammals.
Cumulative frequency of RBP with different numbers of RRM was plotted in four species (H.
sapien, M. musculus, D. melanogaster and C. elegans).
0.4 0.6 0.8 1
1 2 3 4 5 6
Human
Mouse
Fly
Worm
Number of RRM within a RBP
C
u
m
ul
at
ive
f
re
q
u
e
n
cy
of
RB
38
Figure S2.2The similarity scores of RRMs measured with different scoring matrices.
39
Figure S2.3 The lengths between sibling RRMs do not affect the similarity.
The similarity scores between sibling RRMs is plotted against the length (i.e. number of amino acid) between sibling RRMs. No correlation is found between the length and similarity scores.
R² = 4.6E-05
0 20 40 60 80 100 120
0 50 100 150 200 250 300 350
Length between RRM pairs
Si
m
ila
ri
ty
s
c
o
40
Figure S2.4 Similarity scores between RRM pairs in D. melanogaster RBPs and pairs of KH domain in human RBPs.
(A) Each RRM was aligned with all other RRMs in D. melanogaster, where the distribution of
similarity score is represented by a grey vertical line spanning the mean ± 1× standard derivation.
For proteins with multiple RRMs, the similarity score between the sibling RRMs was
represented as a red circle. The order of RRM along the x-axis is arbitrary.(B) Boxplots of
41
Figure S2.5 Amino acid composition frequency and composition distance in real RRM-pairs.
(A) Amino acid frequencies of each RRM were calculated. We plotted the mean ±1 S.D. for
RRMs in each group and compare the difference between groups using ANOVA test. Compositions that are significantly different between groups are denoted with *. (B)
Composition distances between real RRM-pairs were calculated in each group and box plot of the distribution were plotted. We also listed the mean and standard deviation (S.D.) of the distribution.
-0.04 0 0.04 0.08 0.12 0.16
K*# L# G# E# F# V# A# S# I# D*# R*# T# N*# Q*# P# Y# M# H# C# W# Frequency
Amino Acid
* ANOVA F-statistic with p-value < 0.01
2-domain 3-domain 4-domain 5-domain
C
omp
osi
tio
n
#D
is
tan
ce
#
42
Figure S 2.6 Sequence motifs enriched in human RBPs containing KH domain(s).
(A) We removed the KH sequences from the RBPs and analyzed the remaining sequence for
amino acid propensities. For all 20 amino acids, their frequencies in non-KH regions were
43
Figure S2.7 Sequence motifs enriched in human RBPs containing Zinc finger C2H2 domain(s).
(A) We removed the Zinc finger C2H2 sequences from the RBPs and analyzed the remaining
sequence for amino acid propensities. For all 20 amino acids, their frequencies within non-Zinc
finger C2H2 regions were compared to other proteins in the human proteome and the relative ratio plotted. (B) Sequence logos around the most enriched amino acid residues in RBPs. The height of each single-letter amino acid code corresponds to the probability of occurrence at each position. (C) Repetitive sequence patterns that significantly co-occur with Zinc finger C2H2 in all human proteins. The size of each pattern corresponds to the number of occurrence. The top 80 motifs are shown.
44
Table S 2.1 Detailed information of RRM-containing RBPs in human
UniProt/ SwissProt ID Associated Gene Name No. of RRM RRM position RRM align score(s) PFAM ID
SRSF9_HUMAN SRSF9 2 113-‐174, 16-‐83 16 PF00076 RBM46_HUMAN RBM46 3 63-‐126, 143-‐204, 238-‐301 25 14 22 PF00076
PM14_HUMAN AC008073.5 1 21-‐87 NULL PF00076
PPIL4_HUMAN PPIL4 1 242-‐312 NULL PF00160 PF00076
RAVR1_HUMAN RAVER1 2 61-‐123, 135-‐203 25 PF00076 U2AF2_HUMAN U2AF2 3 400-‐459, 151-‐224, 261-‐330 11 18 20 PF00076 RBM4B_HUMAN RBM4B 2 4-‐64, 81-‐141 44 PF00076 PF00098 RBM23_HUMAN RBM23 2 168-‐233, 265-‐334 19 PF00076
DAZ3_HUMAN DAZ2 1 42-‐98 NULL PF00076
CPEB2_HUMAN CPEB2 1 334-‐395 NULL PF00076
RBM11_HUMAN RBM11 1 12-‐80 NULL PF00076
RBY1D_HUMAN RBMY1D 1 10-‐79 NULL PF08081 PF00076
RBM47_HUMAN RBM47 3 73-‐137, 153-‐214, 248-‐311 29 17 19 PF00076
RBM18_HUMAN RBM18 1 27-‐98 NULL PF00076
FUS_HUMAN FUS 1 287-‐365 NULL PF00641 PF00076
MK67I_HUMAN MKI67IP 1 47-‐116 NULL PF12196 PF00076
IF2B1_HUMAN IGF2BP1 2 85-‐150, 4-‐68 3 PF00013 PF00076
RBY1A_HUMAN RBMY1A1 1 10-‐79 NULL PF08081 PF00076
IF4H_HUMAN EIF4H 1 45-‐112 NULL PF00076
HNRH1_HUMAN HNRNPH1 3 15-‐82, 293-‐355, 115-‐181 31 44 41 PF00076 PF08080 RBMS3_HUMAN RBMS3 2 63-‐123, 142-‐206 27 PF00076
RBMXL_HUMAN RBMXL1 1 10-‐80 NULL PF00076 PF08081
PTBP2_HUMAN PTBP2 3 459-‐518, 183-‐247, 340-‐405 26 21 24 PF00076
PRGC1_HUMAN PPARGC1A 1 679-‐739 NULL PF00076
PABP5_HUMAN PABPC5 4 20-‐88, 108-‐175, 304-‐372, 201-‐269 23 23 24 36 32 39 PF00076 SART3_HUMAN SART3 2 706-‐774, 803-‐871 27 PF00076 PF05391
RBM14_HUMAN RBM14 2 81-‐142, 3-‐60 50 PF00076
REXON_HUMAN AC004381.6 1 510-‐571 NULL PF00929 PF00076
SR140_HUMAN U2SURP 1 276-‐348 NULL PF01805 PF00076
RBM5_HUMAN RBM5 1 100-‐163 NULL PF01585 PF00076 PF00641 HNRPR_HUMAN HNRNPR 3 167-‐231, 343-‐404, 248-‐309 25 22 22 PF00076
SRS12_HUMAN SRSF12 1 12-‐81 NULL PF00076
ENOX1_HUMAN ENOX1 1 144-‐199 NULL PF00076
SREK1_HUMAN SREK1 1 68-‐136 NULL PF00076
RB12B_HUMAN RBM12B 2 402-‐470, 288-‐353 12 PF00076
EPAB2_HUMAN PABPN1L 1 149-‐218 NULL PF00076
SLIRP_HUMAN SLIRP 1 22-‐84 NULL PF00076
EIF3G_HUMAN EIF3G 1 241-‐303 NULL PF12353 PF00076