HPV VACCINATION AS A TOOL TO REDUCE SOCIOECONOMIC DISPARITIES IN CANCER
Jennifer C Spencer
A dissertation submitted to the faculty at the University of North Carolina at Chapel Hill in partial fulfillment of the requirements for the degree of Doctor of Philosophy in the Department
of Health Policy and Management in the Gillings School of Global Public Health.
Chapel Hill 2019
Approved by: Stephanie Wheeler Noel Brewer Justin Trogdon
ABSTRACT
Jennifer C Spencer: HPV Vaccination as a Tool to Reduce Socioeconomic Disparities in Cancer (Under the direction of Stephanie Wheeler)
Background: Individuals living in high-poverty areas are more likely to develop cancers associated with human papillomavirus (HPV). Evidence also suggests that high-poverty counties also have higher uptake of HPV vaccine, but the effect of HPV vaccine on cancer disparities by area poverty remains unknown.
Methods: We constructed a dynamic infection model of HPV transmission that we modified to incorporate HPV prevalence, HPV cancer incidence, and HPV vaccination specific to low- and high-poverty counties. We created a synthetic population projecting the absolute and relative change in HPV cancer incidence in high- vs. low-poverty counties over a 75-year time horizon, as well as the potential cost and outcomes associated with increasing vaccination rates by 10% in each setting. Finally, we examined the cost-effectiveness of three evidence-based interventions designed to increase HPV vaccine uptake; school located vaccination, the Assessment, Feedback, Incentives and eXchange program, and a centralized reminder/recall intervention.
cost effectiveness in high-poverty counties that is nearly half that of low-poverty counties. Finally, we show that all three strategies to improve HPV vaccine uptake are cost-effective relative to status quo. The AFIX program is the lowest total cost and vaccination increase while a large-scale school-located HPV vaccination program is both the most effective and most costly alternative.
Discussion: HPV vaccine offers unprecedented potential to prevent HPV cancers but is underutilized in the US. Policy-makers seeking to reduce cancer disparities by area poverty should prioritize increasing HPV vaccine uptake as part of a multi-component strategy including addressing care access and social determinants of HPV cancer. As HPV vaccination falls below standard cost-effectiveness thresholds, considerable resources could be dedicated to increasing vaccine uptake, particularly in settings with high HPV cancer burden, while maintaining net societal benefit.
ACKNOWLEDGMENTS
This work would not have been possible without the copious feedback, numerous
suggestions, and considerably expertise of my dissertation committee. I am incredibly grateful to my chair and advisor, Stephanie Wheeler, for five years of guidance, support, and insights. I could not have asked for a better or more enthusiastic advisor and I am lucky to have so many opportunities to work with and to benefit from her insights and skills as a researcher, teacher, and leader. I am also grateful to Noel Brewer for his mentorship through this experience. His
attention to detail and commitment to producing meaningful work has made my research clearer, stronger, and more impactful. My dissertation was also greatly improved by the methodological knowledge of Justin Trogdon, the clinical and public health insight of Tamera Coyne-Beasley, and the all-around practical wisdom of Morris Weinberger. I am also deeply grateful to the Cancer Care Quality Training Program (NCI: T32CA11633) and the Lineberger Comprehensive Cancer Center for their funding and professional support during this process.
I am lucky to be a member of the greatest PhD cohort in the history of time. I will never be able to properly describe how much my classmates have meant to me as insightful colleagues, irreplaceable emotional support, and amazing friends. Particular thanks to Neela Kumar without whom I would likely never have made it through this program and certainly would have
TABLE OF CONTENTS
LIST OF TABLES ... xii
LIST OF FIGURES ... xiii
LIST OF ABBREVIATIONS ... xiv
LIST OF SYMBOLS ... xv
CHAPTER 1: INTRODUCTION... 1
Background ... 1
Significance... 4
Innovation ... 6
Conceptual model ... 7
CHAPTER 2: MODELING THE LONG-TERM IMPLICATIONS OF HPV VACCINATION ON HPV CANCER DISPARITIES IN HIGH- VS. LOW-POVERTY COUNTIES ... 9
Overview ... 9
Introduction ... 11
Methods ... 12
HPV Transmission Model ... 12
Model Inputs by Poverty Quartile... 13
Results ... 15
Discussion ... 17
Conclusion ... 19
Tables and Figures: ... 20
CHAPTER 3: THE COST-EFFECTIVENESS OF HPV VACCINATION IN LOW- VS. HIGH-POVERTY SETTINGS... 29
Overview ... 29
Introduction ... 31
Methods ... 32
Dynamic Transmission Model ... 32
Poverty-Specific Model Inputs ... 33
Cost and Utility Data ... 34
Analysis ... 34
Results ... 35
Discussion ... 38
Conclusions... 40
Tables and Figures ... 41
CHAPTER 4: ECONOMIC EVALUATION OF STRATEGIES TO INCREASE HPV VACCINATION ... 46
Overview ... 46
Methods ... 49
HPV Transmission Model Overview ... 49
Model Input Data ... 50
Comparison Interventions ... 51
Outcome Measures... 53
Analysis ... 53
Results ... 54
Discussion ... 56
Conclusion ... 58
CHAPTER 5: DISCUSSION AND POLICY IMPLICATIONS ... 64
Overview ... 64
Policy Implications ... 67
Future Directions ... 68
TECHNICAL APPENDIX ... 70
Model Structure ... 70
Demographics ... 70
HPV Vaccination ... 71
HPV Transmission ... 74
HPV Progression ... 77
Full State Equations ... 87
LIST OF TABLES
Table 1: Characteristics of Low- and High-Poverty Counties ... 20
Table 2: Input Data by Poverty Quartile ... 21
Table 3: HPV Cancer Incidence by Sex, Site, and County Poverty Quartile ... 22
Table 4: Projected Reduction in HPV Cancer Disparity- Sensitivity Analysis ... 23
Table 5: Model Inputs ... 41
Table 6: Costs and Cancer Reduction Associated with Increasing HPV Vaccination in Low and High-Poverty Counties ... 42
Table 7: HPV Cancers Averted From a Ten Percentage-Point Increase in HPV Vaccine Uptake, by Sex and Cancer Site... 43
Table 8: Summary of Intervention Characteristics ... 59
Table 9: Cost-effectiveness of Strategies for Increasing HPV Vaccination ... 60
Table A1: Population age structure by sex ... 70
Table A2: Death rate per 100,000 by age and sex (annual) ... 71
Table A3: Type-Specific Efficacy of Quadrivalent and Nonavalent HPV Vaccine ... 73
Table A4: Sexual Activity Category by Sex and Age ... 75
Table A5: Number of New Partners Annually, by Age and Sexual Activity Category ... 75
Table A6: Per-Partnership Infectivity Rate, by HPV Type ... 76
Table A7: Prevalence of HPV by Type and Age ... 77
Table A8: Annual progression rates by HPV Type and Cancer Site ... 78
Table A9: Annual Probability of Progression, Regression, and Clearance by HPV Type ... 79
Table A10: Cervical Cancer Screening Parameters ... 80
LIST OF FIGURES
Figure 1: HPV Cancer Care Continuum ... 8
Figure 2: Model Overview ... 24
Figure 3: Observed and Projected HPV Vaccine Uptake by Poverty Quartile ... 25
Figure 4: Projected HPV Cancer Incidence in High- vs. Low-Poverty Counties After Introduction of HPV vaccine... 26
Figure 5: Projected HPV Cancer Incidence, by Cancer Site: Females ... 27
Figure 6: Projected HPV Cancer Incidence, by Cancer Site: Males... 28
Figure 7: Effect of Changing Time Horizon on ICER Estimates and Cancers Averted ... 44
Figure 8: Sensitivity of ICER to Changes in Key Model Inputs ... 45
Figure 9: Incremental Cost and QALYs Gained... 61
Figure 10: Incremental Cost and Effectiveness of the AFIX Program Compared to Alternative HPV Vaccine Interventions... 62
Figure 11: Incremental Cost and Effectiveness of a School-Located Vaccination Program Compared to Centralized Reminder/Recall ... 63
Figure A1: Summary of Model Vaccination States ... 72
Figure A2: Prevalence of HPV Vaccine Initiation and Completion by Sex, Age, and Year ... 73
Figure A3: Schematic of Sexual Behavior and HPV Transmission Module ... 74
Figure A4: Summary of HPV Progression ... 78
Figure A5: Model Fit to HPV prevalence by Age ... 83
Figure A6: Model Fit to HPV Prevalence by Type ... 84
Figure A7: Model Fit to HPV Cancer Incidence by Age: Females ... 85
LIST OF ABBREVIATIONS
ACIP American Committee on Immunization Practices
ACS American Community Survey
ADI Area Deprivation Index
AFIX Assessment, Feedback, Incentives, and eXchange CDC Center for Disease Control and Prevention
HPV Human Papillomavirus
ICER Incremental Cost Effectiveness Ratio
FDA Food and Drug Administration
FPL Federal Poverty Level
QALY Quality-Adjusted Life Year
RR Relative Risk
NHANES National Health and Nutrition Examination Survey NHIS National Health Interview Survey
NIS—Teen National Immunization Survey—Teen
LIST OF SYMBOLS
a age category [<10, 10-13, 14-17, 18-24, 25-34, 35-44, 45-54, 55-64, 65-73, 75-84, 85+ ]
i sex [m,f]
j sexual behavior category [very low, low, medium, high] s viral type [16,18,31,33,45, 52, 58, other high risk] v vaccination [none, partial, complete]
b fertility rate
m mortality rate
w rate of aging
k rate of partner change
𝜀 assortiveness
𝛽 per-partnership infection rate
𝜆 force of infection
𝜂 vaccine efficacy
𝜁
𝜋1
natural immunity protection
progression (HPV infection to CIN-1)
𝜋2 progression (CIN-1 to CIN-2,3)
𝜋3 progression (CIN-2,3 to cervical cancer)
𝜋4 progression (HPV infection to vulvar cancer)
𝜋5 progression (HPV infection to vaginal cancer)
𝜋6 progression (HPV infection to penile cancer)
𝜋8 progression (HPV infection to oropharyngeal cancer)
𝛾0 regression (HPV infection to susceptible)
𝛾1 regression (CIN-1 to HPV infection)
𝛾2 regression (CIN-2,3 to CIN-1)
𝛾3 regression (CIN-1 treated, return to recovered)
𝛾4 regression (CIN-1 treated, return to HPV infection)
𝛾5 regression (CIN-2,3 treated, return to recovered)
𝛾6 regression (CIN-2,3 treated, return to HPV infection)
𝜃 cervical cancer screening
𝜐 follow-up from abnormal screen
𝜙 sensitivity of Pap smear
𝜏0 treatment successful- return to susceptible
CHAPTER 1: INTRODUCTION
Background
Individuals living in high-poverty areas are more likely to develop and die from several cancers.1 Among those with the largest disparities by area poverty are cancers associated with
human papillomavirus (HPV). For example, individuals living in high-poverty areas are nearly twice as likely to both develop and to die from cervical cancer as individuals in low-poverty areas.1,2 Incidence rates of penile, anal, vaginal, vulvar, and oropharyngeal cancer are also higher
for those living in high-poverty areas.1 The socioeconomic divide in HPV cancer is likely
complex and has been attributed to multiple, overlapping risk factors.3 Among these are
differences in health behaviors, sexual networks and preventive care.4 In 2006, the introduction
of HPV vaccine created an important opportunity for cancer prevention, with the most recent version protecting against seven oncogenic types of HPV.5
HPV vaccination has unprecedented potential to reduce not only mortality, but incidence of many cancers and precancerous lesions attributable to HPV. The reduction in cancer incidence is expected to be particularly dramatic in cervical cancer, leading the American Association of Cancer Research and others to declare the eradication of cervical cancer an achievable goal.6–9
However, high incidence rates of cervical and other HPV cancers in low-resource areas of the US may make universal eradication harder to accomplish.
vaccine is actually higher for teens living below the Federal Poverty Level (FPL) (73%) than those individuals living above the FPL (63%) with no significant differences in rates of vaccine follow-through (subsequent administrations among initiators).10 This leads to those below FPL
being more likely to be fully up-to-date with all recommended doses (54% vs. 47%). The same pattern has been described for HPV vaccination using area-level measures of socioeconomic conditions.11,12 The higher rate of HPV vaccine uptake in economically deprived settings is
poorly understood, but has been attributed to publicly funded vaccine programs (including the Vaccines for Children Program) and successful outreach from community health centers.11
Regardless of the underlying mechanism of higher uptake in traditionally underserved counties, the long-term implications of this phenomenon for disparities in cancer incidence for high- and low-poverty counties remain unexplored. Simulation models have been constructed to assess the overall impact of HPV vaccination on cancer burden13–15 but, to date, these models have not
considered the geographic heterogeneity of vaccination rates, HPV burden, and screening behavior across US counties.
Simulation models have also been used to evaluate the cost-effectiveness of HPV vaccination. Even prior to the Food and Drug Administration (FDA) approval of the vaccine, researchers used modeling methods to assess the potential of HPV vaccination for cancer reduction and a formulation protecting against HPV 16 and HPV 18 would be cost-effective for prevention of cervical cancer.16 After FDA approval in 2006, Kim and Goldie re-evaluated
cost-effectiveness estimates of the quadrivalent vaccine, incorporating additional benefits of vaccination- such as protection against genital warts.17
be efficacious against additional cancers in both men and women18–20, the American Committee
on Immunization Practices (ACIP) expanded their routine recommendation to both boys and girls 11-12 years of age.21 The cost-effectiveness of HPV vaccination among boys varies widely
by assumptions around vaccine uptake among women and whether models include male to male transmission.15,22–24 In 2015, the FDA approved a new formulation of HPV vaccine, which
protects against nine types of the virus (HPV 6, 11, 16, 18, 31, 33, 45, 52, 58).25 This nine-type
version was soon added to ACIP recommendations.26 Modeling studies compared this
formulation to the four type vaccine and found it to be a cost saving strategy.27,28 Lastly, in 2016
a two-dose vaccination schedule was shown to be efficacious and was recommended for boys and girls initiating the vaccine prior to age 15.29,30 Even in the presence of increased per-dose
cost, the net reduction in upfront costs for vaccination with little to no reduction in long-term benefit was cost-saving relative to the four-type version.31
Globally, modeling studies have examined thresholds needed for eliminating cervical cancer (reducing rates below 1 per 100,000) in both low and high-income countries and have found that while elimination may be feasible for high income countries, HPV vaccination alone would be insufficient for elimination in lower income countries by the end of the century.32–34
Domestically, both research and advocacy organizations believe the eradication of cervical cancer may be an achievable goal through combinations of improving screening practices and increasing HPV vaccination.6,8,9 Yet despite the potential of HPV vaccination for reduction of
HPV cancers, rates of uptake in the US are still much lower than the HealthyPeople 2020 target of 80%.35 Interventions to improve HPV vaccination rates have had mixed results36, but there has
The overall objective of this study is to understand the implications of current geographic patterns of HPV vaccine uptake on HPV cancer incidence and to identify cost-effective strategies for further reducing both overall HPV cancer incidence and geographic disparities in HPV cancer incidence.
Significance
Large and persistent income-related disparities exist in cancer incidence and cancer-related mortality within the US, with individuals living in high-poverty areas more likely to develop and die from multiple types of cancer- including those associated with HPV.2 Higher cervical cancer
rates in low-resource areas are partially attributable to differences in access to timely receipt of Pap smears, which can prevent cervical cancer through the detection and subsequent treatment of pre-cancerous lesions.4 Even for HPV-associated cancers for which no effective screening exists,
socioeconomic disparities are observed in both incidence and mortality.1 HPV vaccine now
offers even earlier intervention by protecting against oncogenic types of the virus that cause cervical, anal, penile, vulvar, vaginal, and oropharyngeal cancers.21 Importantly, early evidence
shows that HPV vaccine initiation rates may actually be higher for teens in high-poverty counties.11 HPV vaccine has the potential not to just reduce overall cancer incidence, but to
reduce geographic disparities in HPV-associated cancers.
As HPV cancer incidence is far removed from administration of the vaccine itself, many studies assessing the potential effect of the vaccine necessarily rely on mathematical modeling methods.14,17,37 Beyond prediction of future trends, transmission models have also been used to
compare multiple prevention strategies; assessing whether to include men in vaccination programs15,38–40, what age ranges should be targeted13,41, and how cervical cancer screening
the vaccines, these models used average population characteristics to assess baseline risk for HPV infection and HPV associated-cancer incidence. While some studies incorporated variation in observed HPV vaccine uptake into their models27,45, most examined outcomes at two or more
levels of vaccine coverage- generally an ideal “high coverage” scenario (90-100% completion) and more realistic “low coverage” scenario (50-60% completion).38,44,46 Only in recent years
have completion rates in the US begun to approach this “low coverage” estimate, in part due to a reduction in the number of required doses.30 Studies are also inconsistent in their assumptions
around efficacy when the series is initiated but not completed, with some studies assuming no protection, some assuming partial protection, and some assuming complete protection.15,47–49
Comparison of HPV vaccine completion rates as well as other model assumptions from several representative modeling studies are presented in the appendix (sTable 1).
While HPV vaccination has been studied across countries, examination of differential vaccination or outcomes for subpopulations within the US are less common. Burger and colleagues projected changes in racial disparities for HPV-related cancer incidence under both ideal and observed HPV vaccine uptake and found existing disparities are likely to decrease, but not disappear.45 It is worth noting, however, that while this model includes racial differences in
vaccination, it is not dynamic and therefore only accounts for racial differences in HPV prevalence and cervical cancer screening practices indirectly, through including differences in observed cancer incidence. Another study from 2016 explores geographic disparities, finding high heterogeneity across states in the cost-effectiveness of the nine-type vaccine by
To date, no studies have examined implications for HPV-associated cancer burden based on differences in HPV vaccination by area poverty. This difference is particularly important given a seemingly anomalous finding of higher HPV vaccination initiation in high-poverty areas.11 Area poverty has been associated with lower rates of Pap smear completion and higher
rates of cervical and other HPV cancers.1,4 As a result, it is unclear how geographic disparities in
HPV-associated cancers may change in the future as a result of current patterns of care. Understanding the long-term cancer implications of differences in vaccination is important for targeting effective interventions to populations with the highest need.
This research studies helps to identify how geographic differences in HPV-associated cancer will change as a result of current vaccination rates (initiation and completion), when considered in the context of existing patterns of HPV prevalence and cancer screening by area deprivation. Further, it examines the cost-effectiveness of strategies for increasing HPV vaccination from the perspective of a state government.
Innovation
This dissertation offers novel insight into an important disparity in HPV cancer, through exploring the implications of differences in HPV vaccine receipt in high- and low-poverty counties. High rates of HPV vaccine initiation among lower income adolescents is an anomaly within cancer prevention efforts, and a better understanding of this phenomenon on a larger scale will help to target future strategies, not just for HPV-associated cancers, but for other primary prevention efforts.
future outcomes, considering differences in HPV infection, underlying risk factors for
development of HPV cancers, and cervical cancer screening for high- and low-poverty counties. While other studies have used modeling techniques to assess the potential long-term outcomes of HPV vaccination, none have considered the implication of current vaccination patterns on
geographic cancer disparities. These results will help to guide policy-makers by determining whether HPV vaccine will reduce cancer incidence as well as identifying cost-effective strategies for future HPV-associated cancer prevention efforts.
Conceptual model
The proposed research is based on a modified version of Zapka’s Cancer Continuum Framework50, which examines how disparities arise at each step in the continuum of care, from
risk assessment to cancer incidence (Figure 1). Zapka conceptualizes disparities as more than failures at one individual point, but as additive failures throughout a continuum which accrue over time to lead to lower quality outcomes. In cervical cancer, for example, multiple missed opportunities for prevention, later detection of cervical abnormalities, and delayed treatment lead to disparate outcomes for those of lower incomes. In other HPV-associated cancers, differences in risk assessment, exposure, and early detection may also exist. 51
Figure 1: HPV Cancer Care Continuum
CHAPTER 2: MODELING THE LONG-TERM IMPLICATIONS OF HPV VACCINATION ON HPV CANCER DISPARITIES IN HIGH- VS. LOW-POVERTY
COUNTIES
Overview
Introduction: Individuals living in high-poverty areas are more likely to develop cancers associated with human papillomavirus (HPV). Evidence suggests high-poverty counties have also have higher uptake of HPV vaccine. HPV vaccination is projected to reduce the incidence of HPV cancers nationally, but it remains unknown if current vaccination rates will affect
disparities in HPV cancer incidence in high- vs low-poverty US counties is unknown.
Methods: We constructed a dynamic infection model of HPV transmission that we then modified to incorporate data on HPV prevalence, HPV cancer incidence, HPV vaccination, and cervical cancer screening specific to low- and high-poverty counties. We created a synthetic population of one million individuals in both a hypothetical low-poverty and hypothetical high-poverty county and projected the absolute and relative change in HPV cancer incidence in high- vs. low-poverty counties over a 75-year time horizon.
vaccine introduction to a projected disparity of relative risk of 1.74 at 75 post-vaccination. For men, the relative HPV cancer disparity between high and low-poverty counties is projected to increase slightly (from 1.53 to 1.54).
Discussion: We project a continuation of historically higher vaccination in high-poverty counties (relative to low-poverty counties) will be insufficient to meaningfully reduce HPV cancer disparities by county poverty. It is important to continue to increase HPV vaccination in all populations, but the US will also need a multi-faceted approach to address screening,
Introduction
Wide geographic disparities characterize cancer across the US, with people living in high-poverty areas more likely to be diagnosed with, and die from, numerous preventable cancers.1,2,52
Some of largest disparities between low- and high-poverty areas are for cancers associated with human papillomavirus (HPV).1 Residents of high-poverty areas are nearly twice as likely to
develop and die from cervical cancer as individuals in low-poverty areas.1,2 Incidence of
HPV-associated penile, anal, vaginal, vulvar, and oropharyngeal cancer are also 30-80% higher for those living in high-poverty areas.1 Geographic inequities in HPV cancer are complex and have
been attributed to multiple, overlapping risk factors, including prevalence of higher risk HPV types and lower use of cervical cancer screening that can detect abnormalities at an earlier pre-cancerous stage.3,4,53
In 2006, the introduction of HPV vaccine created an important new opportunity for cancer prevention, with the most recent formulation protecting against seven oncogenic types of HPV along with two types that cause genital warts.5 HPV vaccination has unprecedented potential to
reduce the incidence of six cancers attributable to HPV most of which do not have effective screening options.54,55 Further, HPV vaccination has the potential to reduce disparities in cancer
outcomes by providing accessible prevention at a low out-of-pocket cost.56 The potential benefits
of HPV vaccine are so promising that several research and advocacy organizations believe the eradication of cervical cancer may be an achievable goal in the US.6,8,9 Whether this goal is
equally achievable across high- and low-poverty areas remains unclear.
To date, several studies have shown that HPV vaccine initiation is higher in high-poverty areas11,57,58, but the long-term implications of this higher uptake for cancer disparities remains
US as whole, potentially missing important geographic heterogeneity in HPV prevalence, cervical cancer screening rates, and pre-vaccine cancer incidence.17,47,54 This study uses a
dynamic infection model, incorporating area-specific contextual factors, to understand the long-term implication of current HPV vaccination patterns on HPV cancer incidence for low- and high-poverty counties in the US.
Methods
We used a dynamic infection model of HPV infection, transmission, and progression to cancer to reflect HPV transmission dynamics and cancer incidence. We incorporated inputs specific to both high-poverty and low-poverty counties to produce realistic reflections of both settings. We created a simulated population of one million heterosexual individuals and then used data on HPV vaccination to project forward the future cancer incidence in both a
hypothetical high-poverty and hypothetical low-poverty county over a 75-year time horizon. HPV Transmission Model
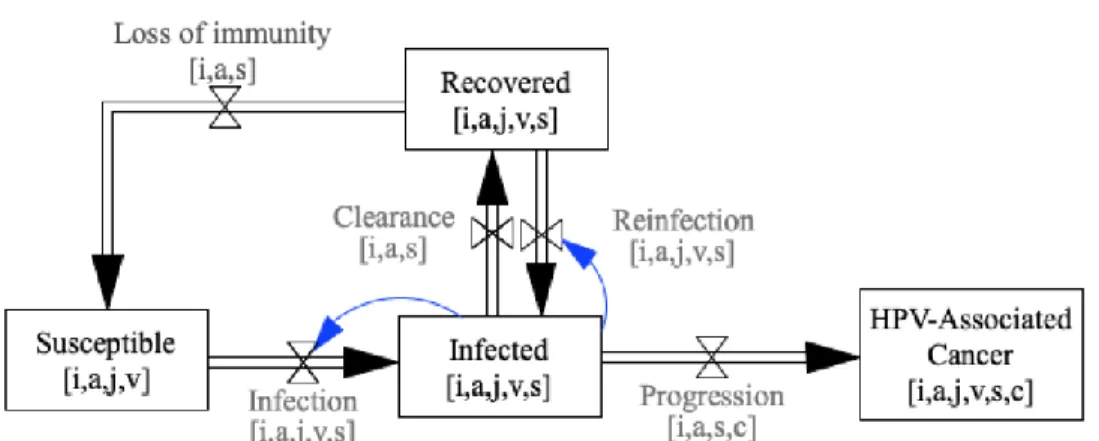
We first developed a dynamic HPV transmission model using a susceptible-infected-recovered-susceptible framework (Figure 2).59 The model describes separately the transmission
and progression of seven types of oncogenic HPV which are vaccine protected (HPV 16, 18, 31, 33, 45, 52, and 58) and a combined measure of all other high-risk HPV types. HPV cancers included in the model are cervical, vaginal, vulvar, penile, anal and oropharyngeal cancer. Parameters describing sexual transmission of HPV, the natural history of HPV cancers, vaccine efficacy, and natural immunity among those who cleared an HPV infection were derived from a review of the literature.14,17,27,60
Surveillance, Epidemiology and End Results Program 2005)62. Additional information on model
calibration approach is provided in the technical appendix. Model Inputs by Poverty Quartile
We divided US counties in quartiles based on percent of residents living below 100% of the Federal Poverty Level (FPL), using the 2010 American Community Survey.63 Descriptive
characteristics of counties in high- and low-poverty quartiles appear in Table 1. We matched the highest and lowest poverty quartiles with county-level data on fertility rates (among women age 15-44) and sex- and age-specific mortality rates from the CDC Wonder database.64 Estimates of
cervical cancer screening specific to high- vs. low-poverty counties came from a review of the literature.65 We used the National Immunization Survey—Teen to produce National estimates of
HPV vaccination rates by age, sex, and year.66 We then modified these estimates to represent
high- and low-poverty counties based on literature estimates of the relative risk of vaccination by area poverty.11,58,67 While several studies examined HPV vaccine initiation, few examined
completion of the full series. We use an estimate from a single study which finds no difference by area poverty in completion of subsequent HPV vaccine doses58, however we examined the
effect of both higher and lower vaccine follow-through in sensitivity analysis.
We incorporated poverty-specific population parameters, cervical cancer screening parameters, and starting HPV prevalence data into the dynamic transmission model to create separate high- and low-poverty models. HPV infectivity and natural immunity parameters were fixed at values used for the national model, as these are unlikely to vary significantly across counties, but sexual behavior, sexual assortiveness, and cancer progression variables were varied to calibrate each model to final HPV prevalence and cancer incidence data specific to each poverty quartile.
Analysis
We ran models representing both low- and high-poverty counties starting in 2005. Year, sex, and age-specific vaccination data were used to model uptake of HPV vaccine in each county. After 2017, we projected vaccination rates assuming annual rates of vaccine initiation and completion remain similar to their 2017 rates in future (Figure 3). We ran models using a simulated population of one million individuals per county using monthly time steps for 75 years. We report annual age-adjusted HPV cancer incidence, as well as HPV cancers by sex and cancer site.
While the vaccine has very high efficacy when all doses are delivered on schedule68,69,
the efficacy of partial series completion remains uncertain.70–72 In base case analysis we assume
Results
Our model projects that current HPV vaccination rates will result in a dramatic reduction in HPV cancers over 75 years in both low- and high-poverty counties, with a projected 40.9% reduction in annual HPV cancer incidence for the low-poverty and a 42.0% reduction for the high-poverty setting (Figure 3). However, the relative risk of HPV cancer for a high-poverty relative to a low-poverty county is 1.51 in 2006 and is projected to decrease only slightly to 1.46 by the end of the 75-year period.
For men, we project that overall HPV cancer disparities will increase slightly (from 1.53 RR to 1.54 RR; Figure 5). By site, we find that while incidence of each HPV is projected to decline, there will be a slight increase in oropharyngeal cancer disparities (from 1.56 RR to 1.57 RR), a slight decrease in anal cancer disparities (from 1.66 RR to 1.49 RR), and a moderate decrease in penile cancer disparities (from 1.40 RR to 1.38 RR).
We vary key model inputs in one-way sensitivity analysis to assess the effect these characteristics have on our projections (Table 4). Over a shorter time horizon, reductions in HPV cancer disparities for high vs. low settings are projected to be smaller, with a 1% reduction after 25 years (a total reduction of 0.8 excess cases per 100,000) and a 4% reduction after 50 years (a total reduction of 2.3 excess cases per 100,000). When varying assumptions around the efficacy of partial series completion, our estimates remain stable. If those who initiate but fail to complete the HPV vaccine series receive no protection from the partial series, overall HPV cancer
incidence after 75 years would be slightly higher, but the relative reduction in disparities remains the same (5%). Similarly, if protection is provided by at least one dose of HPV vaccine, both low- and high-poverty counties see further reductions in HPV cancer incidence but the relative reduction in disparities remains at 5%.
Discussion
Using dynamic transmission models, we find that that current vaccination patterns are projected to result in little or no reduction in HPV cancer disparities in high- vs. low-poverty counties. This finding is robust to changes in vaccine initiation and follow-through as well as changing assumptions about protection from an incomplete HPV vaccine series. While the magnitude of decrease varies as these inputs change, we find all of our scenarios result in a reduction in disparities by area poverty but none of our scenarios suggest this gap will fully close or even significantly reduce within the next 75 years.
Reducing cancer disparities following the introduction of a new technology is relatively unique, as breakthroughs in cancer treatment and prevention often exacerbate existing
inequity.74,75 However, numerous studies suggest higher uptake of HPV vaccine among
traditionally underserved groups.11,76,77 Burger and colleagues have projected HPV vaccination
to similarly reduce, but not eliminate, racial/ethnic disparities in HPV cancers.45 High uptake
among traditionally underserved populations may be a result of numerous programs and policies designed to provide HPV vaccine at little or no out-of-pocket cost.78 Some have also suggested
provider risk perception may play a role, as provider recommendation is the strongest predictor of vaccine receipt and providers may offer more frequent and stronger recommendations for patients they perceive risk to be at higher risk.79–81
Yet, we find disparities in cancer incidence are likely to persist with a sizeable decrease in absolute magnitude but only a small change in the relative gap between high- and low-poverty counties. Consistent with the foundation work of Phelan and Link, contextual factors dominate even in the presence of effective interventions.82,83 High-poverty counties have fewer resources
cancer risk.84,85 Due in large part to poor access, women in high-poverty areas have lower use of
cervical cancer screening which may serve as important secondary prevention of cervical cancer.65,86 Those living in high-poverty settings are also more likely to have other risk factors
for HPV cancers, including higher smoking rates, higher parity, and co-ocurring sexually transmitted infection.87–90 Further, high-poverty counties have a disproportionate representation
of HPV types not protected against by current vaccines. Therefore, cancer control efforts should continue to focus on the full continuum of cancer prevention and control in order to ensure equity.50
both low- and high-poverty settings. We also note that we are among the first studies to provide insights on the potential impact of partial series completion- an important contribution given recent changes in vaccination schedules and a consistent gap between HPV vaccine initiation and completion rates.10,91
Conclusion
In addition to its potential for cancer prevention, HPV vaccine offers an unprecedented opportunity to reduce the large and persistent disparities in HPV cancer between high- and low-poverty areas. Current vaccination rates are projected to reduce but not eliminate the higher incidence of HPV cancers in high-poverty areas relative to low-poverty areas. HPV vaccination alone is unlikely to achieve equity in HPV cancer, therefore policy-makers and advocates should adopt multi-component strategies which seek to increase HPV vaccination in all settings while also increasing access to screening and primary care and addressing underlying social
Tables and Figures:
Table 1: Characteristics of Low- and High-Poverty Counties
Characteristics Low-poverty High-poverty
Mean (sd) n=785 n=785
Percent <100% FPL 9.3% 25.1%
(1.9) (5.0)
County Population 107,273 59,784
(225,774) (191,592)
Percent Black 3.3% 19.1%
(6.0) (21.4)
Percent Asian 1.8% 0.8%
(3.9) (1.4)
Percent Native American 1.0% 3.9%
(3.1) (13.2)
Percent Native Hawaiian/Pacific Islander 0.1% 0.1%
(0.6) (0.1)
Percent Hispanic 7.1% 9.9%
(9.1) (18.1)
Percent of County Living in a Rural Area 52.7% 77.4%
(49.9) (41.7)
Percent Unemployed 3.3% 5.6%
(6.9) (5.4)
Percent White Collar Employment 35.2 28.1
(1.4) (2.1)
Area Deprivation Index 83.2 114.1
(20.8) (18.1)
Income Disparity 2.08 3.47
(.396) (.401)
Table 2: Input Data by Poverty Quartile
Low-poverty High-poverty Relative Risk
High vs. Low-poverty
Source(s)
Fertility Rate
(births per 1,000 women age 15-45)
65 74 CDC Wonder64
Mortality Rate (Deaths per 100,000)
Males Females Males Females CDC Wonder64
<10 534 616 912 1088
10-13 12 14 15 25
14-17 28 61 33 109
18-24 53 142 64 198
25-34 72 167 138 257
35-44 125 207 275 399
45-54 282 434 541 810
55-64 585 949 983 1,642
65-74 1,394 2,035 1,923 2,972
75-84 3,870 5,304 4,671 6,497
85+ 13,500 15,434 14,126 15,993
Cervical Cancer Screening Up-to-date
0.82 [0.80- 0.85]
Coughlin 200665
HPV prevalence by type (among women age 18-64)
NHANES 2003-2006, ACS 201061,63
HPV 16 4.3% 4.8%
HPV 18 1.8% 2.0%
HPV 31 1.7% 1.8%
HPV 33 1.0% 1.1%
HPV 45 1.5% 1.7%
HPV 52 2.5% 2.7%
HPV 58 0.9% 1.1%
Other HR types 9.6% 10.2%
HPV vaccine initiation (ages 11-17)
1.16 [1.08- 1.42]
Henry 2016, Henry 2018, Pruitt 201011,58,67
HPV vaccine follow-through (ages 11-17)
1.0
[0.84- 1.16] Henry 2016
Table 3: HPV Cancer Incidence by Sex, Site, and County Poverty Quartile
Year 1- Incidence Year 75- Incidence
Female High Poverty
Low
Poverty Relative Risk
High Poverty
Low
Poverty Relative Risk
Disparity Reduction
Cervical 9.3 5.1 1.82 3.5 2.0 1.74 8%
Vulvar 1.9 1.2 1.58 0.8 0.5 1.46 12%
Vaginal 0.7 0.5 1.65 0.1 0.1 1.36 29%
Oropharyngeal 8.1 5.7 1.42 5.2 3.6 1.44 -2%
Anal 1.9 1.5 1.30 1.4 1.1 1.33 -3%
All female cancers 21.9 13.9 1.57 11.0 7.3 1.51 6%
Male
Penile 0.6 0.3 1.66 0.2 0.1 1.49 17%
Oropharyngeal 7.8 5.0 1.56 7.0 4.5 1.57 -1%
Anal 2.0 1.4 1.40 1.3 1.0 1.38 2%
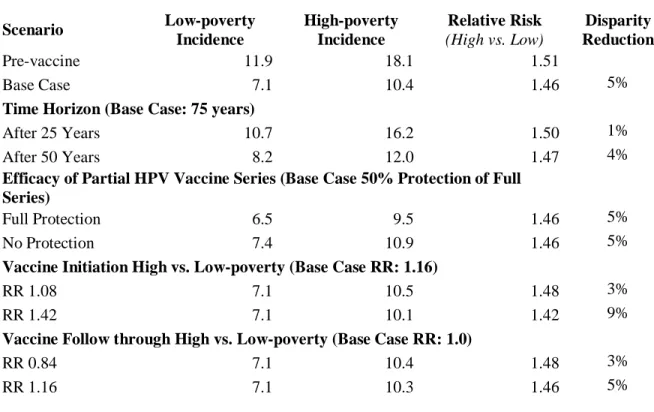
Table 4: Projected Reduction in HPV Cancer Disparity- Sensitivity Analysis
Scenario Low-poverty
Incidence
High-poverty Incidence
Relative Risk
(High vs. Low)
Disparity Reduction
Pre-vaccine 11.9 18.1 1.51
Base Case 7.1 10.4 1.46 5%
Time Horizon (Base Case: 75 years)
After 25 Years 10.7 16.2 1.50 1%
After 50 Years 8.2 12.0 1.47 4%
Efficacy of Partial HPV Vaccine Series (Base Case 50% Protection of Full Series)
Full Protection 6.5 9.5 1.46 5%
No Protection 7.4 10.9 1.46 5%
Vaccine Initiation High vs. Low-poverty (Base Case RR: 1.16)
RR 1.08 7.1 10.5 1.48 3%
RR 1.42 7.1 10.1 1.42 9%
Vaccine Follow through High vs. Low-poverty (Base Case RR: 1.0)
RR 0.84 7.1 10.4 1.48 3%
RR 1.16 7.1 10.3 1.46 5%
RR: Risk ratio; Incidence is annual age-adjusted HPV cancer incidence per 100,000 persons. Relative Risk
Figure 2: Model Overview
Summary of possible model states and transitions. Model states and transitions are separately calculated as represented above by sex (i), age (a), sexual activity category (j), HPV type (s), HPV vaccination status (v), and
Figure 3: Observed and Projected HPV Vaccine Uptake by Poverty Quartile
Figure 4: Projected HPV Cancer Incidence in High- vs. Low-Poverty Counties After Introduction of HPV Vaccine
Figure 5: Projected HPV Cancer Incidence, by Cancer Site: Females
Figure 6: Projected HPV Cancer Incidence, by Cancer Site: Males
CHAPTER 3: THE COST-EFFECTIVENESS OF HPV VACCINATION IN LOW- VS. HIGH-POVERTY SETTINGS
Overview
Introduction: HPV vaccination has the potential to prevent six types of HPV cancer, greatly reducing future morbidity associated with these cancers as well as future costs associated with workup and treatment. However, studies of HPV vaccine cost-effectiveness have only used national data, ignoring potentially important heterogeneity in pre-vaccination cancer prevalence, screening behavior, and risk factors.
Methods: We created a dynamic transmission model of HPV infection and progression and populated it with inputs representing low- and high-poverty US counties. We incorporated poverty-specific differences in HPV prevalence as well as cervical cancer screening, competing mortality, and historic and projected HPV vaccine uptake. We evaluate a 10-percentage point increase in current vaccination rates in both types of counties and report total costs and benefits over a 75-year period as well as the incremental cost effectiveness ratio (ICER) for gains in quality adjusted life years (QALYs). Costs and QALYs are discounted at 3%.
reduction in HPV cancer incidence would be 4.4 cases per 100,000 at an incremental cost of $236,707, resulting in an ICER of $54,281. Sensitivity analysis found time horizon and discount rate were among the most influential model assumptions, with the cost-effectiveness of HPV vaccination severely diminished when considered over a shorter time or when future benefits were heavily discounted.
Introduction
Thehuman papillomavirus (HPV) vaccine was first released in 2006.93 Originally a
three-dose series, it was shown to provide near-complete protection against four types of HPV.94,95
Early modeling studies showed HPV vaccine is cost-effective for the prevention of genital warts and cervical cancer16,17, and it was recommended for girls ages 11-12, with catch-up vaccination
from 12-26.96 Subsequent studies showed protection against vulvar and vaginal cancers in
women20, as well as genital warts and anal cancers in men18,19, and in 2011 HPV vaccine was
routinely recommended for both boys and girls ages 11-12.21 In 2015, a new version of the
vaccine was introduced which protected against nine types - including types that together cause 90% of cervical cancers worldwide, as well as a significant portion of vaginal, vulvar, penile, anal, and oropharyngeal cancers.25 This new formulation was shown to be cost effective relative
to the quadrivalent formulation27,28 and was added to Advisory Committee on Immunization
Practices (ACIP) recommendations.26 The most recent change in ACIP recommendations
occurred in 2016, when a two-dose schedule was shown to be both efficacious29 and cost
effective31 and was recommended for boys and girl initiating the vaccine prior to age 15.97
Despite the clear evidence of benefits among both boys and girls, vaccine uptake has remained lower than targets. In 2017, only 65.5% of all adolescents had initiated the series and only 48.6% were up-to-date with all recommended doses.10 Further, there are wide geographic
difference in uptake across the US- with patterns notably different from those of many other preventive services.57,98,99 Studies suggest areas with higher proportions of population living in
poverty have higher initiation of HPV vaccine, a finding which may have important implications for disparities.11,58,67 Higher uptake in low resource areas also has implications for estimates of
on baseline HPV cancer prevalence, cervical cancer screening patterns, and HPV vaccine uptake.15,17,49 High-poverty counties have a greater baseline risk of cancer1,3, lower use of
preventive cancer screening65,86, and higher prevalence of numerous HPV cancer risk factors,
including smoking and co-occurring infections87–90- creating an environment which may result in
differential costs and benefits relative to lower poverty counterparts.
In a context of lower than expected uptake and changing HPV vaccine recommendations, it is important to re-evaluate the cost-effectiveness of increasing HPV vaccination within
heterogenous contexts across the US. We use area-level, poverty- specific data on HPV
prevalence, HPV cancer incidence, cervical cancer screening patterns, and HPV vaccine uptake to model the cost and benefits of increasing HPV vaccination rates in both a high-poverty and low-poverty setting over a 75-year period.
Methods
We examined the additional cost and cancer reduction associated with a ten-percentage point increase in HPV vaccination in both a high- and low-poverty county over a period of 75 years using a societal perspective. To assess this difference, we used a dynamic model of HPV infection that accounts for county-specific differences in HPV cancer incidence, HPV
prevalence, cervical cancer screening behavior, and baseline HPV vaccination. We followed best practices for modeling of dynamic systems, as recommended by the International Society for Pharmacoeconomics and Outcomes Research.100
Dynamic Transmission Model
type shown to be oncogenic (HPV 16, 18, 31, 33, 45, 52, and 58) and one combined measure of all other high-risk HPV type. We described HPV transmission using sex transmission dynamics in a strictly heterosexual population following an overall model structure similar to that used in previous studies of HPV vaccination15,17,27 using transmission and progression inputs from the
literature.14,17,27,60 Model outcomes included six HPV cancers; cervical, vaginal, vulvar, penile,
anal, and oropharyngeal. Full model details can be found in the technical appendix. Poverty-Specific Model Inputs
Data from the American Community Survey were used to divide counties into quartile by percent of the county living below the Federal Poverty Level.63 Counties in the highest and
lowest quartile of poverty were matched to data from CDC Wonder on fertility rates (among women 15-44) and mortality rates (by sex and age) to produce average inputs for each model.64
Estimates of up-to-date cervical cancer screening by county poverty were derived from past studies.65 A multi-step calibration was performed by generating 10,000 sets of parameters from
plausible ranges of uncertain variables using Latin Hypercube sampling,101 testing
goodness-of-fit against calibration targets using mean square error, and retaining the best goodness-of-fitting parameter set. HPV transmission variables were first calibrated to poverty-specific estimates of pre-vaccination data on HPV prevalence, derived from the 2003-2006 National Health and Nutrition
Examination Surveys (NHANES).61 Once these inputs were determined, progression parameters
for each cancer site were calibrated to poverty-specific data on cancer incidence.1,62
covered types.25 However, previous studies have varied widely in their assumptions regarding
protection for those who initiate but do not complete the full HPV vaccine series.15,17,49 In our
base case, we assume that those who initiate but fail to complete the HPV vaccine series have 50% of the full vaccine efficacy, however we also examine full protection and no protection from an incomplete series.
Cost and Utility Data
Data on HPV vaccine cost – including cost for each HPV vaccine dose, wastage cost, and travel time were derived from previous studies15,17,49 and updated to 2018 dollars using the
consumer price index.102 Estimated average treatment costs for each HPV cancer were also
updated to 2019 dollars. To assess effectiveness of HPV vaccine, we applied an age-specific quality-adjusted life year (QALY) decrement for each HPV cancer outcome.60 Both costs and
quality-adjusted life years were discounted at a rate of 3% per year according to best practices.103
A summary of cost and QALY inputs is provided in Table 5. Analysis
High- and low-poverty models were run for a 100-year stabilization period to produce realistic estimates of pre-vaccine HPV prevalence and HPV cancer incidence rates. To assess the cost and effectiveness associated with increasing HPV vaccination, we modeled a ten
per HPV cancer averted and incremental cost per QALY gained. We compare the ICER for QALYs gained to standard willingness-to-pay thresholds of both $50,000 and $100,000.103
We further examined our results with several sensitivity analyses. Firstly, we report outcomes at shorter time horizons, including both 25 and 50 years. We also modified the discount rate to a low of 0% (undiscounted) and a high of 6%. We examined a range of HPV vaccination costs by varying our base estimates for cost of HPV vaccine, administration, and patient time up or down by 25%. To examine assumptions around protection from an incomplete HPV vaccine series, we report outcomes under both extremes of this variable- firstly a model in which no protection is provided by an incomplete HPV vaccine series (0% efficacy) and
secondly a model in which an incomplete series provides identical protection to an incomplete one (100% the efficacy of a full series). Finally, as some evidence suggests one HPV vaccine dose could be sufficient for protection104, we assess the effect of a single-dose vaccine regimen
over a 75-year period, which assumes identical efficacy for a single-dose vaccine but assumes only the cost of a single dose of HPV vaccine. All analysis was performed using R (version 5.3.4).73
Results
in terms of QALYs gained (7.5 per 100,000) as well as a lower total cost over 75-years
($221,494 per 100,000). While both counties would be below a willingness-to-pay threshold of $50,000 per QALY gained, the ICER associated with HPV vaccination in a high-poverty county would be nearly half that of a low-poverty county at $29,482 per QALY gained.
Comparing outcomes by sex and cancer site, our estimates show that this benefit would be concentrated largely in additional female cancers averted, with a projected reduction of 6.0 HPV cancers per 100,000 in high-poverty and 3.8 HPV cancers per 100,000 in low-poverty counties over 75 years. Among males, reductions would be smaller and more similar across county settings, with a projected 0.7 fewer HPV cancers per 100,000 in a high-poverty and 0.6 fewer HPV cancers in a low-poverty setting. (Table 7)
In sensitivity analyses, we first considered the time over which both costs and benefits were measured. (Figure 6) The cost-effectiveness of vaccination was diminished over a shorter time horizon- with an ICER of $87,784 for high-poverty county and $145,662 for a low-poverty county when costs and benefits are only considered over 25 years. A ten-percentage point increase in HPV vaccination would be associated with fewer than one additional HPV cancer averted per 100,000 persons in either setting over a 25-year period. When considering benefits over 50 years, cancer reductions are larger and ICERs are $29,482 and $63,352 per QALY gained for a high and low-poverty county, respectively. Finally, when increasing our time horizon to 100 years, additional improvements would be seen relative to a 75-year time horizon with ICERs of $27,498 per QALY gained in high-poverty and $46,069 per QALY gained in low-poverty counties.
equally over time (a discount rate of 0%), the cost-effectiveness of the vaccine would be
improved in both settings, to $9,774 per QALY gained in a high-poverty county and $19,745 per QALY gained in a low-poverty county. Increasing the discount rate to 6% per year resulted in both county types moving above a $50,000 per QALY gained willingness-to-pay threshold ($67,795 per QALY gained in a high-poverty county and $107,933 per QALY gained in a low-poverty county).
When changing model cost inputs, we found that even large changes in cancer treatment costs (+/- 50%) resulted in relatively small changes in cost-effectiveness (less than 15% change in the ICER estimate) due to the highly delayed nature of these outcomes. However, changes in costs for each HPV vaccine dose, administration, and patient time had a relatively large effect on vaccine cost-effectiveness. We test a range of cost per dose from $150 to $250. For high-poverty counties this produced a range of ICERs from $20,004 to $38,117 per QALY gained (Figure 7), while for low-poverty counties this produced ICERs that ranged from $35,031 to $63,279 per QALY gained.
Changing assumptions around partial series completion also had potentially meaningful effects on cost-effectiveness estimates. If initiating but failing to complete the series offers no additional protection, ICERs for high- and low- poverty counties would be $38,589 and $65,403 per QALY gained over 75 years. If those who start but fail to complete the series receive full protection, HPV vaccine was more cost effective with an ICER of $26,491 for a high-poverty county and $45,271 for a low-poverty county.
gained in high-poverty counties and an ICER of $25,411 per QALY gained in low-poverty counties.
Discussion
National estimates likely underestimate the cost-effectiveness of HPV vaccination in high-poverty counties and overestimate the cost-effectiveness in low-poverty counties. Despite higher uptake at present in high-poverty settings, we find that increases in vaccination would still produce larger reductions in HPV cancers in high-poverty settings than in low-poverty settings- most notably through reductions in cervical cancers. Our base case estimates suggest HPV vaccination is cost-effective in both settings- therefore broad efforts to increase vaccination should continue. However, existing strategies for increasing HPV vaccination are associated with additional costs for outreach or implementation, which likely increase as the unvaccinated
population becomes smaller.22,105 Thus, the cost-effectiveness of HPV vaccination has larger
implications, suggesting how much programs to increase HPV vaccination could spend on such efforts while maintaining the overall cost-effectiveness of the program.
We note that estimates of the cost-effectiveness of HPV vaccination in each setting are sensitive to changes in model inputs. Most notable among these are changes in the time horizon over which costs and benefits are allowed to accrue and assumptions about the rate at which future outcomes (both costs and benefits) are discounted relative to immediate outcomes. In the case that decision makers choose to not consider or heavily discount long-term outcomes, the cost-effectiveness of vaccination is less clear.
changing HPV vaccination recommendations over time. Firstly, we examine the cost-effectiveness of increasing uptake of the nine valent HPV vaccine which protects against additional types beyond those considered in early studies, improving long-term cancer prevention.27,37 Secondly, we consider the two-dose schedule, which results in substantially
lower vaccine dose costs and higher follow-through compared to the three-dose schedule.106
The cost-effectiveness of HPV vaccination may continue to improve as new vaccines cover more types, as more cancers are connected to HPV infection, and as dosing schedules or vaccine costs change. We provide insight into the implications of a single-dose vaccine- a policy change which many see as a next step in HPV vaccination.104 In the case that only one dose of
HPV vaccine is sufficient for protection, there would be a large reduction in upfront cost with little or no change in long-term benefits, further improving the potential cost-effectiveness of HPV vaccination.
There are several limitations to our modeling approach that should be considered. Firstly, we model average effects by county poverty quartile, which may miss heterogeneity of
in both counties.107 However, data on prevalence by county is insufficient to suggest whether
this change would be differential by setting.
Our modeling approach also has notable strengths, including the use of poverty-specific estimates of pre-vaccination HPV cancer incidence and HPV prevalence as well as HPV vaccination rates. We also provide insights on the implications of poor vaccine follow-through rates by showing how cost-effectiveness changes as assumptions around the efficacy of partial series completion changes- an assumption not varied in previous modeling studies.
Conclusions
Tables and Figures
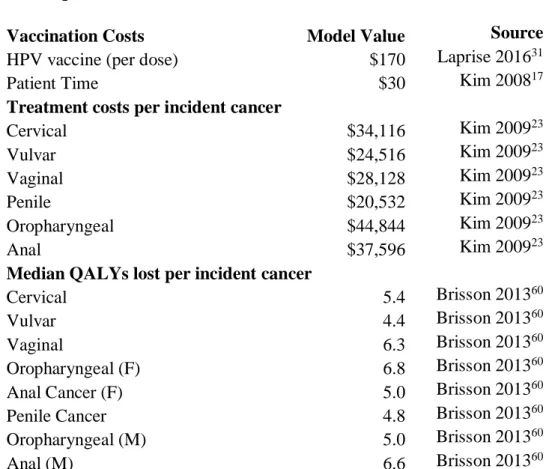
Table 5: Model Inputs
Vaccination Costs Model Value Source
HPV vaccine (per dose) $170 Laprise 201631
Patient Time $30 Kim 200817
Treatment costs per incident cancer
Cervical $34,116 Kim 200923
Vulvar $24,516 Kim 200923
Vaginal $28,128 Kim 200923
Penile $20,532 Kim 200923
Oropharyngeal $44,844 Kim 200923
Anal $37,596 Kim 200923
Median QALYs lost per incident cancer
Cervical 5.4 Brisson 201360
Vulvar 4.4 Brisson 201360
Vaginal 6.3 Brisson 201360
Oropharyngeal (F) 6.8 Brisson 201360 Anal Cancer (F) 5.0 Brisson 201360 Penile Cancer 4.8 Brisson 201360 Oropharyngeal (M) 5.0 Brisson 201360
Anal (M) 6.6 Brisson 201360
Table 6: Costs and Cancer Reduction Associated with Increasing HPV Vaccination in Low and High-Poverty Counties
High-poverty Counties
Low-poverty Counties
Incremental costs $ 221,494 $ 236,707
QALYs gained 7.5 4.8
Cost per QALY $ 29,482 $ 49,854
Cancers averted 6.7 4.4
Cost per cancer case averted $ 33,145 $ 54,281
Table 7: HPV Cancers Averted From a Ten Percentage-Point Increase in HPV Vaccine Uptake, by Sex and Cancer Site
Female
High-poverty counties
Low-poverty counties
Cervical 2.6 1.5
Vulvar 0.5 0.3
Vaginal 0.3 0.2
Anal 0.5 0.3
Oropharyngeal 2.2 1.5
All female cancers 6.0 3.8
Male
High-poverty counties
Low-poverty counties
Penile 0.2 0.1
Anal 0.5 0.3
Oropharyngeal 0.04 0.1
All male cancers 0.7 0.6
Figure 7: Effect of Changing Time Horizon on ICER Estimates and Cancers Averted
Figure 8: Sensitivity of ICER to Changes in Key Model Inputs
*Changes the relative protection associated with initiating HPV vaccine but failing to complete all recommended doses
CHAPTER 4: ECONOMIC EVALUATION OF STRATEGIES TO INCREASE HPV VACCINATION
Overview
Introduction: HPV vaccine offers substantial benefits for cancer prevention, yet vaccination rates still remain well below national targets. To achieve goals for long-term reductions in HPV cancer incidence, it is important to identify cost-effective methods for increasing HPV vaccine uptake.
Methods: We used a dynamic infection model of HPV transmission and progression to estimate HPV cancer incidence over a 50-year period following a one-time, state level
implementation of three simulated interventions for increasing HPV vaccination. Interventions compared were centralized reminder/recall, school-located vaccination, and the Center for Disease Control’s provider-focused intervention, Assessment, Feedback, Incentives, and
eXchanges program (AFIX). Interventions were modeled based on literature estimates of reach, effectiveness, and per-person cost. Outcomes included additional individuals vaccinated, cancers averted, and quality-adjusted life years (QALYs) gained. Probabilistic sensitivity analysis varied all parameters simultaneously to assess a range of plausible outcomes associated with each intervention.
vaccination resulted in the greatest projected increase in vaccination (25,493 additional individuals vaccinated), reduction in HPV cancer (327 cases averted vs. no intervention) and increase in quality of life (1,044 QALYs gained vs. no intervention) at a cost that was below a $50,000 per QALY-gained willingness-to-pay threshold (WTP) when compared to all
alternatives. Probabilistic sensitivity analysis using a WTP of $50,000 per QALY gained suggested school-located vaccination was preferred in 93.7% of all scenarios, reminder/recall was preferred in 5.6% and AFIX was preferred in less than 1%.
Introduction
Human papillomavirus (HPV) causes significant morbidity and mortality in the US as the causal agent for nearly all cervical cancers as well as the majority of anal, penile, vaginal, vulvar, and oropharyngeal cancers.108 The 2006 introduction of HPV vaccine offered unprecedented
potential for reducing not only cancer mortality, but also incidence of many cancers attributable to HPV.55 The reduction in cancer incidence is expected to be particularly dramatic in cervical
cancer, leading the American Association of Cancer Research and other organizations to declare the eradication of cervical cancer an achievable goal.6,8,9 Yet, despite the potential benefits of
HPV vaccination, uptake remains low. In 2017, only 69% of girls and 63% of boys ages 11-17 had received at least one dose, and 50% of girls and 38% of boys were up-to-date with all recommended doses.10
A considerable literature has examined strategies to increase vaccination among children and adults, but less is known about effective strategies for doing so among adolescents.109,110
School entry laws have proven effective for several adolescent vaccinations, including tetanus-diphtheria-pertussis, meningococcal vaccine, and hepatitis B.111 Interventions proven to be
successful in other vaccination settings have been adapted and tested for increasing initiation and completion of HPV vaccine, including interventions to address barriers in access, as well as targeting both patient and provider factors.36 However, direct comparison of these interventions
for short-term vaccination uptake is limited, and no studies have explored the long-term implications of these interventions for cancer prevention.
To make progress towards the stated goal of eradicating cervical cancer, as well as to reduce the burden of other HPV-associated cancers, policy-makers and advocates are
guidance is needed on which strategies offer the highest reduction in HPV-associated cancers at the lowest relative cost. Our study uses a decision modeling approach to simulate, at a
population-level, three evidence-based interventions to increase HPV vaccination rates and assesses the long-term cost-effectiveness of each compared to no intervention, as well as to each other.
Methods
We created a compartmental, dynamic model of HPV infection, transmission, and progression to cancer in a heterosexual US population. We used this model to compare cost, cancer incidence, and quality-adjusted life years associated with a statewide implementation of each of three evidence-based interventions for increasing HPV vaccination vs. no intervention (vaccination as normal) over a 50-year time horizon. The study was conducted following best practices as described in the Consolidated Health Economic Evaluation Reporting Standards.112
Full model detail can be found in the technical appendix. HPV Transmission Model Overview
The model begins with 5,000,000 individuals – the median population size of a US state, stratified by sex and age to represent the US population.63 Individuals enter the model at age zero
according to estimated fertility rates and progress through eleven non-overlapping age groups where they may die of competing disease at age- and sex-specific mortality rates.64 Sexual
transmission of HPV is based on a Susceptible-Infected-Recovered-Susceptible framework59
age-specific rates to one of six HPV-associated cancer types (cervical, vaginal, vulvar, penile, anal, and oropharyngeal).
HPV vaccine has high efficacy against covered types when completed at the
recommended schedule,68,69 but the extent of protection when the series is partially complete
remains unclear.70–72 Therefore, we modeled three vaccination states; unvaccinated, vaccine
initiated, and vaccine completed, with the assumption that those who initiated but failed to complete the vaccine series receive only partial protection (50% of the efficacy values used for the full series). Sensitivity analysis examined complete protection (100% of the efficacy values used for the full series) and no protection when series was initiated but not completed.
Model Input Data
Model inputs were estimated directly from large national data sources when available and supported by literature estimates when necessary. Data on population age structure, births, and deaths were obtained from 2010 Census Data.63 Data on sexual behavior, type-specific
infectivity rates, and vaccine efficacy were obtained from existing HPV modeling
literature.14,17,27,60 Age- and type-specific HPV prevalence data were generated using
population-weighted estimates from the National Health and Nutrition Examination Survey (NHANES).61
Finally, data on HPV vaccine initiation and follow-through by age, sex, and year were derived from population-weighted, provider-verified estimates using the 2006-2017 National
Immunization Survey—Teen (NIS—Teen).66
Base case model inputs were varied in probabilistic model calibration to pre-vaccine HPV prevalence (NHANES) by type and age and HPV cancer incidence by sex, site, and age using estimates from the Surveillance, Epidemiology and End-Results Program (SEER).61,62