COLUMN STUDIES OF MICROPOLLUTANT REMOVAL FROM WASTEWATER
Will Stanley
A thesis submitted to the faculty of the University of North Carolina at Chapel Hill in partial fulfillment of the requirements for the degree of Master of Science in the Department of
Environmental Sciences and Engineering.
Chapel Hill
2014
Approved by: Howard S. Weinberg
ii
©2014 Will Stanley ALL RIGHTS RESERVED
iii ABSTRACT
Will Stanley: Column Studies of Micropollutant Removal From Wastewater (Under the direction of Howard S. Weinberg)
Production of systems for onsite treatment of wastewater is an expanding industry fostering more widespread application of reuse technology. This study evaluated the potential for constructed wetlands to remove micropollutants from industrial and household sources and, thereby, reduce their environmental impact resulting from toxicity, endocrine disruption, or physical interaction. Their removal during conventional treatment has been extensively studied, yet research on the performance of biofiltration and constructed wetlands in removing
micropollutants is scarce.
Through a column study scale model of a constructed wetlands onsite treatment system and parallel batch studies, the mechanisms by which micropollutants are removed were
iv
TABLE OF CONTENTS
List of Tables ... viii
List of Figures ... xii
List of Abbreviations ... xvi
1 - Introduction ... 1
1.1 Micropollutants as an Environmental Hazard ... 1
1.2 Dynamics Affecting Removal of Selected Micropollutants ... 3
1.3 Centralized and Onsite Wastewater Treatment ... 9
1.3.1 Projected Increase in Implementation ... 9
1.3.2 Emerging Regulation of Reuse Systems ... 13
1.4 Column and Batch Study Models... 13
1.5 Chemical and Biological Methods ... 15
1.6 Objectives………16
2 - Methods ... 19
2.1 Full-scale onsite system ... 19
v
2.2.1 Column system ... 20
2.2.2 Batch studies……….25
2.3 Inhibition of nitrification ... 26
2.4 Source water ... 27
2.5 Nomenclature for column system and batch study samples ... 29
2.6 Experimental timeline ... 30
2.6.1 Column study samples ... 30
2.6.2 Batch study samples ... 33
2.7 Sample analysis ... 34
2.7.1 Gas chromatography-mass spectrometry ... 34
2.7.2 Abraxis ELISA ... 39
2.7.3 Quantification using GraphPad Prism ... 41
3 – Results and Discussion ... 44
3.1 A, B, C and D column study sample series ... 44
3.1.1 Dissolved oxygen ... 45
3.1.2 Discussion of column system DO levels ... 45
3.1.3 Analysis of B and C-series samples ... 47
3.1.4 Discussion: SPE, GC-ECD and A, B and C-series samples ... 50
vi
3.2 E-series column study and Z-series batch studies ... 55
3.2.1 Series overview ... 55
3.2.2 Dissolved oxygen ... 57
3.2.3 Organic carbon in columns ... 58
3.2.4 TN in columns ... 59
3.2.5 Bioassay results ... 61
3.2.6 Discussion: E-series and Z-series samples ... 68
3.3 Discussion: Analytes as experimental controls ... 72
3.4 F-series column study and Y-series batch studies ... 76
3.4.1 Dissolved oxygen in columns and batches ... 77
3.4.2 Organic carbon in F and Y-series samples ... 78
3.4.3 TN in columns and batch studies ... 80
3.4.4 Bioassay results ... 82
3.4.5 Discussion: F and Y-series samples ... 93
3.5 G-series column study and X-series batch studies ... 96
3.5.1 Dissolved oxygen in columns and batches ... 97
3.5.2 Organic carbon in columns and batch studies ... 98
3.5.3 TN in columns and batch studies ... 100
vii
3.5.5 Discussion: G and X-series samples ... 112
4- Conclusions ... 115
4.1 Indications from results………115
4.2 Suggestions for future research ... …...119
Appendix A – Schematics of CCCC onsite wastewater treatment system ... 121
Appendix B – Photos of column system and batch studies ... 124
Appendix C – Dissolved oxygen ... 127
Appendix D – Nitrogen measurements ... 129
Appendix E – Microbiological analysis ... 133
Appendix F – Known addition in samples analyzed using chromatographic methods .. 136
Appendix G – Abraxis documentation ... 140
Appendix H – Application of Abraxis kits to wastewater samples ... 149
viii
LIST OF TABLES
1. Structure of CCCC onsite wastewater treatment system substrate. ... 19
2. Flow rate calculations relating column system to field installation ... 23
3. DO in column system, 2.16.11, 2.21.11, 3.2.11. ... 45
4. Estradiol results for B and C-series samples by Abraxis ... 48
5. Triclosan results for B and C-series samples by Abraxis ... 48
6. Triclosan results for B and C-series samples by GC-ECD ... 49
7. Identification of sample labels with batch treatments. ... 57
8. DO in column system, 6.2.11. ... 57
9. DO in batches, 5.30.11 and 6.1.11. ... 57
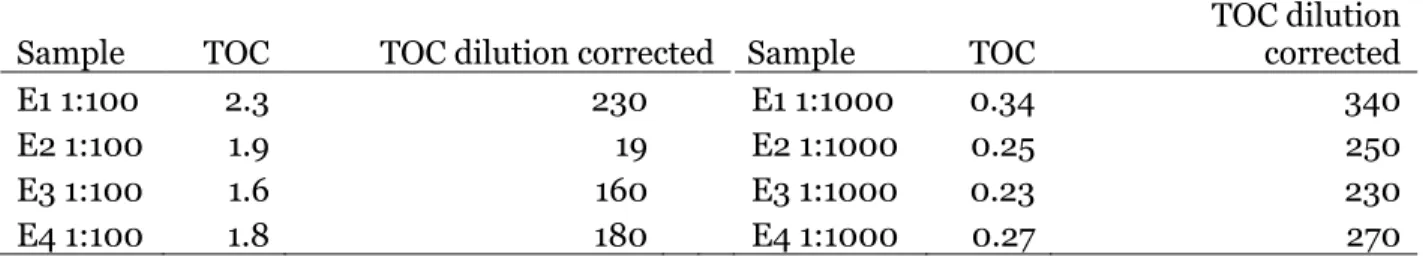
10. Organic carbon in E-series samples. ... 58
11. Interpretation of E-series TOC measurements. ... 59
12. TN results for two dilutions of E-series samples……… . 60
13. Interpretation of E-series TN measurements………60
14. E-series column system and Z-series batch study results from Abraxis analysis. ... 61
15. Dilution factors for E-series column system and Z-series batch study samples. ... 62
16. Interpretation of estradiol results for E-series samples. ... 65
ix
18. Interpretation of triclosan results for E-series samples. ... 65
19. Interpretation of estradiol results for Z-series batch studies. ... 66
20. Interpretation of caffeine results for Z-series batch studies. ... 67
21. Interpretation of triclosan results for Z-series batch studies. ... 68
22. Identification of sample labels with batch treatments. ... 77
23. DO in column system, 7.6.11. ... 77
24. DO in batches, 7.5.11. ... 78
25. Organic carbon in F and Y-series samples. ... 79
26. TN results for F and Y-series samples. ... 81
27. F-series column system and Y-series batch study results from Abraxis analysis. ... 83
28. Dilution factors for F-series column system and Y-series batch study samples. ... 84
29. Interpretation of estradiol results for F-series samples. ... 89
30. Interpretation of caffeine results for F-series samples. ... 90
31. Interpretation of triclosan results for F-series samples. ... 90
32. Interpretation of estradiol results for Y-series samples. ... 91
33. Interpretation of caffeine results for Y-series samples. ... 92
34. Interpretation of triclosan results for Y-series samples. ... 93
35. Identification of sample labels with batch treatments. ... 97
x
37. DO in batch studies, 7.29.11. ... 98
38. Organic carbon in G and X-series samples. ... 98
39. TN results for G and X-series samples. ... 100
40. G-series column system and X-series batch study results from Abraxis analysis. ... 103
41. Dilution factors for G-series column system and X-series batch study samples. ... 104
42. Interpretation of estradiol results for G-series samples ... 108
43. Interpretation of caffeine results for G-series samples. ... 109
44. Interpretation of triclosan results for G-series samples. ... 109
45. Interpretation of estradiol results for X-series samples... 110
46. Interpretation of caffeine results for X-series samples. ... 111
47. Interpretation of triclosan results for X-series samples. ... 112
48. Dissolved oxygen measurements in column system ... 127
49. Dissolved oxygen measurements in batch studies ... 128
50. Ammonia concentrations in D-series samples. ... 130
51. Nitrite concentrations in D-series samples. ... 130
52. Nitrate concentrations in D-series samples. ... 130
53. Estradiol results for B and C-series samples from Abraxis, with calibration points. 136
54. Triclosan results for B and C-series samples from Abraxis, with calibration points. 137
xi
56. Compiled Abraxis dilution factors ... 152
57. Comparison of drift-corrected results with "true" values ... 154
58. Consecutive readings of a test plate over time ... 154
59. Interpretation of estradiol known addition ... 156
60. Interpretation of caffeine known addition ... 156
61. Interpretation of triclosan known addition ... 157
62. Estradiol in filtered and unfiltered aliquots of C4 US-1. ... 160
xii
LIST OF FIGURES
1. Pathways of pharmaceutical residue release to the environment
(adapted from Heberer 2002). ... 1
2. Agonism and antagonism (McLachlan 2001) ... 3
3. Molecular structure of estradiol ... 6
4. Molecular structure of caffeine ... 7
5. Molecular structure of triclosan ... 8
6. "Monster" septic tank advertised in 1895. ... 11
7. Toxicity Identification Evaluation (TIE) system for an effects-based analysis of environmental samples (Petrovic et al. 2004) ... 15
8. Column system configuration ... 21
9. Wastewater sampling equipment. ... 27
10. CCCC onsite system pump tank. ... 27
11. CCCC pump tank with treatment system in background ... 28
12. Aerobic column uncapped to convert to unsaturated flow. ... 32
13. SPE using Phenomenex cartridges on a Supelco vacuum manifold. ... 34
14. Exhausted SAX cartridges and breakthrough to Strata X, 2.28.11. ... 37
15. Compromised Strata SAX cartridges and breakthrough to Strata X, 3.9.11 ... 37
xiii
17. Centrifuge and sample distributed into 40ml vials. ... 38
18. Transformation and fate of micropollutants in surface waters (Birkett and Lester 2003) ... 38
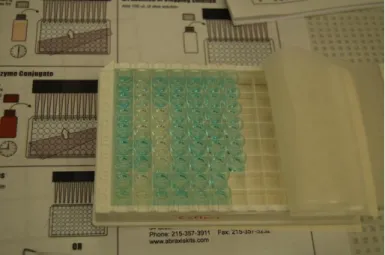
19. Addition of enzyme conjugate to wells. ... 39
20. Response visible after addition of color solution. ... 40
21. Final color is yellow following addition of stopping solution. ... 40
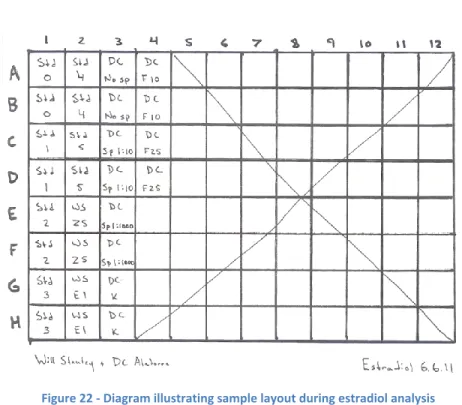
22. Diagram illustrating sample layout during estradiol analysis 6.6.11 ... 41
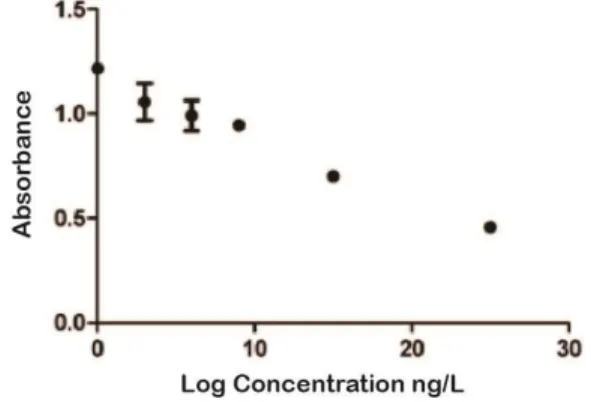
23. Plate reader reading from estradiol analysis on 6.6.11. ... 42
24. Untransformed standard curve data entered into GraphPad. ... 42
25. Log-transformed calibration curve points. ... 42
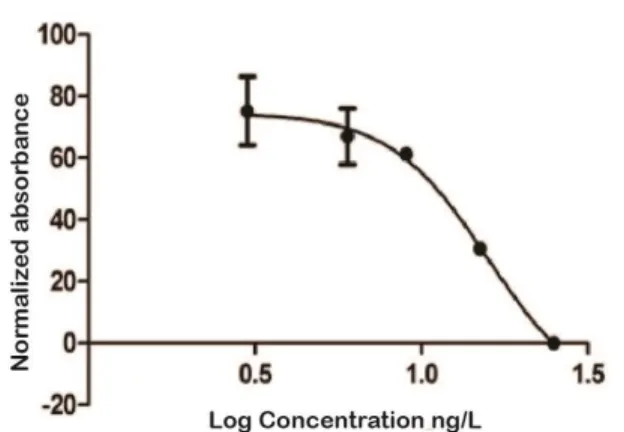
26. Normalized standard curve with dose-response (variable slope) curve fit. R2 = 0.9456. ... 43
27. Normalized absorbance readings used to interpolate concentration. ... 43
28. Estradiol results from Abraxis kits for B and C-series samples. ... 49
29. Triclosan results from Abraxis kits for B and C-series samples. ... 50
30. Triclosan results from GC-EDC for B and C-series samples. ... 50
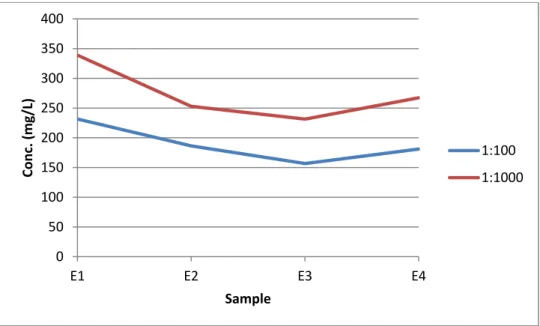
31. TOC results for two dilutions of E-series samples. ... 59
32. TN results for two dilutions of E-series samples. ... 60
33. E-series sample concentrations. ... 63
xiv
35. Steroid hormone and nonylphenol concentrations in successive
stages of onsite treatment. E1 = estrone. (Stanford and Weinberg 2010) ... 74
36. Generalized dose-response curve. ... 75
37. TOC data from F and Y-series samples. ... 80
38. TN results for FX.2 samples. ... 82
39. TN results for Y-series samples. ... 82
40. FX.1 sample concentrations. ... 85
41. FX.2 sample concentrations. ... 86
42. Y-series sample concentrations... 88
43. TOC data from GX.1 samples. ... 99
44. TOC data from GX.2 samples. ... 99
45. TOC data from X-series samples. ... 100
46. TN results for GX.1 samples. ... 101
47. TN results for GX.2 samples. ... 101
48. TN results for X-series samples. ... 102
49. GX.1 sample concentrations. ... 105
50. GX.2 sample concentrations. ... 105
51. X-series sample concentrations. ... 107
xv
53. Nitrite concentrations in D-series samples. ... 131
54. Nitrate concentrations in D-series samples. ... 132
55. HPC and FC medium in petri dishes. ... 134
56. Estradiol data for B and C-series samples from Abraxis, with calibration points. ... 138
57. Triclosan results for B and C-series samples from Abraxis, with calibration points. 138 58. Triclosan results for B and C-series samples from GC-ECD. ... 139
59. Abraxis standard curve variation over time. ... 153
60. Consecutive readings of a test plate over time. ... 155
61. Estradiol recovery following filtration and SAX treatment. ... 161
62. Caffeine recovery following filtration and SAX treatment. ... 162
xvi
LIST OF ABBREVIATIONS
AMO Ammonium Monooxygenase
AOB Ammonia-Oxidizing Bacteria
APE alkylphenol ethyloxylate
BACs Biologically Active Compounds
BAS Biologically Active Substances
BOD Biological Oxygen Demand
BSTFA bis(trimethylsilyl)-trifluoroacetamide
C Celsius
CCCC Central Carolina Community College
CFUs Colony Forming Units
DO Dissolved Oxygen
DOM Dissolved Organic Matter
E1 Estrone
E2 Estradiol
E3 Estriol
ECD Electron Capture Detector
EDCs Endocrine Disrupting Compounds
EE2 17-α ethinylestradiol
ELISA Enzyme-Linked Immunosorbent Assay
EPA Environmental Protection Agency
FC Fecal Coliform
GC-MS Gas Chromatography-Mass Spectrometry
xvii
HPC Heterotrophic Plate Count
LC-MS Liquid Chromatography-Mass Spectrometry
LGW Laboratory Grade Water
MtBE methyl tert-butyl ether
NPOC Non-Purgeable Organic Carbon
OD Outside Diameter
PE Polyethylene
PPCPs Pharmaceuticals and Personal Care Products
PSI Pounds per Square Inch
RPM Revolutions Per Minute
SAX Strong Anion Exchange
SPE Solid Phase Extraction
TDS Total Dissolved Solids
TIE Toxicity Identification Evaluation
TMCS trimethyl-chlorosilane
TN Total Nitrogen
TOC Total Organic Carbon
TSS Total Suspended Solids
UNC University of North Carolina
UV Ultraviolet
1
1. INTRODUCTION
1.1 Micropollutants as Environmental Hazards
Following the development of secondary treatment techniques for processing municipal-scale quantities of wastewater in the early 20th century, treatment plants were widely
implemented prompted in part by the federal mandates contained in the Water Pollution Control Act of 1948 (Burian et al. 2000). These greatly reduced the impact household and commercial effluents had on receiving surface waters in terms of biological oxygen demand (BOD) and nutrient enrichment, factors that significantly disrupt ecological systems (Clark et al. 1991). Wastewater treatment has been optimized largely with regards to these parameters (Schmidt et al. 2003; Suarez et al. 2010). Across the world, the effluents from such treatment are discharged into water bodies that are often upstream of a drinking water treatment plant intake.
Trace
contaminants in sources of drinking water constitute an ongoing public health threat, the severity of which is largely unknown. In the 1990s concerns emerged regarding the potential effects of low
2
pharmaceuticals, industrial chemicals and other biologically active compounds (BACs) in drinking water (Crews et al. 2000). A primary source of these contaminants is effluent
discharged from wastewater treatment plants, which is diluted to a variable extent with surface water and subsequently feeds back into drinking water production, as depicted in Figure 1. Removal efficiencies for BACs during wastewater or drinking water treatment range from total elimination, or at least transformation for some, to negligible reduction for others depending on the chemical’s properties and the specific treatment technologies employed (Buser et al. 1999; Buerge et al. 2003; Ying and Kookana 2007; Cajthaml et al. 2009).
The environmental hazard presented by these chemicals is difficult to assess. Established methods for quantifying biological effect have been found to be inapplicable to this problem because even at levels substantially lower than the minimum dose where toxicity is observed, endocrine disruption can produce a biological response impacting development and
reproductive system functionality (Sumpter and Johnson 2005; Campbell et al. 2006). Demonstrated reproductive effects from exposure to endocrine disruptors in certain fish and amphibians have led to those species being considered as pollutant indicators for screening purposes (Hutchinson et al. 2000). However, these species are subject to highest pollutant exposures in wastewater treatment plant effluent and are often visibly impacted, but may not be sensitive to low-level exposures, and perhaps, therefore, not be predictive of impacts to other types of organisms (Ashby et al. 1997). Ongoing biological effects research is needed to guide policy and define hazardous exposure levels. At present, the only way to be certain that residual chemicals are not manipulating ecosystems and health would be to remove them entirely from the environment.
It becomes necessary at this point to clarify the semantics involved in this subject area. The term endocrine disrupting chemical, or endocrine disrupting compound (EDC) was
3
that do not meet traditional definitions of toxicity. This would generally include any compound that interacts with the endocrine system, which is a signaling network within and between organisms. Substances called hormones secreted from glands travel to a remote receptor, which
selectively binds the hormone and a response is triggered. These signals are integral to the timing of reproductive system development, but are involved in many non-reproductive biological functions as well. Disruption can take place through suppression of a natural signal, either by inhibiting the functionality of the secretion gland of origin or by obstructing the receptor binding site. Alternatively, a disruptor may mimic the natural hormone or provoke production by the secreting gland and trigger a response that would not have occurred otherwise. The various modes of interference are depicted in Figure 2. These mechanisms would constitute negative or positive disruption, defining the compound as an antagonist or agonist, respectively (Heffner and Schust, 2010).
1.2 Dynamics Affecting Removal of Selected Micropollutants
There are many different types of receptors and corresponding hormones. One such combination that has been studied extensively in medical literature is the estrogen system, which is involved in reproductive system regulation. Estrogenic effects of endocrine disruptors have been studied extensively in the environmental health literature; these findings are certainly relevant but such studies should by no means be considered comprehensive in terms of
4
overly specific terms to refer to a more general topic under consideration, the phrases
biologically active substances (BASs) or biologically active compounds (BACs) have entered the common parlance to refer to potentially hazardous chemicals in the environment. Some
researchers attempt to divide these based on original usage, such as pharmaceuticals and personal care products (PPCPs) as opposed to residual components of industrial process effluents (Daughton and Ternes 1999). This distinction is relevant to policy and regulation, but may not have any significance with regards to potency or metabolic pathway and mechanism of effect (Joss et al. 2006). All the above subclassifications fall under the umbrella term
micropollutants due to the low concentrations (µg/L-ng/L) at which these compounds are typically present in the environment.
Since research on this topic began, the specifics of how individual compounds are degraded and rendered inert have been investigated through a variety of approaches. Correlations are observed between certain treatment conditions and relatively high removal rates at the treatment plant level (Cajthaml et al. 2009). This provides a starting point for identifying specific mechanisms by which individual compounds are transformed and/or degraded. As stated earlier, conventional wastewater treatment plants are designed to remove wastewater constituents that exert oxygen demand and supply nutrients to surface water causing algae blooms and leading to other ecologically deleterious consequences. These include carbon, nitrogen, phosphorus and total dissolved solids (TDS); inactivation of pathogens is another primary concern. Reducing these effects requires that wastewater is treated by solids separation and settling, through contact with microbial populations under aerobic and anaerobic conditions, and exposure to a disinfectant such as ultraviolet (UV) irradiation, chlorine or chloramine (Joss et al. 2008). Generally speaking, compounds are subject to
5
A serious concern in assessing the removal of BACs from wastewater is that they might not be removed during treatment but rather transformed to a daughter product that is also biologically active (Moriyama et al. 2004). A subset of the research generally concerned with occurrence of BACs has focused on their generation as disinfection byproducts during drinking water treatment, as a result of reaction of disinfectant with organic materials present in the source of drinking water production (Richardson et al. 2007). It is possible that analogous undesirable conversions take place during wastewater treatment resulting in equally or more hazardous effluent characteristics (Wu et al. 2009). Such transformation is liable to be undetected by traditional analytical methods that use chromatographic quantification as the technique is highly compound-specific. However, mass-spectrometry redeems the method in that it offers the capability to scan for non-targeted compounds and could allow for the
discovery of these products. Distinguishing between transformation to equivalently hazardous compounds and degradation to biologically inert products is an ongoing challenge to analytical capacity and effective prioritizing of risk.
6
Biological degradation of the steroid hormones estrone (E1), estradiol (E2), depicted in
Figure 3, the closely structurally related compound 17-α ethinylestradiol (EE2), and estriol (E3) during wastewater treatment has been an ongoing topic of research over the last decade (Cajthaml et al. 2009). Specifically, high rates of removal during wastewater treatment have been found to be closely correlated with exposure to aerobic environments (Froehner et al. 2011). In general, steroid hormones were found to be 75-100% removed by exposure to microbial oxidation under aerobic conditions for normally practiced contact time durations; under anaerobic conditions, removal efficiencies suffered and less than 75% removal was achieved (Cajthaml et al. 2009). Removal
rates were comparable between compounds with the exception
of EE2, which is more persistent. Another caveat is that E1 is actually a daughter product produced by degradation of
E2 (Das et al. 2004). Estradiol degradation can be
catalyzed by physical processes such as interaction with a sorptive substrate or by microbially-catalyzed decomposition, whereas estrone is mineralized through biotic processes exclusively. This dynamic can produce apparently low (even negative) removal efficiencies for estrone in the presence of estradiol that are in fact indicative of estradiol’s ability to add estrone to the system.
Steroid hormones are not typically present in wastewater at concentrations that could support a microbiological population exclusively relying on them for a carbon source. Therefore, a reasonable hypothesis is that their degradation is accomplished through cometabolism, i.e. consumption by microbia that primarily bind other substrates (Clouzot et al. 2008). Nitrifying bacteria, those that participate in the oxidation of ammonia and are, therefore, also referred to as ammonia oxidizing bacteria (AOB), are the subset hypothesized to be primarily responsible for the cometabolization of steroid hormones (Yi and Harper 2007, Suarez et al. 2010). The process by which ammonia is transformed into gaseous nitrogen takes place in two stages: nitrification, in which aerobic oxidation of ammonia to nitrite and/or nitrate occurs and
7
denitrification, which is the anaerobic mineralization of NO2- and NO3- to N2 (nitrogen gas) (Francis et al. 2007). AOB produce an enzyme called ammonium monooxygenase (AMO) that binds ammonia as well as other hypothesized metabolites. Nitrifiers’ involvement in the
microbial degradation of steroid hormones is consistent with the observed correlation between high rates of removal and aerobic conditions. Additionally, specific species of AOB have been isolated from various media including wastewater and observed to have the capacity to degrade estradiol (Ke et al. 2007; Ren et al. 2007; Yoshimoto et al. 2004).
Another common wastewater micropollutant that has enjoyed substantial attention in recent decades is caffeine. Caffeine is present at much higher concentrations in untreated wastewater, treated effluent, and receiving waters than steroid hormones and many
micropollutants. For this reason, combined with its solubility, exclusive origin in anthropogenic and specifically municipal wastes, and somewhat simpler quantification, caffeine has been investigated as an indicator of wastewater contamination in surface waters (Buerge et al. 2003).
Caffeine, whose structure is shown in Figure 4, is primarily removed through metabolic activity of microbes. Specialized microbial populations dedicated to catalyzing the mineralization of caffeine have been discovered in soil bacteria isolated from coffee plantations (Dash and Gummadi 2006a) as
well as in municipal wastewater treatment works (Ogunseitan 2002). These species are of interest in the biotechnology sector for their potential to decaffeinate coffee more effectively than is possible using current techniques (Dash and Gummadi 2006b). In matrices where caffeine concentrations are less extreme it is likely that cometabolism accounts for most of its removal. Caffeine has been found to be efficiently removed by conventional wastewater treatment plant processes that involve aerobic treatment stages; for example, 81-99.99% removals were observed in Swiss wastewater Figure 4 - Molecular structure of caffeine.
8
treatment plants (Buerge et al. 2003). Efficient treatment does not preclude readily detectable concentrations in surface water due to the high influent concentrations, and because losses from sewer systems and/or sewer overflows can contribute significantly to surface water
micropollutant loading (Buerge et al. 2006; Joss et al. 2008). In fact, caffeine concentrations have been used to perform mass balance calculations that approximate losses of untreated wastewater from sewer systems.
Triclosan is another common wastewater
contaminant of concern. Used widely as an antimicrobial agent in soap, cleaning agents and other products, triclosan has been measured in wastewater in the
hundreds of ng/L (Singer et al. 2002). The label triclosan is a commercial name for the chemical 2,4,4’-trichloro-2’-hydroxydiphenyl ether, shown in Figure 5, which has
a log Kow of 4.76, indicating that it can readily partition into non-polar phases. In surface waters exposed to sunlight, triclosan has been found to be converted to a structurally related type of dioxin, a potent toxin (Latch et al. 2003). Given that triclosan is extremely common in U.S. surface waters (Kolpin et al. 2002), and that up to 80% of triclosan loss may be attributable to photochemical transformation (Singer et al. 2002), this observation indicates that the release of triclosan may have serious environmental implications stemming from multiple modes of influence.
As might be expected from the fact that it was manufactured as a poison to microbes, triclosan interacts with wastewater treatment bacteria differently from steroid hormones and caffeine. While roughly 80% removal of triclosan has been attributed to biotic processes during treatment (Singer et al. 2002), bacteria that bind with triclosan are permanently inactivated, as opposed to catalyzing an energy-producing reaction that is repeatable (Roh et al. 2009).
9
Furthermore, as with steroid hormones, activity of nitrifying bacteria has been found to correlate with triclosan removal and isolated AMO have demonstrated the capacity to degrade triclosan (Stasinakis et al. 2008). Triclosan’s biocidal properties impact AOB and while triclosan activity is nullified in the process, an ongoing supply of triclosan to a nitrifying system could result in an impaired or depressed level of functionality with regards to primary treatment objectives, namely nitrification (Holt et al. 2010). Given the correlations that are hypothesized to exist between reduction in steroid hormone concentrations throughout wastewater treatment and AOB described above, an inhibitory effect produced by triclosan could negatively affect removal efficiencies of other micropollutants, such that triclosan acts as a system input rather than the subject of an engineered biological process.
1.3Centralized and On-Site Wastewater Treatment
1.3.1 Projected Increase in Implementation
There are numerous drivers for an increasingly decentralized yet sophisticated
wastewater treatment and management network, including growing interest in wastewater reuse in response to shortages in water supplies, facilitated removal of trace contaminants, and
inadequacy of current rural treatment technology. Development of technology amenable to implementation in such a network is an ongoing initiative, with a limited but growing consumer base.
If wastewater is to be reused onsite for non-potable purposes such as toilet flushing, irrigation, or cooling system water, then having to pipe that water to and from a central
10
rivers or groundwater aquifers are extremely restricted due to the scarcity of water resources, and so any technology that has the capacity to circumvent the conflict between users’ needs and in-stream minimum flow requirements is valuable. The other aspect of the arid water
management scenario is that scarce surface water provides a lesser dilution factor for
wastewater treatment plant effluent, which means that all else being equal, a certain dissolved oxygen (DO) minimum standard for the receiving water translates to a smaller volume of water the treatment plant can discharge. Onsite treatment and reuse, therefore, effectively solves two problems with one solution.
Removal of trace contaminants, such as those previously discussed, is made considerably more difficult by dilution. Depending on origin and initial use, compounds that may have
environmental health implications tend to be concentrated in certain waste streams. If those streams were targeted for compound-specific treatment techniques that could provide efficient removal prior to dilution by other wastewaters, a more drastic degree of elimination in effluent would be achievable (Joss et al. 2008). Additional end-of-pipe centralized polishing tertiary treatment such as ozonation, activated carbon filtration, and constructed wetlands coupled with point of generation pretreatment would cumulatively offer the best chance of lowering effluent concentrations of micropollutants to less than their threshold for biological activity while limiting the potential for ecological damage from sewer overflow and leakage (Joss et al. 2006; Song et al. 2009).
11
buoyant scum. Outlet piping is positioned at a midpoint between the bottom of the tank and the static water level, so as to only permit
clarified effluent to leave the tank. Periodic maintenance is required to dispose of accumulated solids. Removal of micropollutants accomplished
through primary treatment alone is significant for those compounds that partition into the solid phase, whereas hydrophilic compounds that dissolve easily in water tend to remain in the effluent (Conn et al. 2006).
The leachfield disperses
primary effluent through a piped distribution network, from which it is released into a subsurface gravel bed. Flow from the leachfield into the surrounding sedimentary strata is dependent on the natural porosity and permeability of the soil. There is no mechanism for aeration or oxygen availability in such systems (aside from the minimal penetration of atmospheric oxygen into leachfield gravel) which is a requisite for nitrification and also to support microbes that catalyze the degradation of a wide variety of trace contaminants (Joss et al. 2004). Even if leachfield DO levels were higher in practice, the order of the anaerobic then aerobic environments is not conducive to vigorous nitrification and denitrification. Nitrification, which takes place in aerobic environments, must precede denitrification for thorough removal of nitrogen. Substantial impacts to receiving groundwater and surface water bodies from septic leachate have been documented with regards to a variety of micropollutants, and excess nitrogen and phosphorus have been shown to cause eutrophication and ecological destruction (Rudel et al. 1998, Beal et al. 2005).
Figure 6 - "Monster" septic tank advertised in 1895.
12
A local business has constructed a number of onsite wastewater treatment and reuse systems that capitalize on these opportunities for improvement. System configuration varies depending on application but the technology fundamentally is based on biosand filtration augmented by phytoremediation, configured to provide alternating aerobic/anaerobic environments which promote nitrogen removal. A porous substrate such as sand or gravel is exposed to secondary effluent containing a wide variety of microbial organisms, from which a biofilm is established coating the substrate media (Matamoros et al. 2007). The presence of plants at the substrate surface facilitates this process by increasing surface area available to microbes and by regulating the movement of carbon and nitrogen through the system, decreasing the variability of nutrient supply and buffering microbes from temporal change (House 2011). The contact time between flowing water and the biosand filter allows for microbially catalyzed removal of wastewater constituents as well as degradation and mineralization of hazardous compounds. This treatment approach has been found to be
conducive to micropollutant removal through sorption and biotic mineralization, removing to a major extent estrogens, nonylphenol (a surfactant produced through breakdown of detergents), and total estrogenic activity (Stanford and Weinberg 2010).
This literature review prompts several questions that would clarify hypotheses
suggested by prior research findings. Can a relationship be observed between aerobic microbial treatment conditions and estrogen removal? If so, is that aerobic estrogen removal
accomplished by nitrifying bacteria? Does triclosan in wastewater inhibit the functionality of the nitrifying microbial cohort, and to what extent? Finally, can these phenomena be related
through their dependence/ impact on nitrifying bacteria?
Given the increasingly important role of onsite treatment to prevention of
13
using water treated by similar systems indicates that microbial interaction with micropollutants is evident and measurable, meaning that these systems offer a suitable environment for
investigation of the dynamics of these processes (Stanford and Weinberg 2010).
1.3.2 Emerging Regulation of Reuse Systems
Onsite wastewater treatment for reuse has not yet become widespread and has not been studied enough to spur state and federal authorities to codify design standards and guidelines into law. The U.S. Environmental Protection Agency (EPA) has published and updated their Guidelines for Water Reuse, which compiles resources, case studies, applicable regulation contained within legislation not ostensibly pertaining to wastewater reuse, and also state-specific requirements (U.S. EPA 2004). In North Carolina, urban reuse is subject to quality requirements defined by biological oxygen demand (BOD), total suspended solids (TSS), ammonia content, fecal coliform (FC) count, clostridium perfringens concentration, and
turbidity. Permitting to build systems is not standardized, and exceptions are granted by county public health officials on a case by case basis (House 2011).
1.4 Column and Batch Study Models
14
exhausted. In addition to this means of determining the extent of finite sorptive capacity, columns are used to test dynamic rates of change such as the ability of microbial organisms to transform metabolites into daughter products, or other material rates of flux (Hutchins et al. 1984).
Column studies as described in the previous paragraph were widely applied during the 1990s to investigate the mechanisms controlling fate and transport of many organic compounds, a development commensurate with increased concern regarding the environmental implications of residual organics (Krzyszowaska et al. 1994.; LaPat-Polasko et al. 1994; Szabo et al. 1990). Having documented their affinity for the solid phase in pure solutions, some column studies attempted to determine the effects of matrix interactions on solubility of organic compounds. Iglesias-Jimenez et al. (1997) observed that exogenous organic material (humic acids,
surfactants, and municipal compost) resulted in significantly decreased rates of sorption and earlier breakthrough of target chemicals in column studies.
15
1.5Chemical and Biological Measurements of Endocrine Activity
Two fundamentally different approaches to quantifying endocrine activity are commonly employed; compound-specific chemical analysis which is then related to health effects through toxicology work, and bioassays which expose some isolated organism or biologically-derived reactive component of an organism to a sample and gauge the subsequent degree of response. There are strengths and weaknesses to each of the techniques falling under either of these headings, stemming from the multitude of different potential EDCs to be
assessed, the potential for altered effect in mixture, and the complexity of the endocrine system itself (Francois et al. 2003). The most commonly adopted chemical methodologies are gas chromatography-mass spectrometry (GC-MS) and liquid chromatography-mass spectrometry (LC-MS), and in bioassays the yeast estrogen screen (YES) assay has been utilized widely (Petrovic et al. 2004). Specificity to
endpoint (response based on a single receptor type or indicator species) leads to false negative results if selective screening methods are used to represent entire ecosystems and environments. A major concern with chromatographic methods is that they are compound-selective to the point that a compound transformed slightly to a similar daughter product would no
longer be recognized as the parent compound even though its biological effect might remain undiminished. On the other hand, a more comprehensive measure would offer very little insight into mechanism of effect. The most promising option is to use the two approaches in tandem (an
16
example would be the Toxicity Identification Evaluation System (TIE) system, Figure 7) in order to eliminate the blind spots associated with each.
A bioassay that has been developed recently for quantification of micropollutants is the enzyme-linked immunosorbent assay, or ELISA. ELISA methods in general are used for rapid screening in medical, agricultural and food regulatory contexts. The technology is based on substrate-selective antibodies that bind targeted analytes, developed in animals. A fixed amount of these antibodies are placed in wells in a 96-well plate. Samples are allowed to react with the antibodies, then are removed and an aliquot of a color-linked version of the target analyte is introduced. Any remaining active antibody binding sites fix a molecule of the color-linked compound and, therefore, the intensity of color in the well is inversely related to the concentration of analyte in the sample. The amount of antibody binding sites dictates a maximum concentration that can be measured, as a calibration curve can only define a relationship between colorimetric response and concentration up to the point where no color-linked analyte is able to be fixed because no active antibody binding sites remain. Application of this technology to wastewater is limited in the literature but detection limits, specificity and resistance to matrix effects, and suitability to analysis of unfiltered and unconcentrated waters indicate that the technique may prove superior in certain respects to established methodology (Nicolardi 2012).
1.6Objectives
17
In prior work where microbial effects on micropollutants have been documented, a common approach has been to isolate a culture of one specific organism so as to eliminate the complications involved in working with a consortium of microbes and allow definite conclusions to be drawn (Yoshimoto et al. 2004). However, this approach limits the applicability of findings to whole systems where ecosystems may employ fundamentally different mechanisms to
metabolize any given compound. Therefore, a more comprehensive approach is required to provide more practical insight into processes at work in functioning wastewater treatment systems.
Similar weaknesses can be observed with regards to the traditional application of column and batch study methods to wastewater treatment. Column studies typically assess the physical sorptive capacity of a substrate in terms of time to breakthrough of compounds in the effluent after flow is initiated. This approach measures the static capacity of virgin material to sequester compounds, which is entirely different from the dynamic equilibrium removal efficiency that takes place in an operating treatment system. Batch studies are typically used to measure a decay rate, reduction per unit time, where there is presumed to be a mechanism of removal that is uniform and can be treated as comparable to a thermodynamic decay constant. The objective of batch studies would normally be to obtain a quantitative formula that
characterizes this removal rate, as a function of time.
Using real wastewater collected on an ongoing basis, the replicability of batch
18
speculating about how pollutant removal might be expected to change in another setting, where the variables would be different.
In the experiments described in following chapters, column and batch studies were used in a fundamentally different way than they have usually been in the literature (Das et al. 2004). Rather than identifying a static quantity of a compound that can be sequestered per volume of media (using columns) or a reduction in concentration per unit reaction time (through batch studies), columns and batches were allowed to reach a dynamic equilibrium under varying conditions, and removal efficiencies were associated with operating conditions, and were contrasted with one another. This comparative, and essentially qualitative basis for defining results makes them more generally relevant to wastewater treatment systems that vary in design and operation.
19
2. METHODS
2.1 Full-scale Onsite System
A packed soil column system was constructed that replicates the design of an onsite wastewater treatment system constructed at the Central Carolina Community College (CCCC) in Pittsboro NC. This system consists of a three-stage biofiltration technology that is supplied with secondary effluent, meaning wastewater that has been clarified by settling in a septic tank (see
Appendix A). The three stages in the field system are defined primarily by their access to oxygen and the resulting dissolved oxygen (DO) level; there are aerobic and anaerobic stages, and an intermediate hypoxic stage. The aerobic and hypoxic stages are stacked, so the aerobic is the upper half of a raised sand filter bed with
plants growing at the surface, and the lower half is made hypoxic by its removal from
atmospheric oxygen and because it is supplied with untreated wastewater which has an elevated biological oxygen demand (BOD). The anaerobic element is an adjacent subsurface constructed wetlands, which is shallow and flows laterally. The biofiltration units are structured so untreated water enters through a lower manifold within the raised sand filter, at the top of the hypoxic stage, then flows out the bottom of the hypoxic element, through the
Table 1 - Structure of CCCC onsite wastewater treatment system substrate.
Layering of CCCC system substrate
Aerobic stage 3" gravel (upper half of sand filter) 6" stalite
Total height
6" sand 15”
Hypoxic stage 6" gravel (lower half of sand filter) 6" stalite 18" sand
Total height
6" gravel 36”
Anaerobic stage 9 ¼" stalite (adjacent constructed
wetlands) Total height
12" gravel
20
anaerobic wetlands, and is pumped to a reuse tank. The aerobic stage is supplied from the reuse tank; this water then flows downward into the hypoxic stage and follows the same flow path as untreated water (Table 1). Treated water continues to cycle through the system and a reuse tank until it is withdrawn for onsite reuse. This cycling pattern allows for efficient nitrogen removal due to the alternation in oxidizing conditions, and further facilitates denitrification by ensuring that carbon is available during anaerobic treatment. The application rate of water to the hypoxic stage is approximately 3 gallons per square foot per day. Batch loading is utilized in the field such that the 3 gal/day is delivered in three doses timed eight hours apart.
2.2 Lab-scale models
2.2.1 Column system
21
depth to the material surface from the top of casing. These columns were capped with aluminum endcaps sealed with rubber o-rings, secured using threaded stainless rods spanning the distance between the two endcaps on each length of pipe. A coarse aluminum mesh screen was placed inside the lower cap to prevent clogging of the three 1/16” ports machined into each.
Wastewater is introduced into the top of each column through one of these ports by way of 1/16” OD stainless tubing that connects the columns to the preceding reservoir (Figure 8). Internal diameter of tubing, valves and other hardware was chosen to minimize dead volume in the system. Water is pumped through the tubing by pressurizing the headspace of the reservoir, a technique that avoids the need to filter the water as is required for mechanical pumping. This approach also allows fine modulation of flow rate and decreases the cost and complexity of system construction and maintenance. In order to allow water to flow sequentially through the three reservoirs and columns, a pressure gradient is applied approximating 6, 4 and 2 pounds per square inch (psi) in the successive reservoirs. A three way valve topping an inlet to the reservoir headspace can cut off flow, vent the reservoir to the atmosphere, or pressurize the reservoir from pressurized gas supply tanks. (See Appendix B for photos of assembled system).
22
The flow rate is further adjustable using inline needle valves after each column which regulate the backpressure on flow from each column to the next reservoir. Shutoff valves are used before each column to open or close them to the preceding reservoir. Samples were drawn from the outlets depicted in Figure 8, and an additional system sample was taken during each sampling event from Reservoir 1, through the supply line to the hypoxic column. Design consultation, sourcing of fittings and hardware, machining and assembly of the column system was executed by the University of North Carolina at Chapel Hill Environmental Sciences and Engineering Department’s Design Center, managed by Dr. Glenn Walters.
The reservoirs feeding the hypoxic and anaerobic columns were pressurized using nitrogen, whereas the reservoir preceding the aerobic column was pressurized with air- this keeps DO levels close to target values similar to those produced by the field system. These targets were approximately <1 mg/L in the anaerobic, <2 mg/L in the hypoxic, and >2 mg/L in the aerobic stages. In order to further facilitate oxygen exchange going into the aerobic stage, air flowing into the reservoir supplying the aerobic column was introduced such that it bubbles up through the water before reaching the headspace. During startup, air is bled out of the hypoxic and anaerobic columns by pressurizing their respective source reservoirs, and opening the shutoff valves to allow water to flow into the columns at the top. The needle valves at the bottom of the columns are closed, and one of the extra ports at the top of each column is opened to the atmosphere. This allows air to escape as the pore space in the column media is filled with water. Once the water level in the column rises to meet the top cap, the bleeder port is closed, at which point there is no way for headspace to reopen in the column as the inlet tubing is submerged and only water can enter the system. DO measurements throughout column experiments are
tabulated in Appendix C.
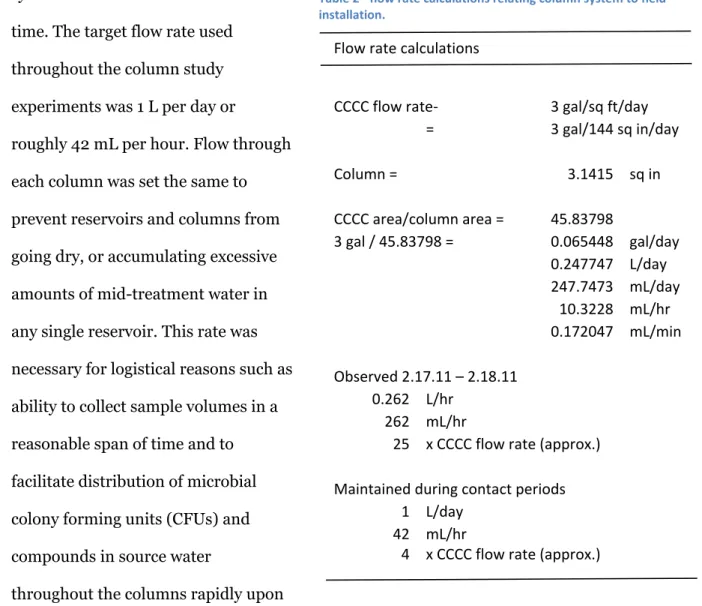
23 system flow rates are constant over
time. The target flow rate used throughout the column study experiments was 1 L per day or
roughly 42 mL per hour. Flow through each column was set the same to prevent reservoirs and columns from going dry, or accumulating excessive amounts of mid-treatment water in any single reservoir. This rate was necessary for logistical reasons such as ability to collect sample volumes in a reasonable span of time and to facilitate distribution of microbial colony forming units (CFUs) and compounds in source water
throughout the columns rapidly upon
startup. In the field, wastewater flows into the system during brief high flow batch loading events, as opposed to the constant low level flow employed in the column study. Passage of untreated wastewater through the system is separated from treated water cycling through by the timing of loading events at the upper and lower manifolds in the raised sand filter. In the
column study, only untreated wastewater was used, with no recirculating element to the flow path. This means that the model system is not optimized for denitrification, as the organic nitrogen species that are precursors to denitrification (nitrite and nitrate) are produced in the aerobic stage which is last, and so they are not exposed to anaerobic treatment. Nitrite and
Table 2 - flow rate calculations relating column system to field installation.
Flow rate calculations
CCCC flow rate- 3 gal/sq ft/day
= 3 gal/144 sq in/day
Column = 3.1415 sq in
CCCC area/column area = 45.83798 3 gal / 45.83798 = 0.065448 gal/day
0.247747 L/day 247.7473 mL/day
10.3228 mL/hr 0.172047 mL/min
Observed 2.17.11 – 2.18.11 0.262 L/hr
262 mL/hr
25 x CCCC flow rate (approx.)
Maintained during contact periods 1 L/day
42 mL/hr
24
nitrate present in the source water are likely to be converted through denitrification to nitrogen gas.
These disparities are just a few of the many reasons why absolute performance level cannot be extrapolated from column system results to field applications. The capacity of column system stages to transform wastewater constituents can be compared only within column system results, and while the trends observed in column experiments are likely to hold true in other contexts, the quantitative measures of performance do not directly translate. Given that the field system flow rate is lower by a factor of approximately 4, it is reasonable to hypothesize that the increased contact time may result in higher removal efficiencies for a given initial concentration.
Another fundamental difference between the model system and the field installation is the configuration of the anaerobic stage. At CCCC, wastewater enters a side of the subsurface constructed wetlands and flows laterally, meaning that the vertical reconstruction of substrate that constitutes the anaerobic stage in the column system did not accurately reproduce the contact time and surficial interaction that takes place in the field. This difference indicates that the column system will tend to underestimate the capacity of the field installation’s anaerobic phase to effect transformation and reduction of wastewater constituent concentrations and will underexpress the physical sorptive capacity of that treatment stage. Significant logistical issues would be involved in the construction and operation of a scale model of the actual spatial behavior in effect at the field installation.
25 2.2.2 Batch studies
Batch studies were utilized to further identify the relative importance of each of the various elements of treatment (physical sorption, microbial transformation, compound
instability) in an aerobic context. 500mL Erlenmeyer flasks were filled with substrate identical in proportion to that used to pack the aerobic column, but half the total volume so as to not overfill the container. 250mL of CCCC wastewater was added to establish a biofilm on the media; this mixture was maintained on a shaker, capped, at 175 revolutions per minute (RPM) for 2 weeks at 20° C. Following this acclimatization period the liquid was discarded and replaced by 250 mL fresh wastewater which was exposed to the biofilm under the same conditions for five days contact time, after which the water was sampled for analysis. Samples from batches filled with active wastewater were compared with those from batches that were autoclaved (substrate autoclaved after acclimatization, immediately prior to being refilled with autoclaved wastewater), and with batches that had been spiked with AMO inhibitor allylthiourea purchased from Fisher Scientific (Pittsburgh, PA)to observe to what extent target chemical removals increased in the presence of active microbial populations, including and not including the nitrifying subset.
26 2.3 Inhibition of nitrification
Allylthiourea (C4H8N2S) is a selective, effective inhibitor of ammonia oxidizing bacteria that has been used to conduct respirometric experiments to quantify nitrification rate based on oxygen consumption for more than 50 years (Hofman and Lees 1953). It has been demonstrated to permanently and completely block ammonia oxidation at a concentration of 86 µM (Ginestet et al. 1998). It is one of several compounds demonstrated to be capable of inhibiting
nitrification. The nitrogen anion azide (N3-) sometimes used bound to a potassium cation (KN3), in addition to blocking oxidation of ammonia to nitrite, also inhibits the remainder of the ammonia to the nitrogen gas transformation process (Bremner and Yeomans 1986). Chlorate is an AOB inhibitor but has been observed to be less specific and less instantaneous in effect than allylthiourea (Belser and Mays 1980). Nitropyrin, known as N-serve, is a similar inhibitor that is commonly used in agricultural applications to prevent oxidation of ammonia to nitrite and nitrate because these species are soluble (Lewis and Stefanson 1975). Nitrogen in fertilizer is prone to leaving the field in oxidized form in groundwater and runoff, in addition to biologically-catalyzed denitrification and volatilization. Allylthiourea was selected for this research to
differentiate analyte transformations catalyzed by nitrifying bacteria from that of the microbial population at large because of its superior selectivity and the complete effect it has been
demonstrated to have in nitrifying bacterial cultures (Ginestet et al. 1998).
The literature defines allylthiourea as a permanent inhibitor of nitrification, meaning that microorganisms that bind with the compound do not recover. Even so, over time if
microbially active wastewater containing no inhibitor continued to flow through a column that had been treated with allylthiourea, it is inevitable that at some point the dose of inhibitor would be exhausted and nitrification would resume. This approach is preferred to resetting the
27
be of different constitution, are avoided. It is unlikely that the viability of this option can be predicted from results published in the literature as the outcome is highly dependent on
situational variables specific to this column study such as flow rate, type of substrate, makeup of wastewater, etc. Therefore, a trial is necessary to determine how to prepare the columns for a new iteration of sampling after they have been exposed to chemical manipulation. See
Appendix D for information on quantification of nitrogen species.
2.4 Source water
Collecting wastewater from CCCC to use as source water in the column and batch studies was a low-tech affair. Following primary treatment by septic tank, secondary effluent flows into a pump tank from which it is transferred to the treatment system. This tank is
accessible by a manhole cover secured with screws. Using a 1 L polyethylene (PE) bottle on a string, which is hose-clamped to a metal weight to cause it to submerge easily, water was bailed multiple times from this pump tank in which the water level is roughly 15’ below the ground surface (Figures 9,
10 and 11). The contents of this bottle were transferred to a glass carboy or 19 L PE container for the return trip to the UNC laboratories. The DO level in this tank was measured at 0.26
28
mg/L using a DO probe, which suggests conditions in the tank are anaerobic due to the high BOD of the wastewater.
Daily variability in source water composition and quality presents a source of error that is difficult to control. The student population at CCCC fluctuates so that usage patterns and dilution factors, as well as the
concentrations of various
constituents and micropollutants, are all in a constant state of flux.
One option would be to sample a large batch of water at one time and store it, in order to obtain a consistent matrix for all iterations of batch and column experiments. However, stabilization of this stored water is extremely problematic. Aside from settling and physical separation,
microbial action could result in significant changes in total organic carbon (TOC), nitrogen, and also trace constituents. Additionally, the microbial population extant in the wastewater matrix would be certain to shift and affect what subsets remained to seed the column and batch substrate and, therefore, the treatment that population could offer. Any removal of bacteria or other microorganisms from water introduced to experimental substrate could potentially have drastic consequences to results and so attempting to chemically, thermally, or otherwise
suspend activity in the wastewater matrix during storage is too risky a proposition. The favored alternative is to repeatedly withdraw fresh wastewater for each round of experiments and characterize results relative to the contemporaneous source water. This introduces co-varying factors that lead to noise and error in results, but this approach is less fundamentally flawed in that the matrix and the constitution of the treatment system in practice is preserved.
29
2.5 Nomenclature for column system and batch study samples
A naming systematic was employed for samples generated by column and batch studies allowing for determination of order and system conditions. As an example, for the sample identification code:
𝑩𝟐. 𝟑 𝑼𝑺 − 𝟏
B identifies which of the series of sampling events the sample was taken during, 2 specifies which reservoir, column or batch the sample came from, and 3 further defines which subseries the sample belongs to if more than one set of samples was taken for the same series. A series generally relates to an operational variable having been changed, the effect of which is assessed by taking one or more sets of samples that in theory should be characteristic of the operational parameters in place at the time.
Column system sampling series were labeled by letter starting with “A” and proceeding consecutively. The first batch study series was labeled “Z” and subsequent iterations have been labeled moving backwards through the alphabet. With column system samples, the numbers are consecutive such that 1 corresponds to source water drawn from Reservoir 1, 2 comes from the outlet of the first column (hypoxic), 3 is taken following the second column (anaerobic), and 4 is taken following the third column, which is aerobic. Batch study numbers are correlated with treatments by a key, for each series. Most sampling series had only one set, so where no decimal place and sub-series number are included, it can be assumed that the sample is from sub-series 1 of 1. The term BX.3 would refer to all stages within the B-series from the third set, and has the same meaning as B1-4.3, both encompassing B1.3, B2.3, B3.3 and B4.3.
30
(calibration point), or N for nitrogen quantification, and numbers were used as needed to distinguish multiple aliquots taken for similar uses. Where no label was appended of this type, no subdivision was made and the sample may be considered 1 of 1.
2.6 Experimental timeline
2.6.1 Column study samples
Column study experimental procedure was as follows. Construction of the column system was completed 1.17.11, and it was pressure tested and checked to confirm that all connections were fully sealed. It was then packed with materials as described in the preceding section, and flow through the system was tested using LGW. When this water flowed through the columns and associated plumbing without clogging or excessive backpressure, primary effluent withdrawn from CCCC on 2.16.11 was introduced to the system and biofilm was established on the column media over a period of two weeks. Filter plate methods were initially employed to assess the degree to which biomass had accumulated within the column system, but their use was
discontinued due to ambiguity regarding whether the measurements obtained could reasonably be expected to correlate with experimental parameters. For discussion of filter plate methods, refer to Appendix E.
In order to more rapidly saturate the column substrate with microbial CFUs, a 20L carboy filled with media (Stalite, sand and gravel in proportions identical to those of the aerobic column) was saturated with wastewater in aerobic conditions. A manifold distributed
31
2.25.11, the pressures in the carboy serving as Reservoir 1 reached the point at which the container exploded. In order to prevent a reoccurrence, headspace pressures in the reservoirs were dropped to 6, 4 and 2, a plywood platform was constructed to ensure that the base of the reservoirs were evenly supported, substrate was not used in reservoirs again, and blow-off valves were installed on the headspace outlet of each reservoir.
After system startup on 2.16.11 followed by an acclimatization period of two weeks, A-series samples were collected on 3.2.11. These were to provide an indication of baseline
concentrations of analytes in source water, and to provide an indication of overall removal rates in order to choose dilution factors going forward. The aerobic column was uncapped to allow gas exchange with the atmosphere (Figure 12). Following column system tweaks, additional
samples (B-series) were taken on 3.17.11.
The column system was immediately thereafter refilled with source water spiked with estradiol, caffeine, triclosan, ibuprofen, nonylphenol, and estrone at 2 µg/L above the
background level (see Appendix F). C-series samples were taken after a one week contact time, on 3.24.11. B and C series samples were quantified. On 3.25.11, allylthiourea was added to unspiked source water that was used to refill the column system, at a concentration of 10 mM or 1.16 g/l. The media was not changed. D-series samples were taken for analysis by Hach kits for ammonia, nitrite, and nitrate concentrations starting on 4.28.11 and repeating 7 more times through 5.16.11 (data included as Appendix D). It was determined through these tests that nitrification was not resuming over this time period as nitrite and nitrate concentrations did not show an increasingly upward trend through subsequent system samples over time, and
ammonia concentrations did not show an increasingly downward trend. D-series samples for solid phase extraction (SPE) were taken 4.28.11.
32 system was operated at roughly 2.5 L/day
until 6.1.11 in order to more quickly distribute microorganisms throughout the system, ensure availability of nutrients, and rapidly acclimatize the columns and establish a biofilm. On 6.1.11 Reservoir 1 was refilled with source water containing spikes of estrone, estradiol, caffeine and ibuprofen, increasing the background levels of
those chemicals by 1 µg/L. Nonylphenol was not added because by this point, it had become clear that the analytical techniques used to quantify nonylphenol were going to be inapplicable to this wastewater matrix. Triclosan levels were not elevated to avoid its hypothesized inhibitory effect on microbial action within an experimental series not designed to measure this effect. E-series samples were collected 6.6.11. These were the first samples to be analyzed for estradiol, caffeine, and triclosan. Stock compounds were purchased from Fisher Scientific (Pittsburgh, PA).It was determined using these analyses that all compounds were detectable throughout treatment stages without being artificially elevated, so unspiked water was subsequently used to refill reservoirs. F-series samples were collected in two staggered sampling events, F1-4.1, and F1-4.2. On 7.7.11 system samples were taken derived from what based on flow rates and column volume was assumed to be an unspiked system (F1-4.1). The system was then immediately refilled with source water spiked with allylthiourea, again at 10 mM. After a 5 day contact time, inhibited column system samples were collected (F1-4.2).
The final sampling event investigated triclosan’s hypothesized inhibition of nitrification. Following the F-series sampling event, the column system was broken down, old substrate was discarded and the system repacked, reestablished and reacclimatized by flowing fresh
33
(G1-4.1). Each reservoir was then spiked with 10 µg/L triclosan, elevating the concentration above background levels. The system was run for 5 days, and G1-4.2 system samples were taken on 8.8.11.
2.6.2 Batch study samples
The first batch study series was initiated on 5.25.11. Unspiked wastewater was added to 6 batches of substrate (as described in section 2.2.2) which were acclimatized for one week. On 6.1.11 liquid was decanted, and two batches were autoclaved. All were then refilled, three with unspiked source water and three with source water containing spikes of estradiol, caffeine, ibuprofen and estrone at 1 µg/L. One of each set was an autoclaved batch; water added to that flask was separately autoclaved, before additions. These six batches were maintained on a shaker at 20° C for a five day contact time, and autoclaved in their flasks for 60 minutes at 110 °C and then stored at room temperature. Autoclaving was the sole aseptic technique employed to ensure sterility. Active aliquots of source water were also set aside off the shaker to assess baseline decay and microbial activity. The supernatant from these batches was decanted and sampled on 6.6.11, sample designations Z1-8. This batch series aligns with column system sample series E in treatment and control type, and were conducted simultaneously using the same source water.
Similarly, batch series Y lines up with column system sample series F in that three batches spiked with allylthiourea are compared with three control batches, one of each set being autoclaved. Again autoclaved and active aliquots not in contact with batch media were
34 2.7 Sample analysis
2.7.1 Gas chromatography-mass spectrometry (GC-MS)
The approach initially taken for the analysis of wastewater for trace organic contaminants involved methods based on
solid phase extraction (SPE) coupled with gas chromatographic separation and mass spectrometric detection (GC-MS) (Stanford and Weinberg 2007). This technique was attempted to analyze column and batch study samples, with mixed results. The SPE procedure allows for concentration of some
analytes and elimination of other highly polar or high molecular weight wastewater constituents that would otherwise cause high background noise, obscuring the chromatographic signal. This method has been demonstrated to allow for detection limits in the 0-10 ng/L range in the source wastewater, corresponding to 10-100 µg/L in the final extract, assuming 100 percent recovery (Stanford and Weinberg 2007).
Prior to extraction, 500mL liquid samples are filtered using 2.7, 1.5 and 0.45 µm pore size glass fiber filters in sequence. Glass fiber filters were purchased from Fisher Scientific (Pittsburgh, PA). Filtrate is then drawn through 500mg/3 mL Strata SAX (strong anion exchange) and 200mg/6 mL Strata X sorbent cartridges (Phenomenex, Torrance, CA) in series at a flow rate not exceeding 8 mL/min, stacked on a Supelco 12-port vacuum manifold (Sigma-Aldrich, St. Louis, MO) as shown in Figure 13. These cartridges are preconditioned using a series of
solvents to activate the selective chemical reactivity of the absorbant material as called for by the manufacturer’s literature. The SAX is used as a pretreatment to remove anionic