ALLELE-SPECIFIC CHROMOSOME CONFORMATION AND ITS ASSOCIATION WITH ALLELIC
EXPRESSION BIAS
Rex L. Williams, Jr.
A dissertation submitted to the faculty at the University of North Carolina at Chapel Hill in partial
fulfillment of the requirements for the degree of Doctor of Philosophy in the Curriculum in Genetics
and Molecular Biology in the School of Medicine.
Chapel Hill
2013
Approved by:
Kerry S. Bloom
Rosann A. Farber
Terry S. Furey
Terry R. Magnuson
ABSTRACT
Rex L. Williams, Jr.: Allele-Specific Chromosome Conformation and its Association with Allelic
Expression Bias
(Under the direction of Terry R. Magnuson)
It is frequently suggested in recent literature that long-range interactions, presumably
between enhancer elements and promoters, are an important factor in mediating gene expression.
Such “chromatin loops” are often described as regulatory models in which active or repressive loops
are suggested to exist as predominate chromosome conformations that are tightly associated with
expression states. These models are supported by numerous investigations of well-studied models
such as the beta-globin locus and the Hox clusters. If correct, it follows from these models that
differential chromosome conformation patterns, under various contexts, should be a widely
observable property of loci that exhibit differential gene expression. To test predictions of this
hypothesis, seven candidate genes exhibiting strong allele-specific expression bias were selected for
analysis with allele-specific 4C-Seq assays. Conditions for chromosome conformation experiments
were optimized for a trophoblast stem cell model that is ideal for interrogating allele-specific
ACKNOWLEDGEMENTS
The work described in this dissertation would not have been possible without a substantial
amount of assistance from various people along the way. The author would like to acknowledge, in
general, the entire Magnuson Lab for regular feedback and encouragement during the development
and execution of the experiments described in the following chapters. In addition to general input and
assistance generously provided from all members of the Magnuson Lab, the participation of several
people was substantial enough to warrant specific acknowledgements of their contributions.
Dr. Terry R. Magnuson was the principal investigator overseeing this project. In addition to
providing funding to carry out the work described here, Dr. Magnuson has been a helpful advisor and
long-time friend of the author. Without the advice and encouragement provided from him, it is likely
that the author would never have entered a graduate program in the first place and, later, would likely
have left the program without completing a doctoral degree.
Dr. Joshua W. Mugford was a Postdoctoral Fellow in the Magnuson Lab at the time that this
work was performed. Dr. Mugford initially recruited the author to assist with chromosome
conformation experiments in the Magnuson Lab upon learning of the likelihood that the author may
leave his doctoral program without completing the degree. As such, Dr. Mugford was heavily
involved in the optimization of conditions for performing the described techniques in trophoblast stem
cells. Although the initial concept for proposed experiments did not come to fruition, Dr. Mugford’s
intervention made the project discussed in the following chapters possible. Additionally, Dr. Mugford
was the primary author of many of the Perl scripts and programs used in the mapping, alignment, and
allelic assignment procedures described in Chapters 3 and 5. While many of these programs were
occasionally modified and tweaked to meet requirements necessary for the specific analyses
Dr. Joshua Starmer was a Research Assistant Professor under the direction of Dr. Magnuson
at the time this work was performed. Dr. Starmer’s initial work on observed allelic bias in expression
and chromatin modification detections in the trophoblast stem cell models was the starting point from
which the concept of testing allele-specific variations in chromosome conformation was founded.
Additionally, Dr. Starmer’s heavy background in statistics and computational biology was crucial as
he was the primary designer and developer of the fourSig analysis suite. Dr. Starmer has been
heavily involved in the authorship of all manuscripts related to chromosome conformation studies in
the Magnuson Lab to date and this work could absolutely not have been performed without his
assistance. Furthermore, Dr. Starmer has had substantial involvement in both helping the author to
learn how to develop software for informatics analysis and keeping him motivated to complete the
work described here and in an associated manuscript.
Della Yee, a technician and the lab manager for the Magnuson Lab, was critical in the
preparation of sample for the experiments described here. All culture of trophoblast stem cells was
performed by Ms. Yee and she was critical in assisting the optimization of sample collection protocols
and actually harvesting the cell pellets used for chromosome conformation experiments. This is
laborious work that requires tremendous flexibility of scheduling and her efforts have been greatly
appreciated.
Several minor contributions are worthy of specific acknowledgement as well. The described
work is founded on initial work performed in the Magnuson Lab by Dr. J. Mauro Calabrese, a
Postdoctoral Fellow at the time of this work. His input and guidance was crucial in facilitating
effective navigation of the several datasets generated by his research projects.
Sequencing libraries were submitted to the High-Throughput Sequencing Facility at the
University of North Carolina at Chapel Hill. For the specific projects described here and other
unrelated chromosome conformation experiments, effective strategies for sequencing the hybrid
libraries needed to be developed. The director of this facility, Dr. Piotr Mieczkowski, assisted by
providing insightful feedback and suggestions leading to the adapted primer strategy described in
Chapter 2.
Finally, it is important to acknowledge Dr. Lucy H. Williams, a former member of the
TABLE OF CONTENTS
LIST OF TABLES ... xii
LIST OF FIGURES ... xiii
LIST OF ILLUSTRATIONS ... xv
LIST OF ABBREVIATIONS ... xvi
LIST OF SYMBOLS ... xx
CHAPTER 1: INTRODUCTION ... 1
Introduction ... 1
Three-Dimensional Structure of the Genome ... 2
Chromatin in Organization and Regulation ... 3
Chromosome Territories and Relative Proximity ... 4
Chromosome Conformation Assays ... 6
Allele-Specific Gene Expression ... 7
Imprinting ... 8
Non-Imprinted Bias ... 9
Concluding Remarks and Hypothesis ... 9
CHAPTER 2: EXPERIMENTAL DESIGN AND OPTIMIZATION ... 12
Strategy and Experimental Design ... 14
Candidate Selection ... 14
Allelic 4C-Seq ... 17
Controls ... 21
Allelic Design and Expectation ... 22
Primer Strategy ... 23
Intentions for Mapping and Analysis ... 23
Validation of Allelic Expression Bias in Candidate Genes ... 24
Generation of 3C Libraries ... 29
Handling of TS cells ... 30
Optimization of Fixation ... 31
Optimization of Lysis ... 34
Optimization of Ligation ... 34
Library Preparation ... 36
Generation of 4C Libraries ... 39
Digestion Schemes and Primer Design ... 39
Optimizations and Preparation ... 43
fourSig: A Novel 4C-Seq Analysis Method ... 43
Methodology ... 47
Permeabilization ... 52
Fixation ... 54
Minimization of Probe Size ... 54
Concluding Remarks ... 57
CHAPTER 3: RESULTS AND ANALYSIS ... 58
Introduction ... 58
Mapping Strategy and Sequencing Results ... 58
Mapping and Processing Sequencing Reads ... 59
Allelic 4C-Seq Test Experiment at Ibtk Locus ... 62
Full Allelic 4C-Seq Experiment on All Candidates ... 65
Set Analysis and Results for Allelic 4C-Seq at Ibtk ... 70
Validation of Ibtk Contacts by FISH ... 78
Analysis of Usable 4C-Seq Libraries ... 84
Allelic 4C-Seq at Airn TSS ... 85
Allelic 4C-Seq at TSS for Car2 and Bphl ... 88
Concluding Remarks ... 93
CHAPTER 4: DISCUSSION OF RESULTS AND CONCLUSIONS ... 95
Introduction ... 95
Analysis and Validation Methods ... 95
Future Directions ... 98
Possible Improvements ... 99
Further Experimentation ... 101
Concluding Remarks ... 102
CHAPTER 5: DETAILED METHODS ... 104
Tissue Culture and Sample Preparation ... 104
4C-Seq Protocol ... 104
Isolation of TS Cells ... 105
Digestion of Chromatin ... 106
Proximity Ligation ... 108
DNA Purification ... 108
4C Restriction Digestion ... 111
4C Proximity Ligation and Linearization ... 112
Library Amplification ... 113
4C-Seq Data ... 115
Recipes for Solutions ... 115
FISH Protocols... 116
Labeling of FISH Probes ... 116
Probe Precipitation ... 117
Hybridization ... 120
Analysis Methods ... 122
Recipes for Solutions ... 123
Allele-Specific qRT-PCR ... 124
Informatics Pipeline ... 124
Alignment ... 124
Statistical Analysis ... 125
Allelic Analysis ... 125
APPENDIX: AMPLICON EFFICIENCY ... 126
LIST OF TABLES
Table 2.1
Selected Candidates for Allelic 4C-Seq ... 18
Table 2.2
Primers for Allele-specific qRT-PCR Assays ... 25
Table 2.3
3C Libraries ... 37
Table 2.4
4C Digestion Schemes for Candidate Loci ... 41
Table 2.5
Primers for Allele-specific 4C Assays ... 42
Table 2.6
4C-Seq Libraries ... 45
Table 3.1
Total Mapped Reads for 4C-Seq Libraries ... 69
Table 3.2
BACs, Fosmids, and Probes ... 80
LIST OF FIGURES
Figure 2.1
F1 Trophoblast Stem Cells ... 13
Figure 2.2
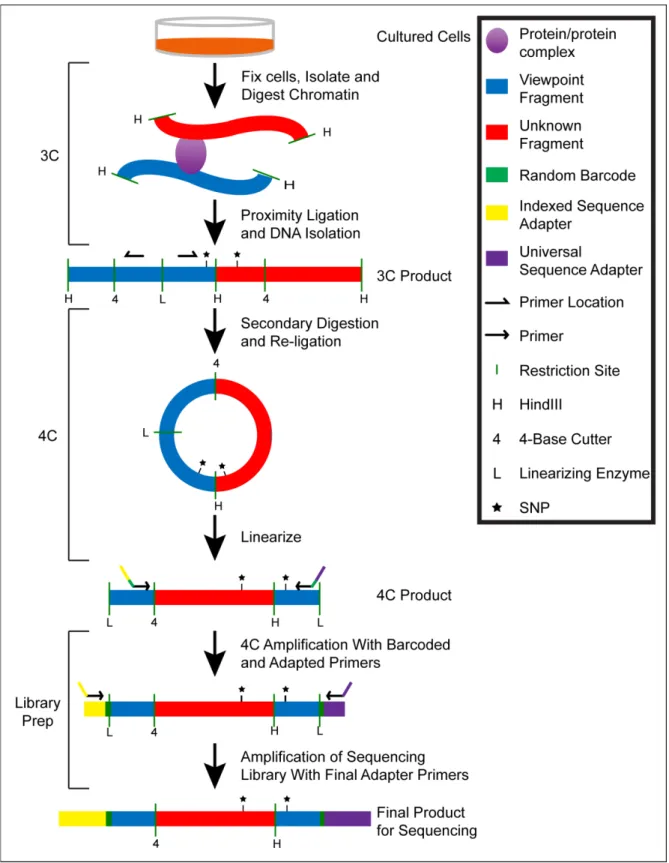
Process for Generating a 4C-Seq Library ... 19
Figure 2.3
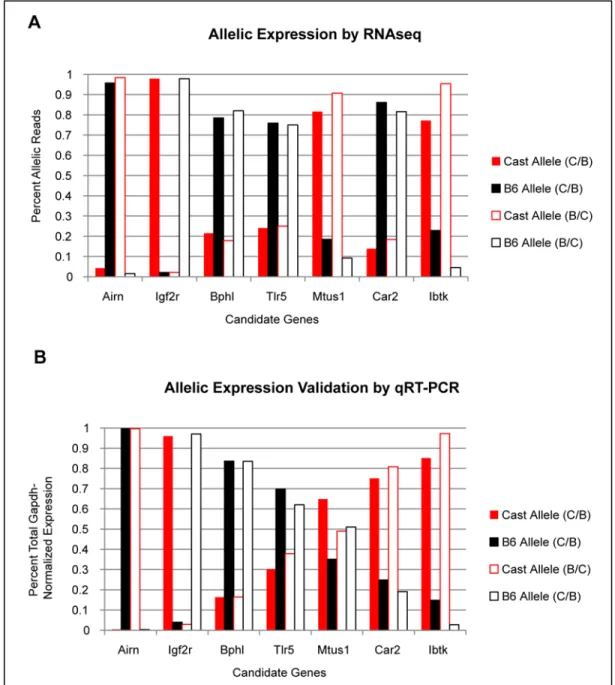
Validation of Allelic Expression Bias in Candidate Genes ... 28
Figure 2.4
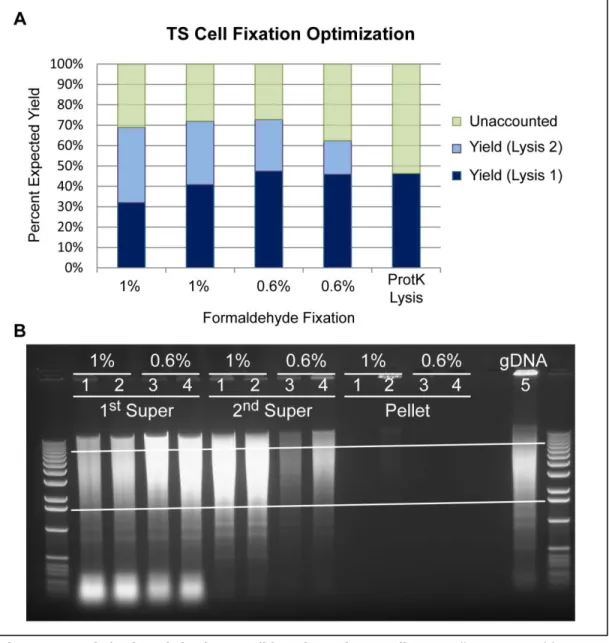
Optimization of Fixation Conditions for 3C in TS Cells ... 32
Figure 2.5
Optimization of Lysis Conditions for 3C in TS Cells ... 33
Figure 2.6
Optimization of Ligation Conditions for 3C in TS Cells ... 35
Figure 2.7
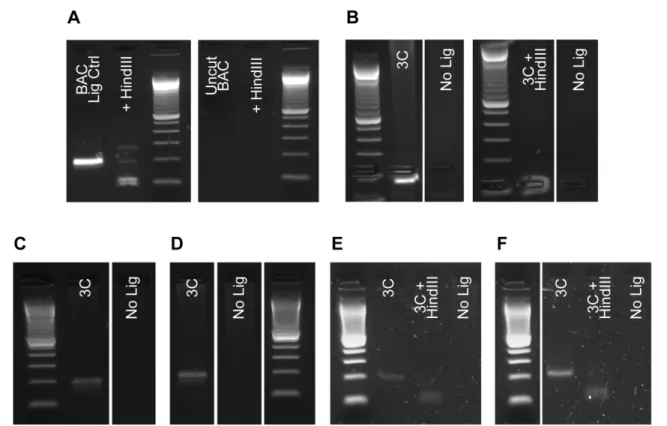
3C Libraries and Amplification Controls ... 38
Figure 2.8
4C-Libraries and Amplification Controls ... 44
Figure 2.9
Optimal Permeabilization Conditions for FISH in TS Cells ... 53
Figure 2.10
Optimal Fixation Conditions for FISH in TS Cells ... 55
Figure 2.11
Minimization of Size for FISH Probes in TS Cells ... 56
Figure 3.1
Reads Distribution for Ibtk Allelic 4C-Seq Test Experiment ... 63
Figure 3.2
Significant Interactions and Allelic Comparison for Ibtk 4C-Seq Test Experiment ... 64
Figure 3.3
Low Proportion of Mappable Reads in Large Allelic 4C-Seq Experiments ... 66
Figure 3.4
Proportion of Reads Lost to Primer-Dimer Contamination ... 68
Figure 3.5
Mapped Reads Distributions for Allelic 4C-Seq Experiments ... 71
Figure 3.7
Validation of fourSig Prioritization Algorithm ... 74
Figure 3.8
Allelic Comparison of Broad Ibtk Significant Contacts ... 76
Figure 3.9
Allelic Bias in Contact Probability at a Putative Enhancer for Ibtk ... 77
Figure 3.10
Probe Design for Validation of Interactions by FISH ... 79
Figure 3.11
Validation of Selected Interactions by FISH ... 83
Figure 3.12
Set Analysis of Airn 4C-Seq Libraries ... 86
Figure 3.13
Allelic Comparison of Broad Airn Significant Contacts ... 87
Figure 3.14
Set Analysis of Car2 and Bphl 4C-Seq Libraries... 89
Figure 3.15
Allelic Comparison of Broad Significant Contacts for Car2 and Bphl. ... 91
LIST OF ILLUSTRATIONS
Illustration 2.1 Allelic 4C-Seq Candidate Suitability ... 16
Illustration 2.2 A Method for Determining Enriched Interactions ... 48
Illustration 2.3 Prioritization of Enriched Contacts by Likelihood of Reproducibility ... 50
LIST OF ABBREVIATIONS
3C
Chromosome conformation capture
3-D
Three-dimensional
4C
Circular Chromosome Conformation Capture
4C-Seq
Circular Chromosome Conformation Capture with Sequencing
5C
Chromosome Conformation Capture Carbon Copy
BAC
Bacterial Artificial Chromosome
B6
C57BL/6 Mouse Strain (M.m. domesticus)
bp
Base Pairs
CAST
CAST/Eij Mouse Strain (M.m. castaneous)
cDNA
Complementary Deoxyribonucleic Acid
ChIP
Chromatin Immunoprecipitation
ChIP-Seq
Chromatin Immunoprecipitation with Sequencing
CpG
Cytosine-phosphate-Guanine
cm
Centimeter
CSK
Cytoskeletal Buffer
CTCF
CCCTC-binding Factor
DAPI
4’,6-Diamidino-2-Phenylindole
dCTP
Deoxycytidine Triphosphate
dUTP
Deoxyuridine Triphosphate
DNA
Deoxyribonucleic Acid
DNase
Deoxyribonuclease
dsDNA
Double-Stranded Deoxyribonucleic Acid
FAIRE
Formaldehyde-Assisted Isolation of Regulatory Elements
FB
Fetal Brain
FBS
Fetal Bovine Serum
FDR
False Discovery Rate
FISH
Fluorescent in situ Hybridization
FL
Fetal Liver
gDNA
Genomic Deoxyribonucleic Acid
H3K4me1
Histone H3 Lysine 4 Monomethylation
H3K4me2
Histone H3 Lysine 4 Dimethylation
H3K4me3
Histone H3 Lysine 4 Trimethylation
H3K27ac
Histone H3 Lysine 27 Acetylation
H4K20me1
Histone H4 Lysine 20 Monomethylation
ICE
Imprinted Control Element
LCR
Locus Control Region
LN
2Liquid Nitrogen
M
Molar
m
Meter
mM
Millimolar
Mb
Megabase
mm9
Mouse Genome Sequencing Consortium Genome Assembly Version 37
mRNA
Messenger RNA
ng
Nanogram
nm
Nanometer
PBS
Phosphate Buffered Saline
PCR
Polymerase Chain Reaction
PFA
Paraformaldehyde
pol II
RNA Polymerase II
qPCR
Quantitative Polymerase Chain Reaction
qRT-PCR
Quantitative Reverse Transcription Polymerase Chain Reaction
RCF
Relative Centrifugal Force
RFLP
Restriction Fragment Length Polymorphism
RNA
Ribonucleic Acid
RNA-Seq
RNA Sequencing
RPM
Revolutions Per Minute
RPMI
Roswell Park Memorial Institute medium
RT
Reverse Transcriptase
RT-PCR
Reverse Transcription Polymerase Chain Reaction
SDS
Sodium Dodecyl Sulfate
SNP
Single Nucleotide Polymorphism
SSC
Saline-Sodium Citrate Buffer
TAD
Topologically Associated Domain
T4
Enterobacteria Phage T4
TE
Tris-EDTA Buffer
TF
Transcription Factor
TS
Trophoblast Stem
TSS
Transcription Start Site
UCSC
The University of California, Santa Cruz
UNC
The University of North Carolina at Chapel Hill
µg
Microgram
µL
Microliter
LIST OF SYMBOLS
3’
Three Prime
5’
Five Prime
C(t)
Threshold Cycle
Gapdh
Glyceraldehyde-3-phosphate (mouse gene)
Hbb-b1
Hemoglobin, beta adult major chain (mouse gene)
Ibtk
Inhibitor of Bruton agammaglobulinemia tyrosine kinase (mouse gene)
NFx2
No Feeders in Culture for 2 Passages
W
Window Size in fourSig program
X
Significance threshold calculated by fourSig program
∆
Difference
CHAPTER 1: INTRODUCTION
Introduction
Studies of how chromatin is organized have suggested that the three-dimensional (3-D)
architecture of chromosomes, exhibited as both long- and short-range spatial interactions of genomic
elements, may have a profound effect on gene expression. Variations of chromosome conformation
capture (3C) have been used to demonstrate that specific loci, such as enhancers and promoters,
can be separated by megabases (Mb) of linear sequence or, in some cases, located on different
chromosomes yet are arranged in closer spatial proximity than intervening loci (Dekker et al. 2002;
Dostie et al. 2006; Simonis et al. 2006; Zhao et al. 2006; Fullwood et al. 2009; Lieberman-Aiden et al.
2009). Such interactions have been associated with specific biological contexts including specificity
of cell identity (Ferraiuolo et al. 2010) and response to extrinsic cues (Fullwood et al. 2009). These
observations have led to the suggestion that higher-order chromatin conformation may be indicative
of or directly involved in normal cellular processes. It has also been suggested that chromatin
conformation may be altered in disease states, signifying its value as either a potential therapeutic
target or as a biomarker (Crutchley et al. 2010). Therefore, understanding the dynamics of 3-D
chromosomal architecture as it relates to gene expression is an important area of molecular biology
whose exploration, to date, has been largely limited to a handful of model loci.
The proposed project and subsequently performed work described here will focus on
expression patterns in descendent daughter cells(Yan et al. 2002; Knight et al. 2003; Pandey et al.
2013). Previous work in the Magnuson Laboratory established the use of mouse trophoblast stem
(TS) cells as a model system for studying various expression and epigenetic properties with allele
specificity (Calabrese et al. 2012, see Chapter 2). Preliminary analysis of these datasets has
revealed several non-imprinted genes that exhibit allelic biases in both their expression levels and in
their occupancy of various chromatin modifications.
The joining of chromosome conformation experiments with the study of allelic bias in
expression and chromatin landscapes represents an opportunity to apply relatively uncommon
methodologies to an understudied biological phenomenon. The goal in the work described here was
to use genes known to exhibit allelic expression bias as candidates to interrogate the allele-specific
nature of chromosome conformations. The results (1) illuminate the degree to which chromosome
conformation varies between copies of the same gene and (2) apply a basic interrogation of the
hypothesis that chromosome conformation is functionally associated with control of gene expression.
Three-Dimensional Structure of the Genome
1.77 meters (m) of DNA. When one considers that the average diameter of a mammalian nucleus is
only around 6 micrometers (µm) (Alberts et al. 2002), that 1.77 m of DNA must be condensed by
numerous packaging proteins, and that various regulatory factors must be free to access and
dissociate from the DNA, it becomes clear that the nucleus is a very crowded environment and that
efficient organization schemes must be in place for proper function to occur.
Chromatin in Organization and Regulation
The condensation of chromosomes varies with cell cycle, ranging from a highly compact state
during mitosis to a more dynamic, though still occasionally highly condensed, state (i.e., chromatin)
during the interphases (Rajapakse and Groudine 2011)
.In both states, the DNA polymer is wrapped
around histone octomers, known as nucleosomes, which in turn are coiled or supercoiled into various
secondary and tertiary structures depending on the phase of the cell cycle or current requirements for
access
.This ability to vary the condensed states of a chromosome is important for good organization
and the malleability of this organization is necessary for functional regulation.
Genes are typically under tight control by regulatory mechanisms that ultimately determine
the presence, absence, and abundance of most of the biomolecules within a cell. Consequently, the
regulation of gene expression and replication requires that the nucleosomes be accessible to various
regulatory proteins, RNAs, and other small molecules during all phases of the cell cycle (Beck et al.
2010)
.Two features central to the control of how tightly chromatin is compacted are histone
modifications, methylation of the phosphate backbone between cytosines and guanines (CpG) has
been well established as a mechanism for repressing functional regulation of DNA (Jones 2012).
DNA methylation is traditionally associated with long-term silencing of genes that is maintained
through cell divisions.
Beyond histone modification and DNA methylation, which lay the framework for association
with regulatory factors, chromatin dynamics are influenced directly and indirectly by many other
biomolecules. Chromatin remodeling factors may slide nucleosomes around to modify accessibility to
DNA binding motifs (Hargreaves and Crabtree 2011). Non-coding RNAs, messenger RNAs (mRNA)
that do not code for proteins, may block access to regulatory sites by hybridization or association with
bound factors (Bierhoff, Postepska-Igielska, and Grummt 2013; Roberts, Morris, and Weinberg 2013).
Additionally, various binding factors and structural proteins, such as the CCCTC-binding factor
(CTCF) and the nuclear lamina, may play roles in compartmentalizing chromatin into spatial domains
with differing propensities for active regulation and repression (Bickmore and van Steensel 2013).
These mechanisms and others, many of which likely remain currently unknown, all work in
combination to create a well-organized and highly dynamic system conducive to both packaging of
genetic material and functional accessibility; a concert whose fine-tuning and plasticity is essential for
healthy cellular function.
Chromosome Territories and Relative Proximity
Interphase chromosomes have long been observed to occupy “territories” that can be
observed by fluorescent microscopy (Heard and Bickmore 2007; Cremer and Cremer 2010). Simply
put, when nuclei are observed during interphase, fluorescent probes hybridizing to the same
have led to the hypothesis that genes whose expression are needed in high abundance tend to be
moved to regions containing a higher local concentration of transcriptional machinery, called
“transcription factories”, while genes not needed may be moved to the interior of the chromosome to
reduce their potential for expression (Bartlett et al. 2006; Sexton et al. 2007; Papantonis et al. 2010).
These transcription factories are known to occur for all three RNA polymerases and contain multiple,
active loci. Recruitment into specialized transcription factories, which may contain tissue-specific
transcription factors, may be a strategy for regulation of genes transcribed by RNA polymerase II (pol
II). For example, active alleles of Hbb-b1 and Eraf are found in nuclear foci enriched for RNA pol II in
erythroid cells where they are highly transcribed (Osborne et al. 2004). Consistent with this idea,
experiments providing an unbiased, genome-wide perspective of chromosomal interactions show that
actively transcribed domains tend to associate with other actively transcribed domains, while inactive
loci tend to cluster in an analogous manner (Lieberman-Aiden et al. 2009).
It remains unclear, however, whether this type of organization is directed by certain
sequences or factors and whether it is a general feature of transcriptional regulation. It is likely that
the formation of territories is simply a natural consequence of macromolecular crowding.
Chromosome Conformation Assays
3C is an experimental strategy that identifies the tendency of specific sequence elements in
the genome to be co-localized in 3-D space, independent of their linear positioning along a
chromosome. Initially developed by Job Dekker in 2002 to study general 3-D associations in the
yeast genome (Dekker et al. 2002), the technique quickly became very popular as a tool to study
potential effects of distal regulatory elements on gene expression. The genes in the mammalian
beta-globin locus, long known to be regulated by a centralized locus control region (LCR), have been
a target for extensive study by various techniques based on 3C. A wealth of data at this locus has
demonstrated that, not only can genes be influenced by regulatory elements located more than 100
kilobases (kb) away, but that the presence of specific long-range interactions can be tightly
associated with expression states indicative of cell identity (Tolhuis et al. 2002; Dostie et al. 2006;
Baù et al. 2011). Furthermore, some studies have suggested that long-range interactions can occur
on an even more dramatic scale. Interactions of regions separated by more than a Mb of sequence
have been observed in association with V(D)J-recombination (Skok et al. 2007; Jhunjhunwala et al.
2008) and, although more controversial, several genes have been reported to regularly engage in
significant interactions with regions on different chromosomes (Würtele and Chartrand 2006; Zhao et
al. 2006; Robyr et al. 2011). These data, along with many other studies, have provided growing
support for a hypothesis that spatial organization of chromosomes may influence expression
regulation by positioning distant regulatory elements in close spatial proximity to the regulated gene.
fragments formed with the initial fragmentation (Dekker et al. 2002; Tolhuis et al. 2002). Primers are
situated such that they will amplify the ligated hybrid sequences from a 3C library but not genomic
DNA (gDNA, See Chapter 2). Consequently, this technique provides only information regarding the
interaction of two pre-determined loci. Later, circular chromosome conformation capture (4C) was
developed, which employs the use of re-digestion of the 3C library followed by circular ligation of the
resulting fragments (Simonis et al. 2006; Zhao et al. 2006). Using microarray detection, amplification
from primers in opposing orientation can be used for a specific fragment to gain information on
unknown interacting loci with a desired locus. Additionally, in a variation known as chromosome
conformation capture carbon copy (5C), microarrays and sequencing were used to detect libraries
generated by amplifying conformation libraries with primers for several fragments within a 400 kb
region in the human beta globin locus to gain information on all interactions within the(Dostie et al.
2006). Finally, though generally yielding a low resolution, the advent of high-throughput sequencing
has allowed the development of 3C variations that can detect interactions occurring throughout the
genome without regard to specific loci or regions (Lieberman-Aiden et al. 2009; Fullwood et al. 2009).
In summary, the 3C assay was a substantial innovation that has led to the development of a plethora
of tools for observing spatial associations of genomic loci within the nucleus.
Allele-Specific Gene Expression
high-throughput sequencing offers an increasingly cost-effective platform for discriminating between
alleles, the degree to which allelic expression bias occurs within the genome and how allelic
differences in chromatin regulation are associated with them is still relatively unexplored. Considering
the dynamic nature and diverse mechanisms involved in nuclear processes, understanding the
degree to which different alleles behave differently is an important area of molecular biology.
Imprinting
It has long been known that maternal and paternal copies of the genome are not equivalent
and that both are required for viability (Surani and Barton 1983; McGrath and Solter 1984; Surani,
Barton, and Norris 1984). Allelic differences in gene expression and regulation have been
documented and extensively studied at well-known loci and discriminatory expression patterns
between alleles have most traditionally been associated with genomic imprinting, an epigenetic
phenomenon in which either the paternal or maternal copy of a gene is designated to be silenced in
the germline (Koerner and Barlow 2010).
Non-Imprinted Bias
In addition to imprinting, in which the vast majority of expression comes from a single allele,
genes with less extreme allelic biases and biases unrelated to parent-or-origin have been associated
with disease states including schizophrenia, obesity, and colorectal cancer (Sutherland and Walley
2009). These forms of allele-specific expression have been reported to affect as much as 12% of
detected transcripts in laboratory mouse strains (Keane et al. 2011). The existence of allele-specific
expression bias implies the presence of differential regulatory schemes between copies; schemes
that may be potentially related to spatial organization. Indeed, two recent studies have shown that
chromosome conformation can be differentially associated with loci exhibiting allelic expression bias
in both human colorectal cancer (Pittman et al. 2010) and lymphoblastoid cell lines (Cheung et al.
2010). Beyond potential involvement in imprinted regulation, these recent observations of
widespread allelic expression bias in multiple cell types suggest that allele-specific 3-D architecture of
chromosomes may be a general property of gene regulation throughout the genome. Further
exploration of the association of higher-order conformation with expression patterns must be
conducted in an allele-specific manner to verify whether this is the case.
Concluding Remarks and Hypothesis
Models of gene expression regulation have consistently evolved since their conceptual
introduction over half a century ago (Yaniv 2011). In eukaryotic systems, it is generally accepted that
expression of protein-coding genes occurs when the RNA pol II initiation complex, facilitated by the
binding of specific proteins to regulatory elements such as enhancers, binds the promoter of a target
gene and begins transcription (Ma 2011). Methods for controlling the selectivity of expression have
been demonstrated by the study of epigenetics, which has illuminated the employment of histone
modifications (Chi, Allis, and Wang 2010), DNA methylation (Jones 2012), and chromatin remodeling
(Hargreaves and Crabtree 2011) as regulators of accessibility of genes to the transcriptional
regulation and are further complicated by the requirement that chromosomes be confined to the
compact space of the nucleus.
It is frequently suggested in recent literature that long-range interactions, presumably
between enhancer elements and promoters, are an important factor in mediating gene expression
(Felsenfeld and Dekker 2012). Such “chromatin loops” are often described as regulatory models in
which active or repressive loops are suggested to exist as predominate chromosome conformations
that are tightly associated with expression states (Krivega and Dean 2012). These models are
supported by numerous investigations of well-studied models such as the beta-globin locus (Dostie et
al. 2006; Baù et al. 2011) and the Hox clusters (Ferraiuolo et al. 2010; Lee et al. 2010; Wang et al.
2011). If correct, it follows from these models that differential chromosome conformation patterns,
under various contexts, should be a widely observable property of loci that exhibit differential gene
expression.
Outright deletion of a chromosomal region to test the validity of this phenomenon as a
general property would create an uncertainty of affects due to possible changes in physical dynamics
of the entire locus as well as the possibility for eliminating the effects of potentially unrelated
protein-DNA interactions (Mirny 2011). Additionally, conformational differences between cell types exhibiting
divergent expression of a target gene could be attributed to possible differences in nuclear
organization between different cell types rather than related to the direct regulation of gene
expression at target loci (Tolhuis et al. 2002; Simonis et al. 2006). Therefore, the identification of
genes that exhibit regular and predictable allelic bias in expression and chromatin regulation within
the same cell would offer an excellent opportunity to test the hypothesis that the 3-D spatial
organization of a locus is a functionally associated property of differential gene expression.
CHAPTER 2: EXPERIMENTAL DESIGN AND OPTIMIZATION
Introduction
The 3-D context of spatial organization as it pertains to the regulation of gene expression was
introduced in the previous chapter. Predictions of the proposed hypothesis may be tested by
observing the existence of long-range interactions with allele-specific resolution in the context of
allelically biased gene expression. If interactions between distant loci, presumably between gene
promoters and distal regulatory elements, are a common and general phenomenon in expression
regulation, then consistent and specific interactions should be present and detectable by 4C with
sequencing (4C-Seq). Furthermore, when copies of the same gene exhibit differential expression
patterns, it would be expected that such interactions should maintain strong correlations with the
associated expression state. Simply put, when two copies of the same gene exhibit divergent
expression states, any distal interactions that may be functionally associated with active expression
should be observed at the active locus but largely absent from the repressed allele. Therefore, it was
proposed that 4C-Seq be performed in an allele-specific manner using the promoters of genes
showing a consistently strong bias of allelic expression as viewpoints.
TS cells derived from the F1 offspring of M.m. castaneous (CAST/EiJ, “CAST”) and M.m.
domesticus (C57Bl/6, “B6”) mice were established in the Magnuson Lab as part of an earlier genomic
Among these, a large number of single nucleotide polymorphisms (SNPs) allow for effective
discrimination of allelic origin by high-throughput sequencing. Therefore, as demonstrated by
Calabrese et al. (2012), the TS cells established in the Magnuson Lab can serve as a model system
for identifying allele-specific differences in genomic analyses.
In order to proceed with the plan to investigate allele-specific long-range interactions, several
experimental conditions and tools needed to be worked out. With the F1 TS cells as a model system
and the data from Calabrese et al. (2012) as a starting point, this chapter details the development of
the experimental design for performing 4C-Seq at genes exhibiting allelic bias in gene expression.
Strategy and Experimental Design
4C is a locus-centric chromosome conformation technique; meaning that genome-wide
interactions are captured with respect to a single locus known as the viewpoint. Therefore, it was
necessary to focus the experimental design on a handful of candidates that were ideal for performing
the assay. Additionally, the protocol for the 4C assay needed to be optimized to work with ideal lysis
conditions determined for TS cells. Optimization of these conditions was a necessary first step for
designing the experimental strategy.
Candidate Selection
Genes were then further categorized by identified allelic differences in chromatin regulation.
Calabrese et al. (2012) also performed allele-specific DNase-seq, FAIRE-seq, and ChIP-seq
experiments for H3K4me2, H3K27me3, H3K36me3, H4K20me1, pol II, and CTCF. Allelic biases in
distribution were determined for these datasets in the same manner as was done for the RNA-seq
data. Genes were categorized as having allelically biased chromatin signatures by assessing
whether any biases in signal for these datasets were present within 2.5 kb of a transcription start site
(TSS) of a gene. For this analysis, annotated TSS were taken from the UCSC Known Genes Table
(Hsu et al. 2006). A list of candidate genes for interrogation by 4C-Seq was generated from the
intersection of genes exhibiting biased expression and those with allelically biased chromatin
signatures.
linearization of the circularized DNA, and amplification of the captured fragment and known SNP.
One concern was that genes important for similar processes and roles may be subject to
similar types of regulatory control. In specific, if two allelically biased genes were to be involved in the
same pathway then it is possible that similar factors may be driving association with distal regulatory
elements. This scenario could be envisioned as genes required for the same pathways being
recruited to a transcription factory that is heavily involved with the regulation of the associated
pathway. Since the goal was to test the existence of functional association with long-range
interactions as a general property of gene expression, it was deemed preferable to avoid testing
genes that may be under similar or related regulatory pressures. Therefore, the filtered candidate
genes whose TSS were suitable for allele-specific 4C-Seq were subjected to gene ontology analysis
using the AmiGO web application (Carbon et al. 2009) to separate them into subgroups based on
similarity of biological process. To further streamline the selection of final candidate genes, it was
also required that, regardless of statistical significance, any selected genes must consistently have
meet a minimum allelic expression bias based on comparison of SNP containing reads from the
RNA-seq data. Taken together, allele-specific 4C-compatible candidate genes were further selected on the
requirements of having at least a 2-fold allelic expression bias in both F1 crosses and appearing in no
more than two of the top hierarchical functions in the biological process ontologies determined by
AmiGO. Seven final candidate genes were selected from the analyses to proceed with investigation
by allele-specific 4C-Seq (Table 2.1).
Allelic 4C-Seq
Gene Chr
Expression-Bias*
Biological Functions
Airn
17
-5.0397
lncRNA, imprinted & antisense to Igf2r (Lyle et al. 2000; Hudson
et al. 2010)
Igf2r
17
5.5100
Facilitates degradation of growth factors, imprinted (Barlow et al.
1991; Hudson et al. 2010; Suh et al. 2010)
Bphl
13
2.0419
Serine hydrolase, implicated in kidney cell proliferation and aging
(Melk et al. 2005; Grigo et al. 2008)
Mtus1
8
-2.6087
Identified as possible tumor suppressor in several lines (Louis et
al. 2010; Zuern et al. 2010; Ding et al. 2012; Zuern et al. 2012)
Tlr5
1
1.6215
Toll-like receptor, innate immunity, recognizes bacterial flagellin
(Letran et al. 2011; Weile, Josefsen, and Buschard 2011)
Car2
3
2.4129
Carbonic anhydrase II, deficiency is associated with osteopetrosis
(Margolis et al. 2008; Rajachar et al. 2009)
Ibtk
9
-2.5396
Tyrosine kinase inhibitor, involved in B-cell development and
maturation (Liu et al. 2001; Janda et al. 2011)
Table 2.1 Selected Candidates for Allelic 4C-Seq. Seven candidate genes were selected as described.
probability of forming ligations between loci that were in close 3-D space in the nucleus over the
formation of ligations between fragments that find each other randomly in solution. The resulting
ligation products are purified by reversing formaldehyde crosslinks and protein digestion followed by
several rounds of phenol and phenol-chloroform extraction to isolate the 3C templates from which the
4C libraries are made.
A significant challenge in the development of the protocol is the adaptation of the
experimental conditions for the desired cell type and restriction enzymes used in the 3C portion of the
process. Because steps are performed on fixed chromatin, there are no purifications and clean up
steps prior to the final isolations of the 3C ligation products. This means that all solutions and
reagents present in the nuclear lysis are still present during the digestion and that the restriction
enzyme is not removed from solution prior to ligation. Each step in the 3C process uses quenching of
ionic detergents with non-ionic detergents to prepare satisfactory conditions for the following
enzymatic reaction. For example, sodium dodecyl sulfate (SDS) is an ionic detergent that is used to
lyse the fixed nuclei. Since SDS is efficient at denaturing proteins, its presence in solution is not
conducive to restriction digestion. Typically, DNA would be purified prior to digestion by restriction
enzymes; however, since purification of the DNA would require the removal of the nuclear proteins
that are essential to generating the desired 3C products, the SDS must be neutralized before
fragmentation. The introduction of non-ionic detergents, such as Triton-X 100, in appropriate
proportions is thought to generate micelles that can encapsulate the ionic detergents
,thereby
neutralizing unwanted denaturation of the enzyme. The presence of non-ionic detergents, however,
is not exactly ideal for most enzymatic reactions
.This denaturation and quenching step is also
necessary after digestion to prevent unwanted cleavage of ligation products during the subsequent
proximity ligation. Therefore, conditions must be optimized to find minimal concentrations of
detergents to facilitate increased efficiency of enzymatic reactions (see “Generation of 3C Libraries”).
forward. The isolated 3C libraries are first trimmed by a second restriction digestion to shorten the
templates and ensure that linear products are present for a subsequent proximity ligation. The
second proximity ligation gives rise to circular products containing shortened portions of the viewpoint
and captured fragments which are linearized by digestion at a known site in the viewpoint. This
linearization offers a 4C template that is amplified more efficiently than circular products. While these
processing steps may generate many molecules, a significant proportion will consist of viewpoint
sequence flanking an unknown sequence that was “captured” due to a genomic interaction at the time
of fixation.
Controls
Chromosome conformation libraries are the result of several reactions and processes that are
strung together prior to detection and analysis. Therefore, it is important to establish control
experiments at several points throughout the process to ensure that the expected products are being
produced (Dekker 2006). Before proceeding with proximity ligations, electrophoretic migration in
0.8% agarose of undigested sample (nuclear lysate for the 3C step and 3C library for the 4C step) is
compared to a portion of the digested material to ensure efficient fragmentation. Additionally, each
time a proximity ligation is performed, a portion of the digested sample is kept as a no ligase control.
Efficient ligation can also be detected by tested by electrophoresis in comparison to the no ligase
controls.
is expected that a correctly manufactured 3C library should contain such a product, whose detection
in a 3C library and absence in a no ligase control can be used as an indicator of efficacious
production.
The amplification control for proper production of a 4C library is similar; however, due to the
locus-specific nature of the 4C template, an amplification control must be performed on an
assay-by-assay basis. Since the 4C process places sequence from the known viewpoint on either side of an
unknown fragment, no BAC control is necessary. The primer sequences designed for amplification of
the 4C template can be optimized using the 4C libraries directly. Once the amplification scheme is
efficiently optimized, simply testing for amplification in the no ligase samples and the source 3C
library provides a useful indicator or successful library generation.
Allelic Design and Expectation
Primer Strategy
Primer sequences for the amplification of 4C libraries were designed from the viewpoint
sequence such that each primer was close to either the 3C or 4C restriction end, facing 5’ 3’ in the
direction of the nearest restriction end, completely homologous to both strains, and positioned to
amplify at least one SNP between CAST and B6 (Illustration 2.1). The orientation requirement
ensures that amplification should not be possible from genomic DNA or 3C libraries, but only from
digested and re-ligated 4C libraries. The strain blindness of the primer sequence is intended to
ensure equal amplification efficiency between alleles from a single amplification event. Finally, the
capture of a SNP in the viewpoint fragment is what allows for the discrimination of allelic origin of the
viewpoint. Since these amplification products were to be sequenced using 2x100 bp on the Illumina
HiSeq 2000, a double amplification strategy was designed to amplify the product while simultaneously
adding sequencing adapters (Figure 2.2, bottom). Genomic primer sequences were appended to
contain a portion of the desired sequencing adapter. Additionally, it was advised by the UNC
High-Throughput Sequencing core facility that a random linker be introduced between the genomic
sequence and the sequencing adapter. The presence of random bases at the start of the sequencing
read facilitates an increased resolution of cluster identification on the Illumina platform
,which should
lead to a higher retention of reads in the final data. Additionally, this random linker creates a variable
barcode on each amplified read that can be used to determine the potential presence of amplification
bias in the library preparation (see Chapter 3). The product from this initial amplification is then
size-selected to fit the needed specifications of the sequencer and amplified with primers containing
sequence homologous to the 5’ portion of the adapter used in the previous amplification as well as
the remainder of the sequencing adapter. Purification of this amplified product will yield a 4C-Seq
library that is ready to be sequenced.
Intentions for Mapping and Analysis
Illumina TruSeq indexes to determine library origin. The use of these indexes combined with the
sequence of the viewpoint in the resulting read allows for an effective multiplexing strategy
Specifically, all 4C libraries from one cell line replicate can be sequenced on a single lane using the
same TruSeq index. The same lane can also contain all 4C libraries from a reciprocal cell line
replicate using a different TruSeq index. This allowed 14 experiments to be sequenced in a single
lane by using the adapter index to identify the replicate to which a read belongs and the viewpoint
sequence to identify the library to which a read belongs.
Sequenced reads were to be sorted into experiments based on their appropriate replicate,
library, and allele. Subsequently, the portion of the read that did not map to the viewpoint (captured
fragment) was mapped to reference genomes to determine position and, where SNPs are available,
allelic origin. Significant interactions were identified using novel statistical methods loosely based on
a previously reported algorithm (Splinter et al. 2011) and analyzed for reproducibility and association
with expression state (see “fourSig: A Novel 4C-Seq Analysis Method”). Interactions that were
reproducible amongst replicates and exclusive to a specific and consistent expression state in both
cell lines were scored as having a potential functional association with the expression regulation of
the candidate gene.
Validation of Allelic Expression Bias in Candidate Genes
Name
Sequence
Description
Gapdhf1
TGTTCCTACCCCCAATGTGT
Forward primer
Gapdhr1
TGTGAGGGAGATGCTCAGTG
Reverse primer
Ibtk_1fb
CTGTGCGAGACTTGAGTATTTCC
Forward cDNA primer, B6-specific
Ibtk_1fc
TCTGTGCGAGACTTGAGTATTTCT
Forward cDNA primer, CAST-specific
Ibtk_1r
GCCACGACAAGAACACTACAA
Reverse cDNA primer
Airn_e2s2BF
GCCATCACCTAACAGGGACATC
Forward cDNA primer, B6-specific
Airn_e2s2CF
GCCATCACCTAACAGGAACAGC
Forward cDNA primer, CAST-specific
Airn_e2s1R2
TCACATGCTGAGGCAAGAGC
Reverse cDNA primer
Igf2r_e45s1BF CAGAGTTCAGCCACGAGACCG
Forward cDNA primer, B6-specific
Igf2r_e45s1R2 CCATGCCACAGACCAGATAGC
Reverse cDNA primer for B6 amplicon
Igf2r_e14s1CF TGCTAAGAGCTGCAAGATCCG
Forward cDNA primer, CAST-specific
Igf2r_e14s1R2 ACACAGCAAGAAGACGCTTGG
Reverse cDNA primer for CAST amplicon
bphl_e2s1BF
CATTACCAGCGCGTGGGAGA
Forward cDNA primer, B6-specific
bphl_e2s1CF
CATTACCAGCGCGTGGGAAA
Forward cDNA primer, CAST-specific
bphl_e2s1R3
TCGACTTTGAGCAAGGCAAAT
Reverse cDNA primer
mtus1_e2s7BF CTTCATTATGGAAGTGTCTTTGGGTT
Forward cDNA primer, B6-specific
mtus1_e2s7CF CTTCATTACGGAAGTGTCTTTGGGCT
Forward cDNA primer, CAST-specific
mtus1_e2s7R1 AGATGCTAAACGTGCACCAA
Reverse cDNA primer
tlr5_e4s10BF
TTTGAAGAAAGAGACTTCATTCCGG
Forward cDNA primer, B6-specific
tlr5_e4s10CF
GCTTTGAAGAAAGAGACTTTATTCCAG Forward cDNA primer, CAST-specific
tlr5_e4s10R2
GGCTCTGGGCATACCTGAAG
Reverse cDNA primer
Table 2.2 Primers for Allele-specific qRT-PCR Assays. Primers used for allele-specific qRT-PCR assays are
unintended allele (Singer-Sam 1994). Two slightly different strategies were used for the design of
these amplicons.
For the majority of the selected candidates, forward primers were designed to align over
SNPs in the transcribed region of the gene. The TM Mismatch feature of the OligoAnalyzer tool from
Integrated DNA Technologies, Inc. (http://www.idtdna.com/analyzer/applications/oligoanalyzer/) was
used to estimate the least energetically favorable hybridization to cross-allele sequence for potential
primers, thereby minimizing the number of primers needed to settle on an assay. Additionally,
amplicons were designed to detect unspliced transcripts. Because amplification efficiency needed to
be optimized for the correct allele in opposition to the incorrect allele for each assay, gDNA from
allelic isotype mice was used as an ideal template to test the ability of the allele-specific assays to
effectively discriminate between alleles.
Two of the candidate genes, Ibtk and Car2, had previously been studied by Dr. Joshua
Starmer, a post-doc in the Magnuson Lab, as part of an earlier observation of allelic expression bias
in hybrid TS cells. As a result, allele-specific qRT-PCR assays had already been designed for these
two genes. To verify allelic expression bias, Dr. Starmer designed intron-skipping amplicons to detect
allele-specific cDNA templates by placing a SNP at the most 3’ nucleotide of the forward primers and
pairing them with a common reverse primer. Because these assays were designed to detect cDNA
made from processed transcripts, RT products from allelic isotype cells needed to be prepared for
use in efficiency optimization and as positive and negative controls.
Expression can be measured in qPCR assays as a relative abundance calculation using the
following equation:
∆C(t) = E
(C(t)Control – C(t)Test)where C(t) is the threshold cycle determined in the qPCR experiment, “Test” refers to the
because the assays designed here are intended to detect allele-specific products by exploiting
differences in efficiency of amplification between the favored and unintended alleles, it was deemed
important to use accurately determined efficiencies for each amplification assay. Furthermore, it was
also necessary to normalize the expression to a reference gene with no allelic bias for comparison of
replicates. In the event that they are not very close to 2, efficiencies were needed for both the test
and referenced amplification reactions to normalize ∆C(t) values using the Pfaffl equation (Pfaffl
2001):
∆∆C(t) = ∆C(t)
Gene/ ∆C(t)
ReferenceA qPCR assay lacking allele specificity for Gapdh was used as a reference to determine the
normalized ratio. To determine the efficiencies for each assay, qPCR was performed in triplicate on
1:10 serial dilutions of optimal template. Average C(t)s were plotted against Log
10-transformed mass
of input DNA used to determine linear regression lines, from which efficiency was calculated using the
following equation:
E = 10
(-1/m)where “m” is the slope of the linear regression line (See Appendix). Efficiencies were calculated
similarly for the cross-allelic templates (e.g., B6 assay using a CAST template) to ensure that a
substantial loss of efficiency occurs. Such an absence of efficient amplification is necessary to
ensure that transcript detected in the F1 TS cells is not due to unintended amplification of the
unintended allele.
Figure 2.3 Validation of Allelic Expression Bias in Candidate Genes. A. The proportion of allele-specific reads detected from RNA-seq experiments in two different TS cell lines show heavy
experiment (Figure 2.3). With the exception of Car2 and Mtus1, this analysis resulted in the faithful
validation of allelic expression bias in each case.
While Car2 does show a bias in detected expression, the qRT-PCR analysis shown here
identifies a bias in the opposite direction of what was originally observed in the RNA-seq experiments
(Figure 2.3). This may be explained by the use of allelic isotype cDNA as the baseline control. All
cDNA products were made from RT reactions using a starting amount of 2.5 nanograms (ng) RNA.
Therefore, unlike the gDNA templates which should have near equivalent amounts of all templates in
solution, it is possible that varying expression levels between samples could result in differing
amounts of individual templates within the RNA solution. Previous experiments by Dr. Starmer in the
Magnuson Lab have suggested that Car2 expression is expressed at different levels in the isotype
lines and that the expression levels for each allele seen in the F1 TS cell lines are actually different
than what is observed in a homozygous line (unpublished data). Therefore, while the isotype cDNAs
serve as a good control to ensure discriminatory detection between the allelic assays, differences in
template concentration may make them poor controls for comparing normalized relative expression.
Indeed, the average C(t) values alone suggest that the B6 template reaches C(t) at more than 2
cycles earlier than the CAST template in each test (data not shown). This translates to more than a
4-fold enrichment of B6 template relative to CAST in the test samples, which is very similar to what
was originally found by RNA-Seq. For Ibtk, the other gene that used an allelic isotype cDNA as the
control
sample, comparison of C(t)s for each allele was consistent with calculated ∆∆C(t) values and
both were reflective of the strong CAST bias seen in the RNA-seq experiments (data not shown).
With this data in hand, the decision was made to proceed with the 4C-Seq experiments for all genes
rather than wait to design new allelic qRT-PCR assays for Car2 and Ibtk.
Generation of 3C Libraries
protocol were optimized concurrently and most of the final conditions at each step were dependent
upon results obtained in the following step. In other words, steps were not always optimized one at a
time so some final conditions were settled on using conditions in the following step that may have
changed later. Additionally, once the protocol is settled, the generation of 3C libraries must still be
subjected to several controls along the way to ensure the quality of the library. Here the measures
taken to arrive at the final optimized steps in the protocol for performing 3C in TS cells (see Chapter
5) and the generation of the libraries used in the 4C-Seq experiment are summarized.
Handling of TS cells
The first thing that required optimization was the isolation of tissue, which focused
concurrently on two distinct factors. First, TS cells are typically grown on a feeder layer of fibroblasts,
which are necessary to preserve maximally uniform morphology of TS cells in culture and is thought
to help guard against variable differentiation amongst colonies (Quinn, Kunath, and Rossant 2006).
Maintaining a high level of uniformity of a physiological indicator, such as morphology, is important for
genomic assays because the result is a reflection of cell populations rather than individuals.
However, the presence of two distinct cell types within the population is unacceptable because there
is no way to distinguish the source of the detected DNA. TS cells can be grown off of feeders for a
few passages before morphology becomes visibly compromised. It was ultimately settled that, after
having harvested several batches of TS cells, growing them off of feeders for 2 passages (NFx2)
offered the highest likelihood of preserving good uniform morphology while eliminating nearly all
feeders from culture.
isolation occurred in batches, trypsin exposure was typically staggered with dispersed cultures being
pooled and quenched in RPMI with 10% fetal bovine serum (FBS) on ice until all plates were
processed. TS cells would then be fixed, quenched, flash-frozen in liquid nitrogen (LN
2), and stored
at -80
oC until needed for 3C library preparations.
Optimization of Fixation
Nuclei are isolated by lysing cells with a non-ionic detergent (IGEPAL-CA630) in a dounce
homogenizer. Chromatin is released from this fraction by nuclear lysis in a restriction digestion buffer
with SDS, which should be kept to a minimum to reduce the amount of residual detergents in
downstream steps. The optimization of this lysis, however, was also dependent upon fixation
conditions. The published 3C protocols that used as a starting point called for 1% formaldehyde to fix
cells (Lieberman-Aiden et al. 2009), however the ChIP-seq experiments in these TS cells that were
used to screen candidate genes use 0.6% formaldehyde for fixation (Calabrese et al. 2012).
Conversations with Dr. J. Mauro Calabrese revealed that he had previously had problems with lysis
by sonication, a harsher method than detergent-based lysis, with nuclei fixed with 1% formaldehyde.
Dr. Calabrese had postulated that, because TS cells may be somewhat “tough”, higher fixation
concentrations make for a difficult lysis. By reducing fixation to 0.6% formaldehyde, Dr. Calabrese
was able to more efficiently lyse TS cells without compromising the preservation of protein-DNA
interactions. Therefore, nuclei fixed with both 0.6% and 1% formaldehyde were used to test efficient
isolation of chromatin.
Nuclei were resuspended with 0.5% SDS and incubated at 65
oC for 10 minutes with periodic
agitation. At the time, nuclei were being lysed, quenched, and digested and the end product
the isolated DNA was found to be digested into the expected range of products in the 1%
formaldehyde solutions. This, combined with a fear of under-preserving protein-DNA interactions
(Splinter, Grosveld, and de Laat 2004) resulted in the decision to proceed with a 1% formaldehyde
fixation.
Optimization of Lysis
The minimization of SDS concentration in the lysis conditions is important to reduce the
amount of Triton X-100 present in the digestion and ligation steps. Through several trial-and-error
experiments, it was discovered that a 10-fold excess of Triton X-100 to SDS used provides an optimal
quenching of ionic detergent so as to not interfere with HindIII digestion. To settle in on the final
conditions of 0.2% SDS for lysis and 2% Triton X-100 for quenching, DNA collected from lysis and
digestion using a gradient of 10-fold quenching conditions in single- and double-digestion
experiments was analyzed for quantity and fragmentation (Figure 2.5). The 0.2% SDS/2% Triton
X-100 conditions offered the best combination of consistent DNA yield and ideal fragmentation by
HindIII as compared to an ideal digest on naked gDNA.
Optimization of Ligation
Figure 2.6 Optimization of Ligation Conditions for 3C in TS Cells. Digested lysates from TS cells were tested for optimal quenching of SDS prior to proximity ligation. 0.2% SDS/ 2% Triton X-100 conditions were used for lysis of 1% formaldehyde fixed cells. A.
possibility of using only heat to inactivate HindIII. A clear improvement in the amount of ligated
product could be seen with increased Triton X-100 treatment (Figure 2.6A). Although heat
inactivation alone produced a tighter ligation product, the intensity of the product on the gel seemed
to suggest that more DNA was ligated using the 2% Triton X-100 condition. Since increasing Triton
X-100 concentration seemed to have a positive effect, a second experiment was performed using a
concentration gradient of 2%, 2.5%, and 3% (Figure 2.6B). The 3% Triton condition appeared to
generate the highest intensity ligation products while leaving the least amount of streaking in the
digested sample range (2 – 8 kb). Therefore, inactivation of HindIII with approximately 1.5% SDS
followed by proximity ligation in a solution containing 3% final concentration of Triton X-100 were
selected as the working conditions for the ligation step.
The remainder of the 3C portion of the process involves several rounds of DNA extraction
and precipitation aimed at cleaning up the 3C libraries and reducing the volume of solution. Several
tips and tricks were found through experience to improve yield and facilitate work-flow along the way.
Though not summarized in detail here, these specifics may be found in the detailed protocol (see
Chapter 5)
Library Preparation
3C libraries were prepared by initial lysis of TS cells, quenching of SDS by TritonX-100,
restriction digestion with HindIII and proximity ligation with T4 DNA Ligase (See Chapter 5). During
the preparation, a portion of the digested product was withheld from the ligation reaction to serve as a
control for effective production of the 3C libraries. Quality can be tested by comparing the
electrophoretic migration of the re-ligated and non-ligated products in an agarose gel (not shown).
More importantly, a high quality library should generate ligation products between adjacent fragments
in favorable abundance for detection by PCR.
3C Library Prepared TS Line
Cross
Harvested Passage
3C_6#2_A
3/5/2012 TS 6#2
CASTB6F1 2/20/2012
17
3C_6#2_B
5/12/2012 TS 6#2
CASTB6F1 2/20/2012
17
3C_6#2_C
5/14/2012 TS 6#2
CASTB6F1 4/3/2012
17
3C_10#1_C
5/19/2012 TS 10#1
B6CASTF1 4/20/2012
15
3C_10#1_D
5/21/2012 TS 10#1
B6CASTF1 3/3/2012
16
Table 2.3 3C Libraries. Large 3C Libraries used as source material for