Maternal dietary intake during pregnancy and offspring body
composition: The Healthy Start Study
Tessa L. Crume,
Colorado School of Public Health, University of Colorado Denver Anschutz Medical Center, Department of Epidemiology
John T. Brinton,
Colorado School of Public Health, University of Colorado Denver Anschutz Medical Center, Department of Biostatistics and Informatics
Allison Shapiro,
Colorado School of Public Health, University of Colorado Denver Anschutz Medical Center, Department of Epidemiology
Jill Kaar,
University of Colorado Denver Anschutz Medical Center, School of Medicine, Department of Pediatrics and Nutrition
Deborah H. Glueck,
Colorado School of Public Health, University of Colorado Denver Anschutz Medical Center, Department of Biostatistics and Informatics
Anna Maria Siega-Riz, and
Gillings School of Global Public Health, Departments of Epidemiology and Nutrition, University of North Carolina at Chapel Hill
Dana Dabelea
Colorado School of Public Health, University of Colorado Denver Anschutz Medical Center, Department of Epidemiology
Abstract
Corresponding Author (and requests for reprints): Tessa Crume, PhD MSPH, Assistant Professor, Department of Epidemiology, Colorado School of Public Health, University of Colorado Denver, 13001 East 17th Ave, Box B119, Room W3137, Aurora, CO 80045, Tel: 303-724-4452, Fax: 303 724-4620, [email protected].
Disclosures: Authors have nothing to disclose. Clinical Trial Registration: NCT02273297
Paper presented as a poster at the American Diabetes Association 74th Scientific Sessions in San Francisco, California, USA on June 14, 2014.
Disclaimer: Contents are the authors’ sole responsibility and do not necessarily represent official NIH views.
Publisher's Disclaimer: This is a PDF file of an unedited manuscript that has been accepted for publication. As a service to our
customers we are providing this early version of the manuscript. The manuscript will undergo copyediting, typesetting, and review of
HHS Public Access
Author manuscript
Am J Obstet Gynecol
. Author manuscript; available in PMC 2017 November 01.Published in final edited form as:
Am J Obstet Gynecol. 2016 November ; 215(5): 609.e1–609.e8. doi:10.1016/j.ajog.2016.06.035.
A
uthor Man
uscr
ipt
A
uthor Man
uscr
ipt
A
uthor Man
uscr
ipt
A
uthor Man
uscr
Background—Consistent evidence of an influence of maternal dietary intake during pregnancy on infant body size and composition in human populations is lacking, despite robust evidence in animal models.
Objective—To evaluate the influence of maternal macronutrient intake and balance during pregnancy on neonatal body size and composition, including fat mass and fat free mass.
Study Design—The analysis was conducted among 1040 mother-offspring pairs enrolled in the prospective pre-birth observational cohort: The Healthy Start Study. Diet during pregnancy was collected using repeated 24 hour dietary recalls (up to 8). Direct measures of body composition were obtained using air displacement plethysmography. The National Cancer Institute
measurement error model was used to estimate usual dietary intake during pregnancy.
Multivariable partition (non-isocaloric) and nutrient density (isocaloric) linear regression models were used to test the associations between maternal dietary intake and neonatal body composition.
Results—The median macronutrient composition during pregnancy was 32.2% from fat, 15.0% from protein and 47.8% from carbohydrates. In the partition multivariate regression model, individual macronutrient intake values were not associated with birth weight or fat free mass, but were associated with fat mass. Respectively, 100 kilocalorie increases in total fat, saturated fat, unsaturated fat and total carbohydrates were associated with 4.2 gram (p=0.03), 11.1 gram
(p=0.003), 5.9 gram (p=0.04) and 2.9 gram (p=0.02) increases in neonatal fat mass, independent of pre-pregnancy BMI. In the nutrient density multivariate regression model, macronutrient balance was not associated with fat mass, fat free mass or birth weight after adjustment for pre-pregnancy BMI.
Conclusions—Neonatal adiposity, but not birth weight, is independently associated with increased maternal intake of total fat, saturated fat, unsaturated fat, and total carbohydrates, but not protein, suggesting that most forms of increased caloric intake contribute to fetal fat accretion.
Keywords
birth weight; dietary intake; fetal growth; fetal programming; neonatal body composition; nutrition during pregnancy; saturated fat
Introduction
There is significant interest in the role of maternal dietary intake during pregnancy on offspring body size and composition. Epidemiologic studies have demonstrated that human fetal growth can be influenced by variations within the normal range of dietary intakes in high income counties 1. Animal studies have consistently demonstrated a relationship between prenatal intake of a high-fat diet and offspring adiposity and metabolic
dysfunction 2. In rodent models, over-feeding of a high-fat or high-cholesterol diet during pregnancy and lactation results in an obese phenotype in the offspring that closely resembles human metabolic syndrome, including increased adiposity 3–6. Human studies are less conclusive7–12, and prone to substantial methodological limitations. Most studies of pregnant women have relied upon food frequency questionnaires7–12, prone to measurement error, which can result in a loss of statistical power to detect a true effect13. Inconsistencies in the findings from previous studies of the role of maternal dietary intake on offspring body
A
uthor Man
uscr
ipt
A
uthor Man
uscr
ipt
A
uthor Man
uscr
ipt
A
uthor Man
uscr
size at birth or composition may be explained, in part, by inadequate adjustment for measurement error associated with food frequency questionnaires when applying energy-adjustment models14. Observational studies of pregnancy diet relying upon food frequency questionnaires suffer from residual confounding stemming from underreporting of intake 15, and systematic reporting bias related to the tendency for individuals with higher BMIs and higher habitual caloric intake to underreport intake.16–19. In addition, inconsistent results across studies may arise from the categorization of continuous dietary intake data into quartiles, expressing results as “the top versus bottom intake of the group” rather than “per unit intake” making comparisons across studies difficult. To address some of these limitations, we sought to characterize the relationship between maternal dietary intake during pregnancy using repeated 24-hour recalls collected via an automated multi-pass method 20 and direct measures of neonatal body composition in the Healthy Start pre-birth cohort Study. To expand comparability with other human studies, the relationship with neonatal outcomes was explored using two approaches: a partition model to assess the role of energy intake from specific macronutrients, and a nutrient density model to assess the role of macronutrient composition holding energy constant.
Materials and Methods
The Healthy Start Study recruited and enrolled 1410 pregnant women at ≤ 24 weeks gestation from prenatal obstetric clinics at the University of Colorado Hospital in Aurora, Colorado. A detailed description of the Healthy Start study methods has been published elsewhere 21. Briefly, pregnant women ages 16 and older who enrolled in the study were invited to participate in two research visits during their pregnancy, the first between 8 and 24 weeks gestation (median gestational age = 17 weeks) and the second in mid/late pregnancy between 24 and 32 weeks gestation (median gestational age = 27 weeks). A third research visit was conducted in the hospital within 72 hours after delivery (median postnatal age = 1.0 day) when offspring fat mass (FM) and fat free mass (FFM) were assessed using air displacement plethysmography (PEA POD) and anthropometric measures were obtained. All research measurements were obtained by trained research assistants and study nurses. The Healthy Start study protocol was approved by the Colorado Multiple Institutional Review Board and registered as an observational study at clinicaltrials.gov (NCT02273297).
Maternal measurements during pregnancy
At the two research visits during pregnancy, maternal height was measured with a
stadiometer (Accustat, Ross Laboratories, Bardonia, New York) and weight measured with a calibrated scale (Tanita Corporation, Tokyo, Japan). Questionnaires were administered to assess demographic information and physical activity levels. Maternal pre-pregnancy BMI was calculated using maternal height measured at the first research visit and pre-pregnancy weight was obtained from medical records (83.7%) or self-reported at the first research visit (16.2%). Physical activity during pregnancy was measured using the Pregnancy Physical Activity Questionnaire 22 and metabolic equivalent (MET) values were estimated as described in detail in previous publications 23. Prenatal smoking was ascertained through interview-administered questionnaires at each research visit.
A
uthor Man
uscr
ipt
A
uthor Man
uscr
ipt
A
uthor Man
uscr
ipt
A
uthor Man
uscr
Maternal diet during pregnancy
Diet during pregnancy was assessed with repeated 24 hour dietary recalls using the NCI Automated Self-Administered 24-hour Recall (ASA24) utilizing the Multipass Method 20. Participants completed up to 8 recalls (approximately one per month) beginning at their first study with 82% having at least 2 diet recalls. Data from the ASA24 were collected and processed by the Nutrition Obesity Research Center, University of North Carolina (UNC) at Chapel Hill. My Pyramid Food Equivalents (MPFE) and macro- and micronutrient
components for each dietary recall were derived through the ASA24 system using nutrient values provided by the United States Department of Agriculture’s MPFE Database (Versions 1.0 and 2.0) and the Food and Nutrient Database for Dietary Studies (Versions 1.0 and 4.1).
Dietary data
The National Cancer Institute’s (NCI) measurement error model was used to estimate usual dietary intake during pregnancy from the repeated ASA24 hour dietary recalls 24–26. The NCI method is a two-part non-linear mixed effects model from which individual estimates of usual macronutrient intake can be generated using a combination of single and multiple dietary recalls25. The model separates usual intake of a nutrients into two parts: the probability of consumption on a particular day, and given that the food was consumed, the amount eaten on the consumption day. For dietary components consumed on an almost daily basis by nearly everyone, such as the macronutrients in the present analysis, the probability of consumption is close to or equal to 1, thus the “amount only” model was sufficient to predict the usual amount consumed. To increase precision of predicted estimates of usual dietary intake of macro- and micronutrients, covariates known to impact dietary intake were incorporated. Covariates included in the NCI model were chosen a priori and included smoking at any time during pregnancy (yes/no), pre-pregnancy BMI (normal weight, overweight, obese), gravidity and observed mean total daily energy (kcal/day). Non-episodically consumed nutrients including total fat; saturated fatty acid (SFA); monounsaturated fatty acid (MUFA); polyunsaturated fatty acid (PUFA); total
carbohydrates; carbohydrates from sugar including fruit, added sugars and beverages; and protein were estimated using only the first part of the NCI model (amount only model). SAS macro-code from the NCI website was used to implement all nutrition models 27.
Neonatal measures
Offspring’s birth length, weight, head circumference, and skin-fold thickness were measured by trained nurses. Neonatal body composition, fat mass (FM) and fat-free mass (FFM) were calculated from total mass and density using air displacement plethysmography (PEA POD). Body composition was recorded twice for each neonate, with a third measurement taken if the first two percent body fat values were more than two percentage points apart. Values used in this report are the average of the two closest measures. Gestational age at birth was abstracted from medical records. Neonatal chronological age at PEA POD was calculated as the difference in days between the date of birth and the PEA POD research visit.
A
uthor Man
uscr
ipt
A
uthor Man
uscr
ipt
A
uthor Man
uscr
ipt
A
uthor Man
uscr
Statistical analysis
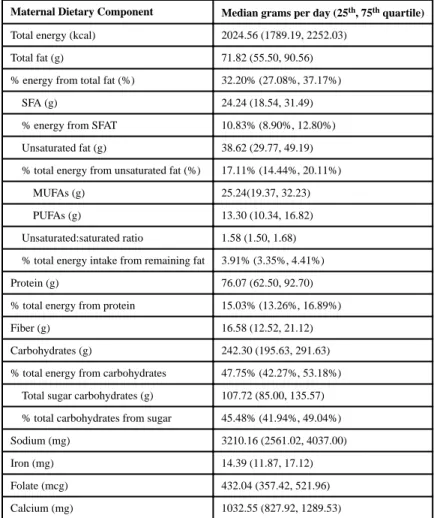
Characteristics of participating mothers and offspring at birth are presented as mean ± standard deviations (SD) or number (n) and percent (%) in Table 1. Maternal usual dietary intake of total energy (kcal), macro- and micronutrients during pregnancy are presented as median grams per day or percentage of total daily caloric intake along with the 25th and 75th percentile.
Two modeling approaches 28 were used to examine the associations between maternal prenatal dietary intake and neonatal body composition outcomes: FM, FFM, and birth weight. The first model was a partition model, which estimates the change in neonatal outcomes associated with a 100 kcal increase in intake of the macronutrient of interest, adjusted for all other macronutrient intake (i.e., total energy intake is not held constant). The second model was a nutrient density model that estimated the change in neonatal outcomes associated with a 1% isocaloric increase in a specific macronutrient, offset by a concomitant drop in other nutrients (total energy is held constant). For both modeling approaches a base model included adjustment for offspring sex, gestational age at birth, and postnatal age at the PEA POD measurement; maternal age, gravidity, race/ethnicity (non-Hispanic, Hispanic, non-Hispanic Black, and other), smoking at any time during the pregnancy (yes/no), and quartiles of metabolic equivalent (MET) values of physical activity levels during pregnancy. Effect modification of the relationship between each macronutrient intake and neonatal outcomes by pre-pregnancy BMI was evaluated and found to be non-significant at the alpha=0.10 level for all macronutrients examined. Thus a second model (model 2) controlled for pre-pregnancy BMI in addition to each of the variables in the base model. Finally, gestational weight gain was not controlled for in the multivariate model under the hypothesis that it is on the causal pathway between dietary intake and infant fat accretion. Estimated coefficients are presented in tabular form with 95% confidence intervals. P values of <0.05 were considered statistically significant, and all analyses were done using SAS software version 9.3 (SAS Institute, Cary, NC).
Results
A total of 1,410 pregnant women were enrolled in the Healthy Start study. Participants were included in the current analysis if they had at least one dietary recall (N=1,366). Women who had been diagnosed with gestational diabetes mellitus (n=53) were excluded, as these women are encouraged to adopt special diets after diagnosis. Neonates born at less than 32 weeks gestation or those without body composition measures at birth were further excluded for a final analytic sample size of 1,040. Comparison of the analytic sample to the larger enrolled cohort revealed no relevant differences in maternal race/ethnicity (p=0.35), maternal age at delivery (p=0.67), pre-pregnancy BMI (p=0.25), or household income (p=0.31). Since infants born before 32 weeks gestation were excluded from the analytical cohort, birth weight in the analytic cohort was higher compared to excluded cases (3,255 versus 3,007 grams, p<0.001).
Maternal and offspring characteristics are displayed in Table 1. Nearly a quarter of the cohort was Hispanic and 15% were non-Hispanic black. A quarter of the cohort had a BMI between 25–29 kg/m2 and 20% had a BMI ≥ 30 kg/m2. The majority was primiparous, 13%
A
uthor Man
uscr
ipt
A
uthor Man
uscr
ipt
A
uthor Man
uscr
ipt
A
uthor Man
uscr
had less than a high school education and 9% reported smoking at some point during pregnancy. The mean gestational age at birth was 39.6 ± 1.10 weeks and the mean birth weight of infants was 3283.18 ± 432.54 grams, within the normal range, though slightly lower than that of the U.S., a common finding in Denver, Colorado, which is at an altitude of 5280 feet 29. PEA POD was performed on infants at mean postnatal age of 1.6 days and the average %FM of infants was 9.1%.
Table 2 shows the median maternal intake of total energy, fat related macronutrients, protein and carbohydrates, as well as the median usual intake of micronutrients (sodium, iron, folate and calcium) during pregnancy in our cohort. Median usual total energy was 2,062 kcals per day with 32.2% energy from fat, 15.0% from protein and 47.8% from carbohydrates. Distributions of median total energy by fat subtypes included 17.6% of from unsaturated fat, 11.1% SFA with remaining fat subtypes comprising 3.8% of total energy intake. Median usual daily intake of total carbohydrates was 252.5 grams (g) per day, of which, 45.4% was from sugar.
Table 3 shows the results of the partition multivariate regression model. In the base model, each 100 kcal increase in maternal intake of total fat was associated with a 3.7 g increase in neonatal FM (p=0.01) and each 100 kcal increase in SFA intake was associated with a 9.7 g increase in FM (p=0.01). There was a marginally statistically significant relationship between total protein intake and FM such that every 100 kcal increase of protein intake was associated with an 11.0 g increase in FM (p=0.052). Additional adjustment for
pre-pregnancy BMI in model 2 somewhat strengthened the relationships for total fat and SFA intake, such that each 100 kcal increase in maternal intake of total fat was associated with a 4.2 g increase in neonatal FM (p=0.03) and each 100 kcal increase in SFA intake was associated with a 11.1 g increase in FM (p=0.003). In addition, after adjustment for pre-pregnancy BMI, significant associations between intake of unsaturated fat and intake of total carbohydrates with neonatal FM were noted such that neonatal FM increased by 5.9 g (p=0.04) and 2.9 g (p=0.02) for every 100 kcal of maternal unsaturated fat and total
carbohydrate, respectively. Individual macronutrient intake during pregnancy in the partition model was not associated with birth weight or FFM.
Table 4 shows the results of the nutrient density multivariate regression model. In the base model, each 1% isocaloric increase in maternal intake of SFA was associated with a 3.6 g increase in neonatal FM (p=0.04) and each 1% isocaloric increase in carbohydrates from sugar was associated with a 2.1 g decrease in FM (p=0.04). Additional adjustment for pre-pregnancy BMI in model 2 attenuated the above relationships to non-significance. Individual macronutrient intake during pregnancy was not associated with birth weight or FFM in the base model or the model adjusted for pre-pregnancy BMI.
Comment
In this contemporary cohort of mother-infant pairs from Colorado we found that,
independent of pre-pregnancy BMI, increased maternal dietary intake of all macronutrients except protein (total fat, SFA, unsaturated fat, and total carbohydrates) was significantly associated with increased neonatal FM. Macronutrient composition during pregnancy
A
uthor Man
uscr
ipt
A
uthor Man
uscr
ipt
A
uthor Man
uscr
ipt
A
uthor Man
uscr
appeared to also impact neonatal fat mass. Specifically, a higher proportional intake of SFA offset by lower intake of other macronutrients, including lower intake of sugar, was associated with increased neonatal fat mass. However, upon adjustment for maternal pre-pregnancy BMI, macronutrient composition was no longer significantly associated with neonatal adiposity, suggesting that maternal obesity is a powerful confounder of this relationship. Finally we did not detect an association between macronutrient-specific energy intake or macronutrient composition during pregnancy and birth weight or neonatal fat-free mass.
Few human observational studies have evaluated the impact of maternal dietary intake during pregnancy on infant body composition and results are inconsistent. Among 179 mother-fetus pairs in Australia, Blumfield, et al. 8 reported an inverse association between maternal intake of protein and % fetal abdominal visceral fat at 19 and 36 weeks gestation while intake of carbohydrates were associated with increased % fetal abdominal visceral fat. They also reported that each isocaloric 1% increase in SFA intake was associated with a decrease in fetal midthigh lean area. In our study, each 1% isocaloric increase in SFA intake was associated with increase neonatal adiposity, however not independent of pre-pregnancy BMI, and we did not detected a relationship between specific macronutrient intake or macronutrient balance on FFM or birth weight. We also did not detect a relationship between protein intake and neonatal FM in either the partition or the nutrient density model. Moore et al. 10 reported a positive relationship between proportion of maternal total energy (kcal) derived from protein in early and late pregnancy and both birth weight and ponderal index among 551 mother-infant pairs in Australia using a nutrient density model adjusted for pre-pregnancy weight. Our finding of a positive relationship between maternal intake of total carbohydrates and offspring FM in a partition model, independent of pre-pregnancy BMI, is consistent with findings by Renault KM et al 12 who reported higher offspring fat mass of 103-g among mothers in the highest quartile of carbohydrate intake compared to the lowest. Murrin et al 11 evaluated the odds of overweight/obesity at 5 years of age among 585 children in Ireland and reported that maternal sugar intake in the top quartile was associated with nearly a 5% increased risk of overweight/obesity in children. Long-term offspring body composition outcomes associated with maternal dietary intake during pregnancy have been reported by Brion et al. 9 who observed no association between maternal macronutrient intake during pregnancy and offspring adiposity or lean mass at 10 years of age among over 5500 mother-infants pairs in the Avon Longitudinal Study of Parents and Children
(ALSPAC). It is likely that inconsistencies in the literature on the relationships between maternal dietary intake in pregnancy and offspring adiposity are due to differences in sample size, timing of assessment of offspring outcomes, as well as methodological limitations related to diet assessment, modelling of nutritional exposures, and appropriate adjustment for confounders.
Evaluation of the impact of in utero nutritional exposures on birth weight alone ignores the potential differential impact on specific body compartments. A review by Sparks et al. 31 hypothesized that fetal fat free mass is primarily influenced by genetic factors, whereas fetal body fat mass is influenced by the maternal metabolic and nutritional environment. Fat mass at birth is estimated to be responsible for, on average, less than 15% of total birth weight but accounts for 46% of the total variation in birth weight 32. Findings from this study and other
A
uthor Man
uscr
ipt
A
uthor Man
uscr
ipt
A
uthor Man
uscr
ipt
A
uthor Man
uscr
Healthy Start reports support the Sparks hypothesis. For example, we previously reported a strong positive linear relationship between maternal insulin resistance and glucose levels during pregnancy and neonatal fat mass, independent of maternal pre-pregnancy BMI, with no relationship detected between maternal fuels and fat free mass 21.
The clinical relevance of our findings are several-fold: first, we show that FM at birth is influenced by a variety of maternal macronutrient intake sources, suggesting total energy intake is a more important contributor than calorie source; second, while the magnitude of effect is small (e.g. a 100kcal increase from SFA is associated with an 11.1 gram or 4% increase in FM at birth), it is independent of maternal pre-pregnant BMI, a major correlate of neonatal adiposity10 and several other risk factors; and third, we provide evidence that the effect of maternal energy intake during pregnancy is specific to neonatal FM, and had no detectable influence of FFM or birth weight. Thus, our data suggest that potential nutritional interventions during pregnancy may result in reductions in neonatal adiposity, without unwanted effects on overall neonatal body size or lean mass.
Mechanisms explaining the relationship between maternal dietary intake during pregnancy and neonatal adiposity are poorly understood. Early metabolic or epigenetic programming events are influenced by nutrient availability and impact adipose tissue development 34, which plays a role in energy regulation, metabolism and insulin sensitivity 35, as well as multiple other developing organs 2. In mouse models, a high fat diet during pregnancy and lactation produced an offspring phenotype significantly more obese, hyperinsulinemic and hyperleptinaemic compared to control offspring, independent of post-weaning diet 2;36. Relative to controls, offspring of lard-fed dams have increased body mass and adiposity with no evidence of hyperphagia 4 prompting a hypothesis that this phenotype is maintained, in part, due to decreased basal metabolic activity 2.
Our study has some limitations and numerous strengths. Given the observational nature of the study, causal inference is limited; however the prospective longitudinal design provides evidence for temporality of events. Dietary intake was obtained from repeated recalls. Previous studies have relied upon food frequency questionnaires (FFQs), usually just one, to estimate dietary intake during pregnancy 8;9;11. FFQs are designed to measure long-term dietary behavior and suffer from several shortcomings including a finite list of foods and a reliance on the individual to retrospectively report their food intake over a long period of time. In contrast, our study utilized repeated recalls with an automated multi-pass method that provides cues to prompt respondents to remember what they consumed in the past 24 hours, which has been shown to reduce bias in the collection of total energy intake 20. Overall, 82.1% of participants completed two or more ASA24 hour dietary recalls. Compared to women who completed one ASA24, women who completed 2 or more were more likely to be non-Hispanic white (p<0.0001), to have a lower pre-pregnancy BMI (p<0.000.1) a higher level of education (p<0.0001) and an older maternal age at delivery (p<0.0001). Limiting our analytic cohort to women with 2 or more ASA24 dietary recalls in a sensitivity analysis led to generally similar results in the both the partition and nutrient density models but less precise estimates due to decreased sample size. Finally,
underreporting of unhealthy foods or beverages is to be expected and may be more pronounced among obese individuals 16,17. Attenuation of the associations observed in the
A
uthor Man
uscr
ipt
A
uthor Man
uscr
ipt
A
uthor Man
uscr
ipt
A
uthor Man
uscr
current study are likely minimal, as we adjusted for pre-pregnancy BMI in our NCI models to increase precision of predicted macronutrient estimates, as well as in the fully adjusted model.
In conclusion, in a large, diverse pre-pregnancy cohort from Colorado we found that increased maternal energy intake from most macronutrients (especially dietary fat, fat subtypes and total carbohydrates), influence fetal fat accretion, but not total body size, independent of pre-pregnancy BMI. Whether increased neonatal adiposity predicts later childhood obesity is still unknown, but our data contributes novel evidence on the potential role of maternal diet during pregnancy on offspring growth and body composition.
Acknowledgments
Sources of Support: NIDDK DK076648, Principal Investigator Dana Dabelea. NIH/NCATS Colorado CTSA
Grant Number UL1TR001082. Funding sources has no role in the conduct or design of research.
We thank all of the women and children who have taken part in the Healthy Start study. We would also like to thank Mrs. Mercedes Martinez, the Healthy Start Study Project Coordinator, Colorado School of Public Health, University of Colorado Denver and the Healthy Start team for their hard work and dedication. Mrs. Martinez is funded on the Healthy Start Grant: NIDDK DK076648, Principal Investigator Dana Dabelea.
Abbreviations
FM fat mass
FFM fat free mass
NCI National Cancer Institute
FPQ food propensity questionnaire
SFA saturated fat
MET metabolic equivalent
ASA24 NCI Automated Self-Administered 24-hour Recall
UNC University of North Carolina
MPFE My Pyramid Food Equivalents
kcal kilocalories
MUFA monounsaturated fatty acid
PUFA polyunsaturated fatty acid
SD standard deviations
n number
g grams
mg milligrams
A
uthor Man
uscr
ipt
A
uthor Man
uscr
ipt
A
uthor Man
uscr
ipt
A
uthor Man
uscr
μg micrograms
ALSPAC Avon Longitudinal Study of Parents and Children
FFQ food frequency questionnaire
Reference List
1. Godfrey K, Robinson S. Maternal nutrition, placental growth and fetal programming. Proc Nutr Soc. 1998; 57(1):105–111. [PubMed: 9571715]
2. Armitage JA, Taylor PD, Poston L. Experimental models of developmental programming: consequences of exposure to an energy rich diet during development. J Physiol. 2005; 565(Pt 1):3– 8. [PubMed: 15695245]
3. Guo F, Jen KL. High-fat feeding during pregnancy and lactation affects offspring metabolism in rats. Physiol Behav. 1995; 57(4):681–686. [PubMed: 7777603]
4. Khan IY, Taylor PD, Dekou V, Seed PT, Lakasing L, Graham D, et al. Gender-linked hypertension in offspring of lard-fed pregnant rats. Hypertension. 2003; 41(1):168–175. [PubMed: 12511548] 5. Khan IY, Dekou V, Douglas G, Jensen R, Hanson MA, Poston L, et al. A high-fat diet during rat
pregnancy or suckling induces cardiovascular dysfunction in adult offspring. Am J Physiol Regul Integr Comp Physiol. 2005; 288(1):R127–R133. [PubMed: 15308487]
6. Taylor PD, McConnell J, Khan IY, Holemans K, Lawrence KM, Asare-Anane H, et al. Impaired glucose homeostasis and mitochondrial abnormalities in offspring of rats fed a fat-rich diet in pregnancy. Am J Physiol Regul Integr Comp Physiol. 2005; 288(1):R134–R139. [PubMed: 15388492]
7. Andreasyan K, Ponsonby AL, Dwyer T, Morley R, Riley M, Dear K, et al. Higher maternal dietary protein intake in late pregnancy is associated with a lower infant ponderal index at birth. Eur J Clin Nutr. 2007; 61(4):498–508. [PubMed: 17136041]
8. Blumfield ML, Hure AJ, MacDonald-Wicks LK, Smith R, Simpson SJ, Giles WB, et al. Dietary balance during pregnancy is associated with fetal adiposity and fat distribution. Am J Clin Nutr. 2012; 96(5):1032–1041. [PubMed: 23034964]
9. Brion MJ, Ness AR, Rogers I, Emmett P, Cribb V, Davey SG, et al. Maternal macronutrient and energy intakes in pregnancy and offspring intake at 10 y: exploring parental comparisons and prenatal effects. Am J Clin Nutr. 2010; 91(3):748–756. [PubMed: 20053880]
10. Moore VM, Davies MJ, Willson KJ, Worsley A, Robinson JS. Dietary composition of pregnant women is related to size of the baby at birth. J Nutr. 2004; 134(7):1820–1826. [PubMed: 15226475]
11. Murrin C, Shrivastava A, Kelleher CC. Maternal macronutrient intake during pregnancy and 5 years postpartum and associations with child weight status aged five. Eur J Clin Nutr. 2013; 67(6): 670–679. [PubMed: 23612514]
12. Renault KM, Carlsen EM, Norgaard K, Nilas L, Pryds O, Secher NJ, et al. Intake of carbohydrates during pregnancy in obese women is associated with fat mass in the newborn offspring. Am J Clin Nutr. 2015; 102(6):1475–1481. [PubMed: 26561621]
13. Prentice RL. Measurement error and results from analytic epidemiology: dietary fat and breast cancer. J Natl Cancer Inst. 1996; 88(23):1738–1747. [PubMed: 8944004]
14. Kipnis V, Freedman LS, Brown CC, Hartman AM, Schatzkin A, Wacholder S. Effect of measurement error on energy-adjustment models in nutritional epidemiology. Am J Epidemiol. 1997; 146(10):842–855. [PubMed: 9384205]
15. Frobisher C, Maxwell SM. The estimation of food portion sizes: a comparison between using descriptions of portion sizes and a photographic food atlas by children and adults. J Hum Nutr Diet. 2003; 16(3):181–188. [PubMed: 12753111]
16. Johnson RK, Soultanakis RP, Matthews DE. Literacy and body fatness are associated with underreporting of energy intake in US low-income women using the multiple-pass 24-hour recall: a doubly labeled water study. J Am Diet Assoc. 1998; 98(10):1136–1140. [PubMed: 9787719]
A
uthor Man
uscr
ipt
A
uthor Man
uscr
ipt
A
uthor Man
uscr
ipt
A
uthor Man
uscr
17. Maurer J, Taren DL, Teixeira PJ, Thomson CA, Lohman TG, Going SB, et al. The psychosocial and behavioral characteristics related to energy misreporting. Nutr Rev. 2006; 64(2 Pt 1):53–66. [PubMed: 16536182]
18. Black AE, Bingham SA, Johansson G, Coward WA. Validation of dietary intakes of protein and energy against 24 hour urinary N and DLW energy expenditure in middle-aged women, retired men and post-obese subjects: comparisons with validation against presumed energy requirements. Eur J Clin Nutr. 1997; 51(6):405–413. [PubMed: 9192200]
19. Schoeller DA. How accurate is self-reported dietary energy intake? Nutr Rev. 1990; 48(10):373– 379. [PubMed: 2082216]
20. Moshfegh AJ, Rhodes DG, Baer DJ, Murayi T, Clemens JC, Rumpler WV, et al. The US Department of Agriculture Automated Multiple-Pass Method reduces bias in the collection of energy intakes. Am J Clin Nutr. 2008; 88(2):324–332. [PubMed: 18689367]
21. Crume TL, Shapiro AL, Brinton JT, Glueck DH, Martinez M, Kohn M, et al. Maternal fuels and metabolic measures during pregnancy and neonatal body composition: the healthy start study. J Clin Endocrinol Metab. 2015; 100(4):1672–1680. [PubMed: 25574704]
22. Chasan-Taber L, Schmidt MD, Roberts DE, Hosmer D, Markenson G, Freedson PS. Development and validation of a Pregnancy Physical Activity Questionnaire. Med Sci Sports Exerc. 2004; 36(10):1750–1760. [PubMed: 15595297]
23. Harrod CS, Chasan-Taber L, Reynolds RM, Fingerlin TE, Glueck DH, Brinton JT, et al. Physical activity in pregnancy and neonatal body composition: the Healthy Start study. Obstet Gynecol. 2014; 124(2 Pt 1):257–264. [PubMed: 25004346]
24. Kipnis V, Midthune D, Buckman DW, Dodd KW, Guenther PM, Krebs-Smith SM, et al. Modeling data with excess zeros and measurement error: application to evaluating relationships between episodically consumed foods and health outcomes. Biometrics. 2009; 65(4):1003–1010. [PubMed: 19302405]
25. Tooze JA, Kipnis V, Buckman DW, Carroll RJ, Freedman LS, Guenther PM, et al. A mixed-effects model approach for estimating the distribution of usual intake of nutrients: the NCI method. Stat Med. 2010; 29(27):2857–2868. [PubMed: 20862656]
26. Tooze JA, Midthune D, Dodd KW, Freedman LS, Krebs-Smith SM, Subar AF, et al. A new statistical method for estimating the usual intake of episodically consumed foods with application to their distribution. J Am Diet Assoc. 2006; 106(10):1575–1587. [PubMed: 17000190]
27. National Cancer Institute, Division of Cancer Control & Population Sciences Epidemiology and Genomic Research Program. [accessed 9 February 2016] Usual Dietary Intakes: SAS Macros for Fitting Multivariate Measurement Error Models & Estimating Multivariate Usual Intake Distributions. 2012. Internet: http://epi.grants.cancer.gov/diet/usualintakes/macros_multiple.html
28. Mackerras D. Energy adjustment: the concepts underlying the debate. J Clin Epidemiol. 1996; 49(9):957–962. [PubMed: 8780602]
29. Jensen GM, Moore LG. The effect of high altitude and other risk factors on birthweight: independent or interactive effects? Am J Public Health. 1997; 87(6):1003–1007. [PubMed: 9224184]
30. Moore VM, Davies MJ, Willson KJ, Worsley A, Robinson JS. Dietary composition of pregnant women is related to size of the baby at birth. J Nutr. 2004; 134(7):1820–1826. [PubMed: 15226475]
31. Sparks JW. Human intrauterine growth and nutrient accretion. Semin Perinatol. 1984; 8(2):74–93. [PubMed: 6374903]
32. Catalano PM, Tyzbir ED, Allen SR, McBean JH, McAuliffe TL. Evaluation of fetal growth by estimation of neonatal body composition. Obstet Gynecol. 1992; 79(1):46–50. [PubMed: 1727584] 33. Starling AP, Brinton JT, Glueck DH, Shapiro AL, Harrod CS, Lynch AM, et al. Associations of
maternal BMI and gestational weight gain with neonatal adiposity in the Healthy Start study. Am J Clin Nutr. 2015; 101(2):302–309. [PubMed: 25646327]
34. Heerwagen MJ, Miller MR, Barbour LA, Friedman JE. Maternal obesity and fetal metabolic programming: a fertile epigenetic soil. Am J Physiol Regul Integr Comp Physiol. 2010; 299(3):R711–R722. [PubMed: 20631295]
A
uthor Man
uscr
ipt
A
uthor Man
uscr
ipt
A
uthor Man
uscr
ipt
A
uthor Man
uscr
35. Meas T. Fetal origins of insulin resistance and the metabolic syndrome: a key role for adipose tissue? Diabetes Metab. 2010; 36(1):11–20. [PubMed: 19815442]
36. Howie GJ, Sloboda DM, Kamal T, Vickers MH. Maternal nutritional history predicts obesity in adult offspring independent of postnatal diet. J Physiol. 2009; 587(Pt 4):905–915. [PubMed: 19103681]
A
uthor Man
uscr
ipt
A
uthor Man
uscr
ipt
A
uthor Man
uscr
ipt
A
uthor Man
uscr
A
uthor Man
uscr
ipt
A
uthor Man
uscr
ipt
A
uthor Man
uscr
ipt
A
uthor Man
uscr
ipt
Table 1
Characteristics of participating mothers and offspring at birth
Maternal characteristics (N=1040) Mean ± SD or N (%)
Age in years (mean) 27.87 ± 6.11
Race/ethnicity
NHW 570 (54.81%) Hispanic 256 (24.62%) NHB 153 (14.71%) Other 61 (5.87%) Pre-pregnancy BMI (kg/m2) 25.53 ± 6.07
Pre-pregnancy BMI status
Underweight 31 (2.98%) Healthy BMI 551 (52.98%) Overweight 258 (24.81%) Obese 200 (19.23%) Maternal level of education < high school 140 (13.46%) Primiparous (N, %) 667 (64.13%) Maternal smoking during pregnancy (any) 90 (8.65%) Maternal GDM – by design these women were excluded
-Offspring characteristics Mean ± SD or N (%) Gestational age (weeks) 39.60 ± 1.10 Sex: Female 511 (49.13%) Birth weight (g) 3283.18 ± 432.54 Birth weight z score −0.41 ± 0.88 Postnatal age at PEAPOD (days) 1.64 ± 2.34 Fat mass (g) 296.48 ± 152.94 Fat mass percent (%) 9.13 ± 3.96 Fat free mass (g) 2852.98 ± 336.47 Waist circumference (cm) 29.57 ± 2.43 Head circumference (cm) 34.26 ± 2.09 Sum of skinfolds (cm) 15.21 ± 3.68
A
uthor Man
uscr
ipt
A
uthor Man
uscr
ipt
A
uthor Man
uscr
ipt
A
uthor Man
uscr
ipt
Table 2
Maternal usual dietary intake during pregnancy
Maternal Dietary Component Median grams per day (25th, 75th quartile)
Total energy (kcal) 2024.56 (1789.19, 2252.03) Total fat (g) 71.82 (55.50, 90.56) % energy from total fat (%) 32.20% (27.08%, 37.17%) SFA (g) 24.24 (18.54, 31.49) % energy from SFAT 10.83% (8.90%, 12.80%) Unsaturated fat (g) 38.62 (29.77, 49.19) % total energy from unsaturated fat (%) 17.11% (14.44%, 20.11%) MUFAs (g) 25.24(19.37, 32.23) PUFAs (g) 13.30 (10.34, 16.82) Unsaturated:saturated ratio 1.58 (1.50, 1.68) % total energy intake from remaining fat 3.91% (3.35%, 4.41%) Protein (g) 76.07 (62.50, 92.70) % total energy from protein 15.03% (13.26%, 16.89%) Fiber (g) 16.58 (12.52, 21.12) Carbohydrates (g) 242.30 (195.63, 291.63) % total energy from carbohydrates 47.75% (42.27%, 53.18%) Total sugar carbohydrates (g) 107.72 (85.00, 135.57) % total carbohydrates from sugar 45.48% (41.94%, 49.04%) Sodium (mg) 3210.16 (2561.02, 4037.00) Iron (mg) 14.39 (11.87, 17.12) Folate (mcg) 432.04 (357.42, 521.96) Calcium (mg) 1032.55 (827.92, 1289.53)
A
uthor Man
uscr
ipt
A
uthor Man
uscr
ipt
A
uthor Man
uscr
ipt
A
uthor Man
uscr
ipt
T ab le 3 Partition model: The estimated change in neonatal body composition parameters associated with a 100 kcal increase in specif
ic macronutrient intak
e
during pre
gnanc
y, adjusted for all other macronutrient intak
e (total ener
gy is not held constant).
Infant body composition parameter
Macr
onutrient (100 calorie incr
ease in dietary intak
e)
Model 1 beta (95% CI)
p-v
alue
Model 2 beta (95% CI)
p-v
alue
F
at mass (g)
T
otal f
at
3.65 (0.78, 6.51)
0.01
4.24 (1.39, 7.09)
0.003
SF
A
9.67 (2.28, 17.06)
0.01
11.14 (3.80, 18.48)
0.003
Unsaturated f
at
5.60 (−1.19, 11.49)
0.06
5.93 (0.16, 11.72)
0.04
MUF
A
9.71 (−1.06, 20.48)
0.08
9.01 (−1.64, 19.68)
0.1
PUF
A
12.20 (−7.42, 31.81)
0.2
12.28 (−7.12, 31.69)
0.2
T
otal CHO
2.00 (−0.46, 4.47)
0.1
2.93 (0.46, 5.40)
0.02
T
otal CHO from sug
ar
−2.33 (−7.93, 3.28)
0.4
−0.75 (−6.33, 4.84)
0.8
T
otal Protein
11.01 (−0.10, 22.12)
0.052
10.22 (−0.80, 21.22)
0.07
F
at Free Mass (g)
T
otal f
at
0.25 (−5.61, 6.12)
0.9
1.00 (−4.86, 6.87)
0.7
SF
A
1.74 (−13.38, 16.86)
0.8
3.62 (−11.50, 18.73)
0.6
Unsaturated f
at
−1.81 (−13.74, 10.13)
0.8
−1.45 (−13.34, 10.45)
0.8
MUF
A
−2.79 (−24.81, 19.23)
0.9
−3.67 (−25.62, 18.27)
0.7
PUF
A
−9.67 (−49.77, 30.39)
0.6
−9.58 (−49.51, 30.35)
0.6
T
otal CHO
−0.08 (−5.11, 4.95)
1.0
1.07 (−4.01, 6.14)
0.7
T
otal CHO from sug
ar −2.80(−14.27, 6.88) 0.6 −0.82(−12.32, 10.69) 0.9 T otal Protein
1.73 (−21.00, 24.46)
0.9
0.72 (−21.94, 23.38)
1.0 Birth W eight (g) T otal f at
4.36 (−3.24, 11.95)
0.3
4.36 (−3.29, 11.95)
0.3
SF
A
12.51 (−7.06, 23.07)
0.2
12.51 (−7.06, 32.07)
0.8
Unsaturated f
at
2.16 (−13.25, 17.56)
0.8
2.16 (−13.25, 17.56)
0.8
MUF
A
2.17 (−26.25, 30.59)
0.9
2.17 (−26.25, 30.59)
0.8
PUF
A
−5.72 (−57.23, 46.19)
0.8
−5.52 (−57.30, 46.19)
0.8
T
otal CHO
2.74 (−3.82, 9.31)
0.4
2.75 (−3.82, 9.31)
0.4
T
otal CHO from sug
ar
−4.51 (−19.40, 10.37)
0.6
−4.51 (−19.40, 10.38)
0.5
T
otal Protein
11.27 (−18.06, 40.61)
0.5
11.27 (−18.06, 40.61)
0.5
Conf
idence interv
al=CI; gram=g; Saturated f
at=SF
A; monounsaturated f
at=MUF
A; polyunsaturated f
at=PUF
A, carboh
ydrate=CHO; kilocalorie=kcal
* beta represents the unit increase in inf
ant body composition parameter associated with a 100 kcal increase in specif
ic macronutrient intak
e during pre
gnanc
y, adjusted for all other macronutrient intak
A
uthor Man
uscr
ipt
A
uthor Man
uscr
ipt
A
uthor Man
uscr
ipt
A
uthor Man
uscr
ipt
Model 1 adjust for inf
ant se
x, gestational age at birth, and postnatal age at the PEAPOD measurement, maternal age, gra
vidity
, race/ethnicity
, smoking at an
y time during pre
gnanc
y, and ph
ysical acti
vity
le
v
els during pre
gnanc
y.
Model 2 adjusts for all co
v
ariates in model 1 and pre-pre
gnanc
A
uthor Man
uscr
ipt
A
uthor Man
uscr
ipt
A
uthor Man
uscr
ipt
A
uthor Man
uscr
ipt
T ab le 4Nutrient density model: The estimated change in neonatal body composition parameters associated with a 1% isocaloric increase in specif
ic macronutrient
intak
e during pre
gnanc
y of
fset by a concomitant drop in other nutrients (total ener
gy is held constant).
Infant body composition parameter
Macr
onutrient (1% isocaloric incr
ease)
Model 1 beta (95% CI)
p-v
alue
Model 2 beta (95% CI)
p-v
alue
F
at mass (g)
T
otal f
at
1.18 (−0.19, 2.56)
0.09
0.96 (−0.40, 2.33)
0.2
SF
A
3.57 (0.08, 7.06)
0.045
2.95 (−0.52, 6.42)
0.1
Unsaturated f
at
1.42 (−0.84, 3.69)
0.2
1.18 (−1.07, 3.42)
0.3
MUF
A
2.48 (−1.05, 6.01)
0.2
1.94 (−1.56, 5.44)
0.3
PUF
A
2.80 (−3.18, 8.77)
0.4
2.62 (−3.29, 8.54)
0.4
T
otal CHO
−0.25 (−1.44, 0.94)
0.7
−0.16 (−1.33, 1.02)
0.8
T
otal CHO from Sug
ar
−2.13 (−4.19, −0.07)
0.04
−1.77 (−3.82, 0.28)
0.09
T
otal protein
2.80 (−0.60, 6.20)
0.1
2.22 (−1.15, 5.59)
0.2
F
at Free Mass (g)
T
otal f
at
0.62 (−2.20, 3.44)
0.7
0.34 (−2.48, 3.16)
0.8
SF
A
3.19 (−3.95, 10.33)
0.4
2.42 (−4.72, 9.56)
0.5
Unsaturated f
at
−0.02(−4.66, 4.61)
1.0
−0.33 (−4.96, 4.29)
0.9
MUF
A
0.32(−6.90, 7.54)
0.9
−0.36 (−7.57, 6.85)
0.9
PUF
A
−1.07 (−13.28, 11.14)
0.9
−1.28 (−13.46, 10.88)
0.8
T
otal CHO
0.10(−2.33, 2.53)
0.9
0.22 (−2.20, 2.65)
0.9
T
otal CHO from Sug
ar
−0.45(−4.67, 3.77)
0.8
0.01 (−4.20, 4.23)
1.0
T
otal Protein
1.19 (−5.04, 8.87)
0.6
1.19 (−5.76, 8.13)
0.7 Birth W eight (g) T otal f at
2.12 (−1.54, 5.80)
0.3
1.57 (−2.08, 5.21)
0.4
SF
A
7.58 (−1.71, 16.88)
0.1
6.03 (−3.21, 15.27)
0.2
Unsaturated f
at
1.40 (−4.64, 7.43)
0.6
0.77 (−5.22, 6.76)
0.8
MUF
A
3.05 (−6.35, 12.44)
0.5
1.68 (−7.65, 11.01
0.7
PUF
A
0.98 (−14.92, 16.89)
0.9
0.54 (−15.21, 16.30)
0.9
T
otal CHO
−0.61 (−3.78, 2.56)
0.7
−0.37 (−3.50, 2.77)
0.8
T
otal CHO from sug
ar
−3.24 (−8.73, 2.25)
0.2
−2.32 (−7.78, 3.14)
0.4
T
otal Protein
5.86 (−3.19, 14.91)
0.2
4.40 (−4.59, 13.39)
0.3
Conf
idence interv
al=CI; gram=g; Saturated f
at=SF
A; monounsaturated f
at=MUF
A; polyunsaturated f
at=PUF
A, carboh
A
uthor Man
uscr
ipt
A
uthor Man
uscr
ipt
A
uthor Man
uscr
ipt
A
uthor Man
uscr
ipt
* beta represents the unit increase in inf
ant body composition parameter associated with a 1% isocaloric increase in maternal macronutrient intak
e during pre
gnanc
y of
fset by a concomitant drop in other
nutrients Model 1 adjust for inf
ant se
x, gestational age at birth, and postnatal age at the PEAPOD measurement, maternal age, gra
vidity
, race/ethnicity
, smoking at an
y time during pre
gnanc
y, and ph
ysical acti
vity
le
v
els during pre
gnanc
y.
Model 2 adjusts for all co
v
ariates in model 1 and pre-pre
gnanc

![A Review: A. Jaime, “Política global y sociedad civil en las Américas: Nuevas diplomacias en Argentina y México” [Global Politics and Civil Society in the Americas: New Diplomacies in Argentina and Mexico] (Madrid: Catarata, 2017)](data:image/gif;base64,R0lGODlhAQABAIAAAP///wAAACH5BAEAAAAALAAAAAABAAEAAAICRAEAOw==)