PHARMACEUTICAL RESEARCH AND DEVELOPMENT: A KEY INFORMANT ASSESSMENT OF WHETHER AN “OPEN-SCIENCE” MODEL COULD IMPROVE
CLINICAL RESEARCH IN TERMS OF QUALITY AND EFFICIENCY
Timothy D. N. King, MSPH
A dissertation submitted to the faculty of the University of North Carolina at Chapel Hill in partial fulfillment of the requirements for the degree of Doctor of Public Health in the Department of Health Policy and Management in the Gillings School of Global Public Health.
Chapel Hill 2013
Approved by:
iii
ABSTRACT
TIMOTHY KING: Pharmaceutical Research and Development: A Key Informant Assessment of Whether an “Open-Science” Model Could Improve Clinical Research
in Terms of Quality and Efficiency (Under the direction of John E. Paul)
The average cost to develop each new pharmaceutical drug is approximately $1 billion or more and takes 12-15 years from laboratory concept to an approved drug on the shelf at the local pharmacy. There is concern that the high cost and extended timelines required for pharmaceutical research and development (R&D) is not sustainable in the long term, as pharmaceutical companies question the value of investing $1 billion against an uncertain future revenue stream. The high cost of R&D contributes to the high cost of pharmacotherapies to consumers, where one recent estimate projects that annual global spending on pharmaceuticals will exceed $1.2 trillion by 2016.
iv
One concept proposed to improve R&D efficiency and quality is to make the process more transparent and collaborative where researchers, even those from competing pharmaceutical companies, could more freely share information on their research designs, processes and outcomes. This concept, “open-science” R&D (OSRD), differs from traditional R&D approaches that typically are more secretive and less collaborative.
To explore whether OSRD could be a viable and beneficial alternative to current pharmaceutical R&D practices, key informants from academia, industry, and regulatory agencies were interviewed using a qualitative, semi-structured
questionnaire. While the key informants were concerned that for-profit
v
vi
ACKNOWLEDGMENTS
This research would not have been possible without guidance from my
Dissertation Committee that includes Margaret Dardess, Don Holzworth, Chris Shea, John Vernon, Bryan Weiner, and Chair John Paul.
Transcription and coding support was provided by Abby King, Misti Rusk, and Kimberly Wheaton, and manuscript editing by Colonel James Jinnette and Mary Leornardi.
Bill Andrews, Dennis Gillings, Pat King, Robert Millikan, Katherine Rowan, and David Sokal, who provided inspiration to seek solutions to the world’s biggest challenges; maius opus moveo.
Financial support for my doctoral studies was provided by generous grants from Chimerix and PRA International.
General support and encouragement of my friends and colleagues in Cohort Six of the DrPH program. It was my honor to begin and end this journey with you all.
And finally, the key informants who participated in the interviews, freely sharing their time and expertise.
To these people named and many more unnamed, my humble gratitude.
vii
PREFACE
The last 60 years of innovations in clinical research have not made the enterprise more efficient – actually the opposite. Analysis shows that while the number of drugs approved annually fluctuates to some degree, overall approvals have remained static while the financial resources required for research and development (R&D) have soared at a rate well beyond inflation.1
In 2008, I was a Group Director at Quintiles, a large contract research organization (CRO), which provides financial, research, and sales support to the pharmaceutical industry. Founder and then CEO Dennis Gillings stated in internal communications that the cost of pharma R&D was unsustainable and that Quintiles needed to find ways to “conduct three clinical trials for the cost of two” (personal communication). Put another way, the industry needed to reduce the cost of R&D by 33%. He referred to Quintiles’ corporate goal to reduce pharma R&D costs as the “3 for 2” initiative, and charged me and my colleagues to propose innovations to the current pharma R&D process to improve efficiency (reduce time and costs) while maintaining if not improving process quality. This corporate goal did not necessarily refer to improving quality in terms of the safety and efficacy of approved drugs, but to improve the quality of the R&D process.
Many initiatives were proposed including Six-Sigma2 reviews of and
viii
and information systems. However, I viewed these innovations, although helpful, as incremental and unlikely to have a substantial impact on R&D process quality and efficiency. I theorized that the lack of transparency and collaboration in drug development may be doing more harm than good to the pharma business. While secrecy is intended to protect proprietary information and business interests, it may make the R&D process so inefficient that the net result could be an overall negative impact on profitability and sustainability, not only to the bottom line for Quintiles but to the entire drug development industry. I therefore proposed that Quintiles explore ways to promote transparency and collaboration among our pharma customers as a means to improve R&D, and I have come to refer to this approach as open-science R&D (OSRD).
Moreover, to someone trained in population health, I felt that improving efficiency in pharma R&D could have a positive impact on global health by reducing the high cost of pharmacotherapies. Whether the inefficient processes in R&D can be significantly improved by OSRD is an issue much larger than the internal
business processes of one CRO or pharma company, and therefore this research explores the viability of OSRD across the entire pharma industry.
ix
TABLE OF CONTENTS
TABLE OF CONTENTS ... ix
LIST OF TABLES ... xii
LIST OF FIGURES ... xiv
LIST OF ABBREVIATIONS ... xv
Chapter 1: Introduction ... 1
Problem Statement ... 1
Proposals to Reduce Pharmaceutical Costs ... 2
Current Drug Discovery and Development Process... 4
Transparency and Collaboration in Drug Development ... 7
Chapter 2: Review of the Literature ... 11
Literature Review Methods ... 11
Topic 1: Cost of Pharmaceutical R&D... 13
Topic 2: R&D Costs and the Overall Cost of Marketed Pharmaceuticals to Consumers ... 23
Topic 3: What is Open-Source Pharmaceutical R&D? ... 26
Chapter 3: Conceptual Model and Research Questions ... 32
Drug Development: Conceptual Model ... 32
Proposed Open-Science Research and Development Paradigm ... 33
Research Questions ... 37
Chapter 4: Methods ... 39
x
IRB Review ... 42
Confidentiality Issues ... 43
Data Collection Procedures ... 43
Data Management and Analysis Plan ... 44
Chapter 5. Results ... 45
Characteristics of Interviews and Key Informants ... 45
Key Topics and Findings ... 49
I. Impressions on the Current State of Pharma R&D ... 49
II. Advantages and Disadvantages of OSRD for R&D Quality ... 52
III. Advantages and Disadvantages of OSRD for R&D Efficiency ... 55
IV. Other Potential Impacts of OSRD ... 58
V. Potential Innovations other than OSRD ... 61
VI. Barriers to Implementing OSRD ... 63
VII. Opportunities for Implementing OSRD ... 66
Summary of Results ... 72
Chapter 6. Plan for Change ... 74
Chapter 7: Discussion and Limitations ... 88
Appendix 1: Introductory Letter for Potential Key Informants ... 94
Appendix 2: Hypothetical Model for Open-Science in Pharmaceutical Research and Development ... 96
Appendix 3: Informed Consent Form (for Verbal Consent) ... 98
Appendix 4: Key Informant Interview Guide ... 101
Appendix 5: Key Informant Semi-structured Interview ... 103
Appendix 6: IRB Review ... 108
xi
Appendix 8: Results. Additional Key Informant Comments on the Efficiency of Current Pharma R&D Process, in Terms
of Time and Costs ... 112 Appendix 9: Results. Additional Key Informant Comments on the
Effect of OSRD on the Quality of R&D ... 115 Appendix 10: Results. Additional key Informant Comments on the
xii
LIST OF TABLES
Table 1: Table of pharmaceutical development costs, with
reference to data source and year, in $ millions ... 18 Table 2. Clinical costs estimates by therapeutic category, in
$ millions, adjusted for inflation for year 2000 ... 20 Table 3. Itemized costs contributing to the overall cost or a
prescription from a retail pharmacy, based on
NCADS estimates in Figure 2 ... 25 Table 4: Large pharmaceutical companies participating in
the DNDi or TransCelerate as of 10 February 2012 ... 31 Table 5: Information typically patented and/or kept
proprietary under the current pharmaceutical R&D
paradigm ... 35 Table 6. Key informant backgrounds (stakeholder group,
years of experience, highest degree obtained) and interview characteristics (interview time, format,
and whether recorded) ... 46 Table 7. Aggregated data on key informants and interviews ... 47 Table 8. Potential effect of OSRD in terms of R&D quality
(positive, negative, or neutral); Aggregated for all
participants ... 53 Table 9. Potential effect of OSRD in terms of R&D quality
(positive, negative, or neutral); by stakeholder
group ... 53 Table 10. Potential effect of OSRD in terms of R&D
efficiency (positive, negative, or neutral);
Aggregated for all participants ... 55 Table 11. Potential effect of OSRD in terms of R&D
efficiency (positive, negative, or neutral); by
xiii
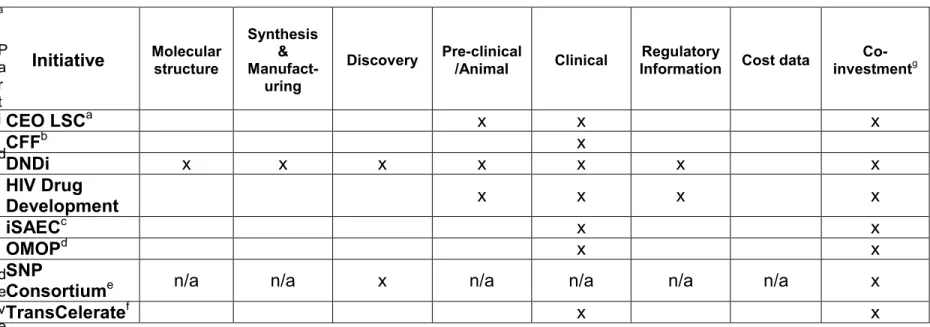
Table 12: OSRD-like initiatives already occurring in pharma
R&D ... 70 Table 13: How ongoing OSRD-like initiatives compare with
proposed OSRD model ... 71 Table 14: Kotter’s eight steps to promote transformational
xiv
LIST OF FIGURES
Figure 1. Drug discovery and development pathway ... 6 Figure 2: Average revenue from each prescription required to
cover the costs of R&D, manufacturing, distribution,
xv
LIST OF ABBREVIATIONS
510-K For FDA approval for new Medical Devices that are substantially equivalent to existing, approved devices ACA Affordable Care Act
ADME Absorption, Distribution, Metabolism, and Excretion AE Adverse Event (in a clinical trial, a “side effect”) CDC Centers for Disease Control and Prevention CEO/CMO Chief Executive/Chief Medical Officer
CER Comparative Effectiveness Research CMC Chemistry, Manufacturing, and Control CRO Contract Research Organization
CITI Collaborative Institutional Training Initiative CTTI Clinical Trials Transformation Initiative DNDi Drugs for Neglected Diseases Initiative EMA European Medicines Agency
FDA United States Food and Drug Administration FOI Freedom of Information Act
IDE Investigational Device Exemption (for FDA approval to begin human testing for candidate medical devices)
IND Investigational New Drug (for FDA approval to begin human testing for candidate pharmacotherapies) IP Intellectual Property, such as the molecule that Is patented IRB Institutional Review Board
iSAEC International Serious Adverse Event Consortium
xvi
NACDS National Association of Chain Drug Stores NDA New Drug Application (for FDA approval of new
pharmacotherapies)
NIH National Institutes of Health NTD Neglected Tropical Diseases
OSRD Open-Science Research and Development pharma The pharmaceutical industry and/or company
PhRMA Pharmaceutical Research and Manufacturers of America PHS Public Health Service
PK/PD Pharmacokinetics/Pharmacodynamics
PMA Pre-Market Authorization (for FDA approval for new Medical Devices) POC Proof of Concept, usually a Phase II clinical trial
R&D Research and Development RCT Randomized Clinical Trial ROI Return on Investment
SAE Serious Adverse Event
SG&A Selling, General, and Administrative Expenses
Chapter 1: Introduction
Problem Statement
The high cost of pharmaceuticals reduces patient access to needed therapies and places an enormous burden on healthcare worldwide, and therefore is a global population health issue.3
Data suggest that per each new approved drug, pharmaceutical companies (pharma) must invest on average $1 billion or more over 12-15 years to proceed from laboratory concept to an approved drug on the shelf at the local pharmacy.4,5 Another analysis of costs for each new drug approved from 1997 – 2012 among the ten largest pharma companies estimated the costs at approximately $4 – 12 billion.6 Totaled across all drugs in development, the Pharmaceutical Research and
Manufacturers of America (PhRMA), an industry-sponsored association, reports that 2010 R&D investments approached $67 billion.7 There is consensus that this
business model is not sustainable in the long term,1 as investors question the value
of investing $1 billion or more per approved drug when measured against a highly uncertain return on investment (ROI).
2
services.8 Recent reports estimate that the global expenditure for pharmaceuticals will exceed $1 trillion by 20149 and $1.2 trillion by 2016.10
Therefore, in theory, significant reductions in pharma R&D investments would result in lower costs to pharma per approved drug. Pharma companies could then reduce the amount they charge consumers without eroding profit margins. In other words, if pharma needed to invest less for R&D, they could charge less per
prescription to recover their R&D expenditures while maintaining current profit margins. Most importantly, if potential savings were passed on to consumers so that pharmacotherapies are less expensive, this could result in greater access to needed therapies for all people.
Proposals to Reduce Pharmaceutical Costs
As a result, many efforts are proposed or underway to decrease or at least reduce the rate of increase in pharmaceutical costs. Initiatives or market forces that may have a substantial impact on the costs of drugs include: 9
“Patent Cliff”: Many of the highest revenue generating pharmacotherapies are facing patent expiry by 2015, leading to increased production and demand for much less expensive generic drug options for over ten of the most profitable prescriptions.11 Note that generics tend to cost one-third of their brand name equivalents.12
3
already approved biologic drugs, akin to generic drugs for small-molecule pharmaceuticals.13
Comparative Effectiveness Research (CER): Through CER data are analyzed to determine the most effective therapies for the cost. These data can then be used to guide patient, physician, and payer decision making.
Payer Reform: Both public (Medicare/Medicaid in the US) and private insurance payers are organizing and exerting more pressure on
pharmacotherapy pricing in terms of which approved drugs payers are willing to purchase, for which patients, and at what price.
Improving Pharmaceutical R&D: The endeavor to make research better at determining the safety and effectiveness of potential therapies, while also more efficient and less expensive to conduct.
On this last point, one possibility for improving pharma R&D in terms of quality and efficiency is creating more transparent and collaborative process. This concept is sometimes referred to as “Open-Science”, “Open-Source”, “Open Innovation”, or “Crowd-Sourcing”14,15 in drug discovery and development. For the remainder of this paper, the term open-science R&D (OSRD) is used to represent the broader concept of transparency and collaboration in pharma R&D which is the focus of this research.
4
R&D arguably would have similar benefits for other medical R&D efforts including medical devices and diagnostics.
Current Drug Discovery and Development Process
The first step assessing whether an OSRD approach could be beneficial in terms of R&D process quality and efficiency is to review the current drug discovery and development process. Most drugs are developed by private, for-profit
pharmaceutical companies, although academic and/or government funded researchers also can have significant roles in the basic science and drug
development process. Private in this case means not primarily supported by public (government) funding, but the companies may be either publically traded or privately held. These private businesses seek patents so that they own the drugs they are developing, and these patents can be on: 1) the molecular structure, 2) drug synthesis and manufacturing techniques, and, 3) “use” patents referring to the diseases or conditions the molecule is intended to treat. The patents are considered the intellectual property (IP) of each pharmaceutical company, which carefully
protects its IP and works to keep it proprietary. In addition to protecting patented information, pharma companies tend to protect trade secrets – information that is not patentable but that pharma companies assume they should keep secret to protect their business interests. Examples of trade secrets include study protocols, data and results, and correspondence with regulatory agencies.
5
to create and identify unique molecules that have certain properties that should, in theory, have a beneficial medicinal effect, without having properties known or suspected to cause an adverse event (AE), or negative side effect. When such compounds are identified, the discoverer may then seek to obtain patents as described above. If patents are granted, then the patent holder may proceed to the drug development stage and seek regulatory approval to sell the drug.
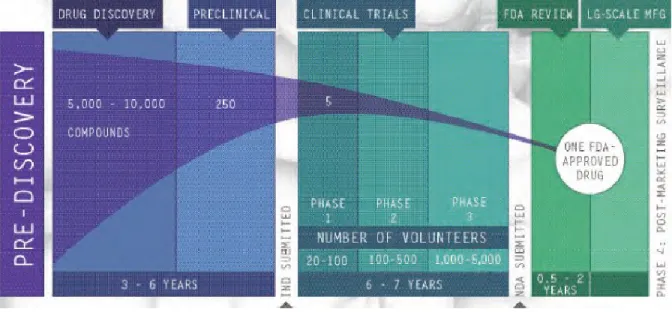
Drug development progresses through several stages (Figure 1), beginning with discovery and pre-clinical research that includes laboratory and animal testing for safety and also efficacy if possible. If the pre-clinical data are positive and
6
Figure 1. Drug discovery and development pathway
PhRMA, 2007.16
Traditional phases in clinical development include:
Phase I: Several studies to demonstrate “proof of concept”, begin
establishing drug pharmacokinetics (PK) and pharmacodynamics (PD), and monitor for significant risk of adverse events that would preclude future research. Phase I research involves relatively few patients or healthy
volunteers, often less than 20-30 per study, and usually includes no inferential statistical testing.
7
Phase III: These are the largest studies to determine safety and efficacy with statistical significance. Phase III research often requires two large,
well-controlled, randomized trials (RCT) for market approval, can involve hundreds if not thousands of patients, and cost tens if not hundreds of millions of dollars to conduct.
Phase IV: Phase IV studies are also called post-marketing research and are conducted after the drug has been approved. Sometimes required by
regulators after granting a contingent approval, Phase IV research often seeks to clarify the safety and efficacy of the approved drug in “real world” settings, meaning where patient selection and drug compliance is not tightly controlled as in the RCT(s) required in pre-approval research.
Patents for pharmaceuticals typically are granted for 20 years,17 and assuming it requires on average 12-15 years and $1 billion to test the compound and receive regulatory approval, then a pharma company perhaps has only five years to recoup the bulk of the R&D investment, much less make a profit, some of which may then then spent on R&D for new drug candidates.
Transparency and Collaboration in Drug Development
8
support the business goal of gaining drug approval and support marketing, largely remain hidden from public scrutiny.
The Collaborative Institutional Training Initiative (CITI) is an independent group created to train investigators on ethical conduct in clinical research. The CITI training is required for many scientists involved in research funded by either the Public Health Service (PHS) or the National Institutes of Health (NIH), as well as some industry-funded research regulated by the FDA. To CITI, the lack of
transparency in research has a negative impact on the advancement of science and therefore on patients:
“[Pharma companies] may seek to restrict publication, citing protection of proprietary information, in order to avoid advancing the work of competitors. They may conceal negative study findings by maintaining control of
publication, or avoid disclosing adverse events and side effects to the public (though these are disclosed to the FDA). Restricted or partial publication increases the cost of clinical progress and can jeopardize the health of future study subjects and future patients. It also impedes or disrupts the work of other scientists whose work would otherwise improve, build on or impeach prior investigations.”18
Expanding on the concerns expressed by CITI, the lack of communication, collaboration and transparency in the current paradigm of pharma R&D may contribute to a variety of problems including:
9
between drug developers, the broader community of researchers do not benefit from the knowledge of others.
2. Redundant research: Different pharma companies that are developing
similar drugs do not share results, particularly negative results which is akin to the issue of negative publication bias,19 and this can propel drug candidates much further down the development pathway before failing than they might have gone otherwise. Redundant and unnecessary clinical studies drive up the costs of failed drug candidates, which must then be recovered in the pricing of approved drugs.
3. Trust: A Harris Interactive poll of approximately 1700 people in the US in 2006 found that more than 85 percent of American adults believe that the FDA and pharma companies have at least “a fair amount” of responsibility for “ensuring drug safety”.20 However, only a fraction of those polled believed that the FDA (45 percent) or pharma companies (27 percent) could be trusted with drug safety. Moreover, only 14 percent of participants were “very confident” that pharma companies would eventually release data on drug safety, regardless of whether the data were positive or negative. This situation has led researchers to propose that greater transparency in pharma R&D could restore trust in the pharma industry and the therapies it produces.21
10
marketing than might otherwise be required to simply advertise drugs to providers and patients. Using data from 2004, Gagnon and Lexchin estimate that pharma companies each year spend twice as much on advertising and marketing as R&D, even when including additional public funding for R&D such as from the National Institutes of Health (NIH) and the Centers for Disease Control and Prevention (CDC).22 The high cost of R&D, and even higher cost of advertising and marketing, is ultimately costs passed on to consumers. High drug costs limit access to
Chapter 2: Review of the Literature
The literature review for this research included three components, namely:
1. Topic 1: The costs of pharma R&D under the current business model, to assess widely quoted estimates of $1 billion or more per each new approved drug;
2. Topic 2: The relative cost of pharma R&D when compared with total cost of a prescription to the consumer; and
3. Topic 3: The concept of open-source, crowd-sourcing, open-innovation, or open-science in pharma R&D.
Literature Review Methods
Search StrategyInitially, a search was done of PubMed and Web of Knowledge for peer-reviewed articles published in English from 1980 to present using the following keywords:
pharmaceutical and drug development pharmaceutical and drug research
12
open-source, open-science, and crowd-sourcing.
These keywords were also used for a “grey” literature search of Google and Google Scholar to find reports, non-peer reviewed articles, presentations, editorials, and opinion pieces. Finally, the reference lists of potentially relevant articles were also reviewed to identify additional articles.
Abstracts or summaries (when available) of potential articles were reviewed and included if they:
1) contained directly collected or imputed data on pharmaceutical development costs;
2) were in English; and
3) were published from 1980 to 2011, although some included data prior to 1980.
Articles were excluded if they simply repeated data or analysis from other identified articles or were commentaries on pharmaceutical development costs, but presented no original data or analyses.
It should be noted that a large portion of the information summarized here was gathered from “grey” literature, meaning newspaper, magazine, and web-based articles and editorials. This heavy weighting on the grey literature is due to two main factors:
13
concerning information on the cost of R&D. Therefore, there are little data, particularly in peer-reviewed journals, that address the first two questions described above.
2) For search #3 above, the concept of open-source in computer development only began gaining momentum in the 1990s,42 and the theoretical or practical application of these concepts to pharma R&D is less than ten years old. Therefore, little has been published on the subject in any format, professional journals or grey literature.
Topic 1: Cost of Pharmaceutical R&D
Before it can be determined whether an OSRD approach could reduce pharmaceutical R&D costs, the first task it to understand of the cost of developing drugs under the current business model. Costs and timelines frequently referenced in editorials indicate that the average drug takes 12-15 years and costs $1 billion or more to progress from the research laboratory to an approved drug.
Searches were conducted in PubMed, Web of Knowledge, and Google Scholar, generating the following number of potential references:
PubMed = 1 272
14
The original number of potential references from Web of Knowledge and Google Scholar were too large to review completely. A cursory review showed that the initially proposed search terms were capturing many different types of medical therapy costs outside the cost of developing new therapies, including the price of drugs for hospital formularies, Medicare reimbursements, etc. Therefore, for Web of Knowledge the search terms were modified to attempt to make them more selective: “pharmaceutical research and development costs”. This modification reduced the potential references from Web of Knowledge to 753, which then were filtered on “articles” to remove reviews (183) and editorials (28). Ultimately, the search resulted in 439 potential articles, which were reviewed for relevance by title.
For Google Scholar, the search term was revised to match Web of
Knowledge, and the first 500 reference titles were then reviewed. This is admittedly an incomplete process, relying on Google’s proprietary and unknown algorithm to prioritize articles starting with the “closest” matches as determined by Google. However, the Google search did not reveal articles that were not already identified via Web of Knowledge, and therefore the risk of overlooking potential studies on R&D costs is small.
15
In addition to these 13 articles, two additional references were identified and included in this literature review (Nunn 200624 and Gilbert 200325). If either reference were originally found by Morganet al., they presumably were intentionally excluded. First, Nunn24 provided estimates for imaging agents, outside the scope of the
Morgan et al. systematic review of pharmacotherapies. Gilbert et al.25 was a private report from a consulting company and the data sources and methods were not revealed, which may have made it incompatible with criteria for inclusion in the Morgan et al. review.
In addition to these articles reporting cost estimates for pharmaceutical R&D, a number of editorials were noted, many stating concerns about the methodology and conclusions reported by the referenced articles. The main points of the editorials are summarized later in this literature review.
In the 15 articles included in this review, four different methodologies were used to estimate the cost to develop a drug. Morgan et al. described them as follows:
Method 1: Retrospective cost accounting with project-level data;
Method 2: Retrospective econometric analysis with industry- or firm-level data;
Method 3: Retrospective cost accounting with industry-level data; or
16
Method 124,26,27,28,29,30,31,32,33 attempted to retrospectively gather data on the cost of each task billed to the development of a drug, such as the cost to conduct each study (IRB fees, investigator physician fees, etc.), and the cost to produce the drug and placebo needed for the various studies. By far the vast majority of studies cited used this methodology, and most analyses for Method 1 were conducted by the same core group of researchers27,28,29,30,31,32 or by others explicitly seeking to replicate their methods.24, 33
Method 234,35 differs in that the technique is to a) estimate R&D costs, b) create a model showing how many drugs are being developed at what stage (pre-clinical/non-human research, clinical, presumably including Phase I, II and III, etc.), and then c) use the model to estimate the incremental cost to develop an additional drug.
Method 336 attempted to account for total costs over a specified period, but collected at the industry-wide level, meaning the costs for developing all drugs over five years (numerator). These industry-wide costs were then divided by estimates for the number of drugs developed during that same period (denominator), resulting in an estimate of the average cost of developing each drug in that period.
Finally, Method 437 is similar to Method 1, except that the data were collected prospectively, using projected estimates of costs for each major task in the
17
Gilbert et al.25 did not describe their methods or original source data but are included here for completeness.
A common feature of the four methods is that most researchers attempted to account for the cost of drugs that failed to reach the market, meaning that the costs to develop drugs that failed to be approved must be covered by the drugs that succeed. It is important to note that, regardless of method, most studies relied on confidential data supplied by industry, therefore making it impossible for any
researcher to independently verify the ultimate source of the original data much less its accuracy.
18
Table 1: Table of pharmaceutical development costs, with reference to data source and year, in $ millions
Development Phase Cost in $ millions (Year)
Discovery $600 (2003)25 $674 (2010)33
Pre-Clinical $80 (2003)25
$89 (1963-75)b
$150 (2010)33 $264 (1970-82)27,c $381 (2000)34 $415 (1983-94)30,c $482 (1990-2003)32,c
Phase I $100 (2003)25 $273 (2010)33
Phase II $300 (2003)25
$319 (2010)33
Phase III $73 (1963-75)b,c,d $314 (2010)33 $487 (2000)34,d $500 (2003)25 $578 (1983-94)30,c,d $965 (1990-2003)32,c,d
Marketing $48 (2010)33
$100 (2003)25
Summary $753 - 1,778
a Cumulative through NDA
b Hansen – as reported using data from Morgan et al. (2011) c Morgan et al.(2011), capitalized into 2009 USD
19
Overall, almost all data reported in Table 1 were for pharmaceutical development. No articles were found for medical devices, and only one article estimated R&D costs for medical diagnostics ($135 million).24 Drug development costs varied tremendously over a time span of 40 or more years, with the low and high-estimate differing by approximately $1 billion (adjusted for inflation at least through the year 2000). Therefore, inflation did not account for the large variance in R&D cost estimates.
Two articles sought to delineate costs by therapeutic areas such as cardiovascular, infectious disease, or oncology drugs. DiMasi et al.31, using
retrospective cost accounting (Method 1), expanded upon the general results reported in their 2003 research30 with a breakout of clinical costs for the therapeutic categories of central nervous system (CNS), anti-infectives, cardiovascular, and analgesics. They reported a range in clinical costs $464 to $609 million with anti-infectives being the most expensive to develop. Adams and Brantner38 used econometric modeling (Method 2) and delineated costs into several additional
20
Table 2. Clinical costs estimates by therapeutic category, in $ millions, adjusted for inflation for year 2000
Category DiMasi et al28
$ millions Adams & Brantner
38
$ millions
Blood - $906
Cardiovascular $111 $887
Dermatological - $677
Genitourinary - $635
HIV/AIDS $180a $540
Cancer - $1,042
Musculoskeletal - $946
Neurological $100 $1,016
Anti-parasitic - $454
Respiratory - $1,134
Sensoryb - $648
Analgesic $114 -
a General Anti-infectives, where HIV/AIDS is a sub-group
b Sensory drugs are not defined by the authors, but are assumed to eye and/or ear drugs to treat
21
In reviewing Table 2, only three subgroups have head-to-head comparisons, cardiovascular, HIV/AIDS, and neurological, and the costs differences ranged from three fold (HIV/AIDS) to ten-fold (neurological). These wide differences render consensus impossible. In other words, there are no agreed trends in R&D costs differences depending on the therapeutic area or diseases researched.
Summary of Costs of Pharmaceutical R&D
There is general consensus that the average drug currently requires $1 billion or more and 12-15 years to gain approval. The true cost to develop drugs is
important, as the high cost of R&D is used to partially justify the high cost of pharmacotherapies to consumers. With only 20 years of patent protection,
pharmaceutical developers have only a few years remaining of patent life to recover development costs much less to make a profit to fund on-going and future R&D efforts.
The articles summarized suggest that pharma R&D costs have risen
22
treated or the type of company conducting the research (large pharma versus small biotech), there are far too few data to substantiate any conclusions.
Concerns remain whether the data reported on R&D costs are accurate. Only one of the four methods has been repeated to any great extent, and primarily by the same core group of researchers. Regardless of the methodology used to estimate the R&D costs, two primary trends emerge:
1. Despite the billions of dollars spent annually to develop hundreds of different pharmaceuticals, very few data are published on where and how these funds are used, and:
2. For the little amount of data published, the original sources are usually unnamed and unverifiable.
Therefore, while the conclusion that $1 billion and 12-15 years may or may not be substantively true, verified data to support this estimate are thin. Overall, information for pharmaceutical R&D costs is scarce; costs for devices and diagnostics is virtually nonexistent.
23
rebates that pharma companies sometimes receive.36 Overall, regardless of the cost estimation methodologies, most assume that any biases would tend to overestimate costs.
In conclusion, research on the cost of pharmaceutical development is
criticized for many of the same reasons that R&D itself is attacked; that is, a lack of transparency coupled with a presumed bias towards skewing data in favor of maximizing profits and not patient benefit. The pharma industry can only address these concerns by improving transparency and allowing open access to independent parties to collect, analyze, and report R&D costs.20
Topic 2: R&D Costs and the Overall Cost of Marketed
Pharmaceuticals to Consumers
Few estimates exist on the cost of R&D versus to total cost of a drug to consumers. The estimates also tend to be highly variable, as pharmaceutical
24
Figure 2: Average revenue from each prescription required to cover the costs of R&D, manufacturing, distribution, marketing, etc.
25
Table 3. Itemized costs contributing to the overall cost or a prescription from a retail pharmacy, based on NCADS estimates in Figure 2
Item Cost ($) %
Manufacturer Cost of Materials 17.87 22.2
Manufacturer SG&A 19.57 24.3
Manufacturer R&D 11.95 14.8
Manufacturer Taxes 5.40 6.7
Manufacturer Total Profit 9.92 12.3
Manufacturer Sub-total 64.71 80.4
Wholesaler Operating Costs 0.62 0.8
Wholesaler Taxes 0.39 0.5
Wholesaler Net Profit 0.71 0.9
Wholesaler Sub-total 1.72 2.1
Retail Operating Costs 11.34 14.1
Retail Taxes 1.67 2.1
Retail Net Profit 1.09 1.4
Retail Sub-total 14.10 17.5
Total $80.53 100.0%
% of R&D to manufacturer's costs 18.5%
26
Other research in the grey literature suggests that the cost of the raw materials is much less (<1%)40 and state, but offer no data, that the proportion of R&D costs to the cost to consumer is much higher. It is important to note that the profits and SG&A are generated three times to account for the 1) manufacturer (drug company), 2) wholesaler (eg. McKesson, Cardinal, etc.)41, and 3) retailer (local pharmacies). Based on these scant data, reducing R&D costs by as much as 50% would therefore only reduce the cost to consumer by 7.5%, which would reduce the NACDS estimated average cost of a prescription from $80.53 to $74.49 without requiring pharma to reduce profits. Overall, given estimates of spending for
pharmacotherapies reaching $1.2 trillion by 2016,10 a 7.5% reduction would equate to $90 billion in savings that could in theory be passed on to consumers each year.
Topic 3: What is Open-Source Pharmaceutical R&D?
There have been proposals for open-source drug discovery,33,42,43 where
development of potential drug candidates would progress in a completely open-source fashion, akin to open-open-source software development where the open-source code is not protected by patent. An example of open-source computer software
development is a free and non-patented computer operating system called Linux,44 comparable to computer operating systems that are patented and must be
27
normally patentable information such as its chemical structure and manufacturing techniques.
The open-source drug discovery model is built upon two assumptions that would hinder its utility for broader pharma R&D, namely:
1. Open-source drug discovery assumes that the model would be used only for unprofitable diseases where there is likely to be little or no commercial interests (e.g. neglected tropical diseases (NTD), “orphan” diseases);45
2. Researchers pursuing open-source drug discovery into full clinical
development would tend to be volunteers46 or perhaps supported by grants or government funding.42
This model proposes that, after potential drug candidates are found during the drug discovery stage, then clinical development might then be conducted, with no pharmaceutical company funding, by a decentralized community of self-interested and self-funded scholars. Open-source drug discovery proponents acknowledge this approach might be relevant to only a small number of compounds targeted for NTDs, and therefore only benefit a relatively small number of people from a global population health perspective, albeit among the most underserved.
28
“Scientists also had to keep their work secret, exploring new medicines
without insight from outsiders. But companies can't keep a tight leash on their researchers if they expect to capitalize on the deepening understanding of how diseases happen, contends the chief executive of Sanofi SA, Christopher Viehbacher.” 47
Although not stated explicitly, this comment may only have referenced the basic science and drug discovery stage in the laboratory, as opposed to the clinical development stage in humans. However, a more recent quote from Christopher Viehbacher as part of a press release from the CEO Roundtable on Cancer is clearly directed at the full scope of pharma R&D:
“Broadly sharing existing clinical trial data for the benefit of all researchers can be a key driver in speeding up cancer research efforts, encouraging innovation, and honoring those patients who have participated in clinical trials as well as those future patients who deserve our very best collective efforts in discovering new and better therapies.”48
In addition, a 30 January 2012 press release from the Drugs for Neglected Diseases initiative (DNDi), announced that 11 large pharmaceutical companies (Table 4) are co-investing $785 million to support collaborative R&D efforts:
“In the largest coordinated effort to date to combat NTDs, the group
announced… that they would… share expertise and compounds to accelerate research and development of new drugs… Partners also… pledged new levels of collaborative effort and tracking of progress.” 49
These quotes from Sanofi and the DNDi are examples of large pharma companies endorsing the sharing of information and know-how with a goal of improving the R&D process.
29
However, in September 2012, a consortium of ten large pharmaceutical companies (Table 4) created a not-for-profit, named TransCelerate Biopharma, to collaborate and share information:
“with the end goals of improving the quality of clinical studies and bringing new medicines to patients faster. Through participation in TransCelerate, each of the ten founding companies will combine financial and other resources, including personnel, to solve industry-wide challenges in a collaborative environment.” 50
Garry Neil, then interim CEO of TransCelerate stated,
"There is widespread alignment among the heads of R&D at major pharmaceutical companies that there is a critical need to substantially increase the number of innovative new medicines, while eliminating inefficiencies that drive up R&D costs… Our mission at TransCelerate BioPharma is to work together across the global research and development community and share research and solutions that will simplify and accelerate the delivery of exciting new medicines for patients." 50
TransCelerate and its academic partners intend to begin with five initiatives for collaboration which involve sharing information they deem to be “pre-competitive”. Pre-competitive appears to describe information that has traditionally been
considered proprietary or “trade secrets” but not necessarily protected by patent. The five initiatives are:
1. Creating a shared interface for investigator site portals, meaning web-sites that allow physicians and their staff who are participating in clinical trials to share information about their study(ies);
30
might have to complete some of the same qualification procedures and training five times;
3. Developing risk-based monitoring approaches and standards; 4. Further developing clinical data standards; and
5. Establishing a comparator drug model, where in many studies a potential new drug under investigation must be studied by comparing its safety and efficacy to that of an already approved drug.
TransCelerate is an unparalleled initiative where pharmaceutical companies are seeking to collaborate and share information in a way that would benefit all drug development, not just NTD. However, open-science R&D, as proposed below, goes further than TransCelerate in that it contemplates the sharing of “competitive”
31
Table 4: Large pharmaceutical companies participating in the DNDi or TransCelerate as of 10 February 2012
DNDia TransCelerateb
AbbVie (Abbott) Celgene
Eisai Genzyme Gilead
GNF Novartis GSK
Merck Pfizer Sanofi Vertex
AbbVie (Abbott) AstraZeneca
Boehringer Ingelheim Bristol-Myers Squibb GSK
Johnson & Johnson Lilly
Pfizer Roche Sanofi
a from www.dndi.org
b from www.transceleratebiopharmainc.com
Chapter 3: Conceptual Model and Research Questions
Drug Development: Conceptual Model
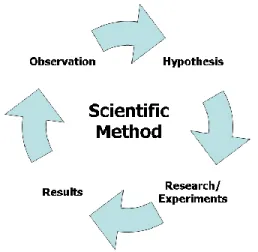
Pharmaceutical R&D follows the concept of the Scientific Method, encompassing the following four major components (Figure 3):
Figure 3: Components of the scientific method
33
Transparency, independent verification, and reproducibility are not widely practiced in for-profit pharma R&D, and therefore the current R&D process is in stark contrast to best practices in scientific research. As a result, the concept that optimal research should be transparent, reproducible, and conducted among the global community of scholars generally is not supported in for-profit medical research.
Proposed Open-Science Research and Development Paradigm
An open-science R&D (OSRD) paradigm as proposed in this research is not true “source” as understood by computer software developers and open-source drug discovery proponents. In a completely open-open-source R&D model, even patented information would be widely shared, including the molecular structure and means of synthesis.
Importantly, in the proposed open-science paradigm for pharma R&D, it is assumed that the discoverer and developer of the compound would still hold and keep proprietary any patent or patents, would fund R&D, and therefore could sell the drug or technology and seek profits if approved for marketing and distribution.
The reasons for maintaining a patent-based, for-profit model are two-fold:
1. To maintain profitability for developers in order to allay concerns that substantial profit erosion would undermine funding for future R&D, thereby reducing innovation in medical research.
34
there is typically much less interest and investment from pharma. Therefore, an open-science process could have a much larger impact on global
population health in both the developed and less developed world.
The proposed science model for pharma R&D would not be completely open-source as the open-source (molecular structure and synthesis) would still be patent protected and proprietary. However, the process or “science” of developing a
molecule would be open and transparent, hence the proposed label, Open-Science Research and Development (OSRD).
The proposed OSRD process seeks to combine the concept of transparency and collaboration that is intertwined with the scientific method with the pharma R&D process. The underlying assumption is that the lack of transparency and
collaboration in R&D reduces quality and efficiency, perhaps to the point of being financially negative, and that the efficiency and quality gained by an OSRD process may overcome any loss of competitive advantage that proprietary R&D is intended to protect. In short, the question is whether it is possible that more transparency and collaboration in for-profit pharma R&D could, under certain circumstances, be
advantageous to patients as well as profitable to the pharma industry.
35
Table 5: Information typically patented and/or kept proprietary under the current pharmaceutical R&D paradigm
Molecular/Chemical Structure
Synthesis and Manufacturing Processes
Discovery process data such as in vitro laboratory testing (anti-viral activity, molecular binding, up and down-regulation of genes, computer modeling, etc.) Pre-clinical and Clinical Development Plans including Study Protocols
Pre-clinical research (study designs, raw data, analysis) Targeted Product Profiles, marketing research
o Animal toxicity
o Animal efficacy models when possible
o Mechanism of Action
Clinical research (study designs, raw data, analysis)
o Phase I (First-in-human, Clinical Pharmacology, etc.)
o Phase II (Dose-finding, Proof of Concept)
o Phase III (Efficacy)
o Phase IV (Post-marketing)
All correspondence with regulators, including meeting minutes
36
Most information and data described above are normally part of the Investigational New Drug (IND) application and are not obtainable under the Freedom of Information Act (FOI), even after the drug is approved.52 Some FDA materials and correspondence related to each drug candidate is discoverable after a drug has been approved, limited to parts of the actual New Drug Application (NDA) itself. Also, high-level results of some pre-clinical and clinical studies are often
presented at conferences or published in journals, but typically only if positive results are achieved. Such abstracts, presentations, and articles may contain rudimentary information on study designs and analyses, but are inadequate to allow independent verification of results.
The proposed OSRD paradigm proposes to make transparent much of what is kept proprietary as outlined in Table 5 above, with the following exceptions:
Molecular/Chemical Structure
Synthesis and Manufacturing Processes
Some Clinical Trial Data and Analysis (until after un-blinding of treatment assignment in controlled, blinded studies).
The purpose of keeping the first two items proprietary is so developers can protect the patents on their intellectual property and ultimately have a drug to sell if it is approved by regulators. Otherwise, other drug manufacturers could steal,
37
In the proposed OSRD process, all other information that makes up most of the IND and NDA, including study protocols, study data, analysis programs, IND safety updates, and written interactions with regulators, could be made available in an on-going fashion during the R&D process. Full and timely disclosure of most of the contents of the IND could be made a pre-requisite for filing the NDA, thereby truly opening up the R&D process.
In summary, this research examines whether an OSRD approach to pharmaceutical R&D could lead to better designed and more efficient drug
development plans and processes, resulting in better study designs, higher quality data and analysis, and lower R&D costs.
Research Questions
Primary Research Question:
Overall, would an OSRD paradigm for pharma R&D be feasible and desirable in terms of process quality and efficiency, as defined by the key informants?
Secondary Research Questions:
What are impressions of the current process of R&D in terms of process quality and efficiency?
38
Would OSRD have a positive, negative, or neutral impact on the efficiency (time and/or costs) of clinical research design, conduct, analysis, and results overall?
Regardless of whether or not the key informants support OSRD, do they recommend other and potentially better innovations applicable to pharma R&D?
Chapter 4: Methods
Data Source: Key Informant Interviews
To answer the primary and secondary research questions, qualitative data were collected from key informants using a semi-structured questionnaire and interview format (Appendix 5). The choice of key informants and interview questions were intended to encompass the full range of information relevant to pharma R&D including patient privacy, intellectual property and patent law, regulatory oversight, science, healthcare financing, information technology, policy, politics and marketing.
The key informant interview methodology is well suited for exploratory research such as a new and hypothetical OSRD paradigm. Moreover, the primary endpoints, pharma R&D quality and efficiency, at this time are ill-defined under the current R&D model, therefore providing no credible baseline on which to build a more quantitative research methodology.
Finally, it would be impractical to rapidly pilot-test OSRD by applying it to some pharmaceuticals in development, and then comparing the efficiency and quality of OSRD versus pharmaceuticals developed under the traditional paradigm.
In other words, there are currently no quantitative means by which to
40
approval.’ The qualitative key informant approach is therefore ideally suited to investigate a hypothetical pharma R&D process such as OSRD to assess its potential feasibility and acceptability.
Identifying Key Informants
Key informants were contacted representing three major stakeholder groups: academia, industry, and regulatory authorities, as shown in Figure 4. Academics were sought in order to gather feedback from
researchers that were more likely to be open to innovations that challenge the
current drug R&D process. Industry representatives were interviewed as it was initially assumed that they would be the most invested in the status quo, the current drug development process, and therefore the most resistant to change. Moreover, pragmatically, it is unlikely that the pharma R&D process can be modified without buy-in from industry, and therefore it was important to gauge pharma’s appetite for change. Finally, regulators were interviewed because changes to the R&D process could have an impact on the future approvability of drug candidates, and therefore regulatory support for any major innovation is critical.
Senior scientists, executives, and regulators were chosen from organizations such as the following:
41 Academia
Cleveland Clinic Coordinating Center for Clinical Research, Duke Clinical Research Institute, Harvard Clinical Research Institute, etc.
Various healthcare economics, financing, patient advocacy groups, and/or policy organizations (e.g. Open-Science In Drug Discovery, Clinical Trials Transformation Initiative)
Industry
Pharmaceutical, device and/or diagnostic development companies, both “Large Pharma” and smaller “Biotechs”
Contract Research Organizations, to which pharmaceutical companies typically outsource R&D (e.g. Quintiles, PPD, PRA)
Regulatory
US FDA, EMA
42 Recruiting Key Informants
The process for recruiting potential key informants included the following steps:
1. Potential participants were contacted via e-mail or letter (Appendix 1) to ascertain interest in participating in research regarding general innovations to the current paradigm for pharma R&D.
2. Potential participants were provided with a brief description of the proposed hypothetical OSRD model (Appendix 2).
3. Potential participants were given an Informed Consent Form (Appendix 3) prior to seeking verbal consent and encouraged to contact the researcher with any questions or concerns regarding participation. Verbal consent was obtained immediately prior to conducting an interview.
4. Thirty-to-60 minute interviews were scheduled and conducted in-person or over the telephone.
IRB Review
As the key informants were not a vulnerable population, the information
sought in the interviews was not particularly sensitive, and the likelihood of breach of confidentiality was low, the UNC Biomedical Institutional Review Board (IRB)
43
Confidentiality Issues
In order to protect the confidentiality of the key informants, information about their roles and experience was reported in the aggregate. Many participants had multiple degrees, but only one degree was reported. Masculine pronouns (he, his) were used regardless of the sex of the participant. Finally, when referring to
someone’s role such as CEO, Senior Regulator, or Academician, the active tense is used, suggesting that they were in the stated role during the time of the interview even though they may not have been (e.g. retired). The title or role reported represents the highest or the longest role in duration in their careers at the time of the interview.
Also, throughout the paper attributed quotes are used, for example in the Review of the Literature and also the Discussion chapters. Note that none of the attributed quotes came from people who were also key informants for the research.
Data Collection Procedures
Interviews were recorded when permitted by the respondents and notes taken by the interviewer in all cases. In some cases, the key informants referenced or provided additional materials to support their comments. Immediately after the interview, the interviewer clarified and/or amended the interview notes (Appendix 4).
All recorded interviews were transcribed. To protect key informant
44
their names were replaced with a letter/number code. The key for identifying which code corresponded to which interview was maintained in a password-protected Microsoft Excel file.
Data Management and Analysis Plan
The transcribed interviews were coded and analyzed manually, using the Coding Manual developed for this research and presented in Appendix 7. The
quotations reported here are predominately verbatim, with minimal editing in order to remove information that might compromise the confidentiality of the participant. When such edits occur to directly quoted responses, the edits are identified by
Chapter 5. Results
Characteristics of Interviews and Key Informants
Sixteen potential key informants were contacted; one regulatory representative did not respond to the recruitment e-mail and one academic representative agreed to be interviewed by telephone but did not attend as scheduled. Attempts to reschedule were unsuccessful. Therefore, fourteen interviews were conducted between 18 June and 10 December 2012. Ten of 14 interviews were conducted by telephone, and all but one key informant agreed to have their interview audio recorded. One participant asked for and received the interview questions in advance and provided a written response prior to the
46
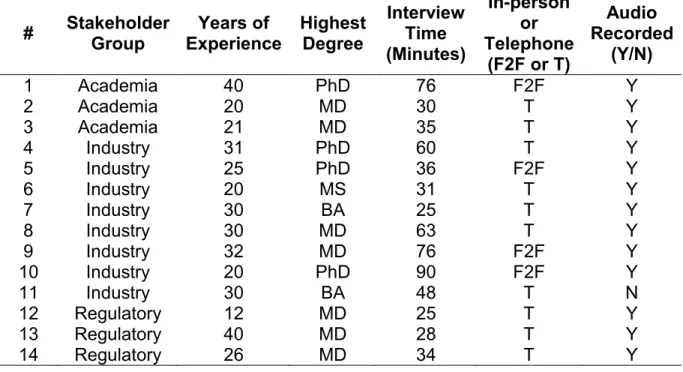
Table 6. Key informant backgrounds (stakeholder group, years of experience, highest degree obtained) and interview characteristics (interview time, format, and whether recorded)
# Stakeholder Group Years of Experience Highest Degree Interview Time (Minutes) In-person or Telephone
(F2F or T)
Audio Recorded
(Y/N)
1 Academia 40 PhD 76 F2F Y
2 Academia 20 MD 30 T Y
3 Academia 21 MD 35 T Y
4 Industry 31 PhD 60 T Y
5 Industry 25 PhD 36 F2F Y
6 Industry 20 MS 31 T Y
7 Industry 30 BA 25 T Y
8 Industry 30 MD 63 T Y
9 Industry 32 MD 76 F2F Y
10 Industry 20 PhD 90 F2F Y
11 Industry 30 BA 48 T N
12 Regulatory 12 MD 25 T Y
13 Regulatory 40 MD 28 T Y
14 Regulatory 26 MD 34 T Y
47
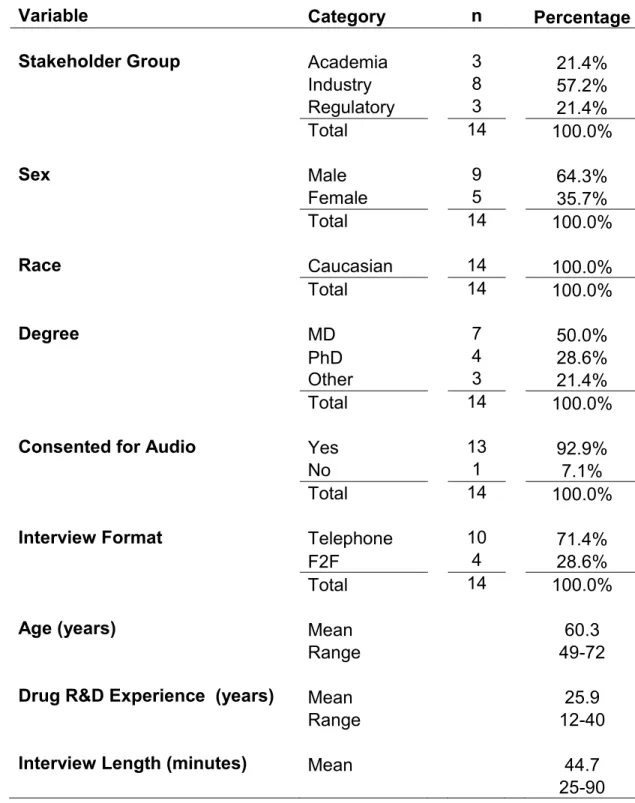
Table 7. Aggregated data on key informants and interviews
Variable Category n Percentage
Stakeholder Group Academia 3 21.4%
Industry 8 57.2%
Regulatory 3 21.4%
Total 14 100.0%
Sex Male 9 64.3%
Female 5 35.7%
Total 14 100.0%
Race Caucasian 14 100.0%
Total 14 100.0%
Degree MD 7 50.0%
PhD 4 28.6%
Other 3 21.4%
Total 14 100.0%
Consented for Audio Yes 13 92.9%
No 1 7.1%
Total 14 100.0%
Interview Format Telephone 10 71.4%
F2F 4 28.6%
Total 14 100.0%
Age (years) Mean 60.3
Range 49-72
Drug R&D Experience (years) Mean 25.9
Range 12-40
Interview Length (minutes) Mean 44.7
48
Two-thirds of key informants were male and all were Caucasian. Over three-quarters had an MD and/or PhD. The three regulatory representatives were very senior officials, and the three academicians were tenured, full professors or
equivalent. Among the eight industry participants, five were Chief Executive Officers (CEOs) and/or Presidents of their respective companies, one was a Chief Medical Officer (CMO) in small Pharma and a CRO, and two were Vice Presidents (VPs) in large pharma. All but one participant had at least 20 years of experience in drug development.
49
Key Topics and Findings
Several topical areas emerged from the interviews based on the questions asked (Appendix 5). Seven major topics discussed included the key informant’s responses to:
I. Current state of pharma R&D;
II. Potential impact of OSRD on pharma R&D quality;
III. Potential impact of OSRD on pharma R&D efficiency (time and costs); IV. Other potential impacts of OSRD;
V. Other innovations than OSRD that should be considered;
VI. Barriers to implementing OSRD to more mainstream pharma R&D; and VII. Opportunities for implementing OSRD to more mainstream pharma R&D.
Each topic is discussed below, with quotes from the key informants whenever relevant, and with additional quotations provided as noted in Appendices 8, 9 and 10.
I. Impressions on the Current State of Pharma R&D
Each interview began with a question about the participant’s views on the current state of pharma R&D in terms of quality and efficiency, to serve as a baseline with which to compare potential innovations including OSRD. The
50
“pharmaceutical R&D process as it is practiced by major ethical
pharmaceutical companies is one of very high integrity.” VP, Large Pharma
The context here was that the quality of R&D is very high, particularly in regards to patient safety and data quality. The head of a CRO stated that he believes:
“there is sincere intent for high quality throughout all sectors of pharma R&D.”
CEO, CRO
Likewise, a CMO from a large CRO commented favorably on quality in the current approach to R&D:
“From the standpoint of a) scientific rigor, and b) the necessary controls around ensuring that from the very beginning of discovery all the way through to regulatory approval and use of a product in humans, I would grade the quality of it around 80 – 90%. It meets the mark in terms of internal control over what works, what doesn’t work, why it doesn’t work, and drugs washing out of the development program because they don’t meet milestones.” CMO, CRO
However, in contrast, a large pharma representative was more cautious, stating that he had:
“more ethical concerns” and that “the danger now is that decisions are made at a higher level, possibly with more business interest than quality and patient safety.” VP, Large Pharma
This large pharma VP expressed concerned that when business interests override ethical concerns, this can lead to problems such as with Avandia™ (rosiglitazone), a diabetes drug where a pharmaceutical company pled guilty to intentionally
51
However, when asked about the efficiency of the current pharma R&D model, in terms of costs and time, the key informants were almost universally negative. The negative feedback included:
“The clinical side of it keeps getting longer. Well, not so much longer, but costlier and with poorer success rates. That is a big concern.” Academician
“R&D is very slow” and the “costs are ungodly”. VP, Large Pharma
“It’s terrible because it is so costly and [pharma has] such poor success rates – the predictability of their models are so bad”. Senior Regulator, FDA
Countering this nearly unanimous criticism only one participant, a VP from large pharma, had more positive feedback on the efficiency of R&D as it is currently practiced, stating:
“The issue of whether the system itself is efficient or not… the processes themselves have, in the short run, a tendency to be somewhat less efficient, but in the long run, in the end, when you stretch it out and calculate it, it is probably sufficient in order to support the value proposition and the
investment.” VP, Large Pharma
When prompted with published concerns that the current drug development process is too inefficient to be sustainable,1 this same VP replied:
“This is the most profitable industry in the history of free enterprise. The profitability in the pharmaceutical business is extremely high... So, I do not [agree with] people saying that the cost of the pharmaceutical R&D is not sustainable.” VP, Large Pharma
52
researchers exhibiting ethical behavior and a high regard for patient safety. However, even with the very positive views expressed by one VP from large pharma, the overwhelming view was that the current process for pharma R&D is very inefficient and unsustainable in terms of costs and time.
Additional comments on the efficiency of the current pharma R&D process are in Appendix 8.
II. Advantages and Disadvantages of OSRD for R&D Quality
53
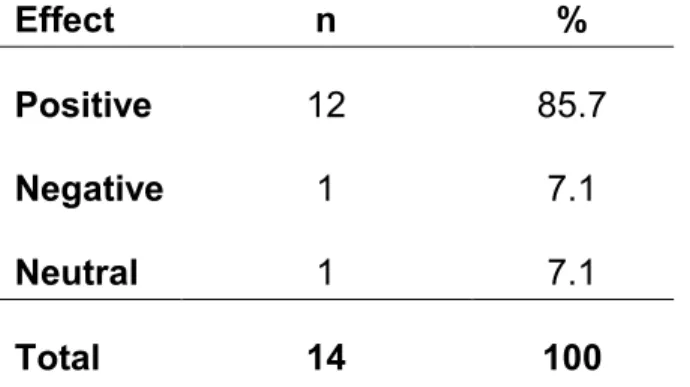
Table 8. Potential effect of OSRD in terms of R&D quality (positive, negative, or neutral); Aggregated for all participants
Effect n %
Positive 9 64.3
Negative 1 7.1
Neutral 4 28.6
Total 14 100
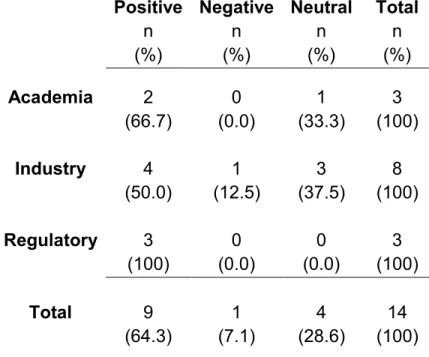
Next, to explore whether there were different perspectives between stakeholder groups, responses where broken out as reported in Table 9.
Table 9. Potential effect of OSRD in terms of R&D quality (positive, negative, or neutral); by stakeholder group
Positive n (%)
Negative n (%)
Neutral n (%)
Total n (%)
Academia 2 0 1 3
(66.7) (0.0) (33.3) (100)
Industry 4 1 3 8
(50.0) (12.5) (37.5) (100)
Regulatory 3 0 0 3
(100) (0.0) (0.0) (100)
Total 9 1 4 14