Tobacco Town: Computational Modeling of Policy
Options to Reduce Tobacco Retailer Density
Douglas A. Luke, PhD, Ross A. Hammond, PhD, Todd Combs, PhD, Amy Sorg, MPH, Matt Kasman, PhD, Austen Mack-Crane, BA, Kurt M. Ribisl, PhD, and Lisa Henriksen, PhD
Objectives.To identify the behavioral mechanisms and effects of tobacco control policies designed to reduce tobacco retailer density.
Methods.We developed the Tobacco Town agent-based simulation model to examine 4 types of retailer reduction policies: (1) random retailer reduction, (2) restriction by type of retailer, (3) limiting proximity of retailers to schools, and (4) limiting proximity of retailers to each other. The model examined the effects of these policies alone and in combination across 4 different types of towns, defined by 2 levels of population density (urban vs suburban) and 2 levels of income (higher vs lower).
Results.Model results indicated that reduction of retailer density has the potential to decrease accessibility of tobacco products by driving up search and purchase costs. Policy effects varied by town type: proximity policies worked better in dense, urban towns whereas retailer type and random retailer reduction worked better in less-dense, sub-urban settings.
Conclusions.Comprehensive retailer density reduction policies have excellent potential to reduce the public health burden of tobacco use in communities. (Am J Public Health.2017;107: 740–746. doi:10.2105/AJPH.2017.303685)
L
ocal, state, and federal policy change has great potential to ameliorate the major risk factors for chronic disease and cancer, although much of this potential is unrealized.1 Policy proposals to create healthier com-munities increasingly attempt to alter the retail availability of unhealthy and healthy products.2Tobacco control policy and re-search are increasingly focused on the retail environment because it is the dominant channel for tobacco marketing in the United States. After the Master Settlement Agree-ment eliminated billboard and transit adver-tising and curtailed industry-sponsored events, annual spending at retail increased from $4.7 billion in 1998 to $8.6 billion in 2013.3Retail-focused policy is arguably the most important frontier in tobacco control and can be seen as a newfifth core strategy of state and national tobacco control programs. The traditional strategies have been to (1) raise cigarette excise taxes, (2) implement com-prehensive smoke-free air laws, (3) offer cessation services, and (4) launch hard-hitting countermarketing campaigns.Tobacco companies have contested nearly all provisions of the Family Smoking Pre-vention and Tobacco Control Act that would have the greatest impact on the retail envi-ronment.4,5Given the inevitable delays during court battles, one of the most legally sound means to counteract the impact of retail marketing on tobacco use is for state and local governments to restrict the quantity and lo-cation of tobacco retailers, which can reduce both the availability of the product and the marketing associated with it.6,7Such retailer reduction strategies have been effective to reduce alcohol consumption8and there is considerable interest in adapting this para-digm to tobacco control.2,9
Approximately 40% of US adolescents (aged 13–16 years) live within walking dis-tance of a tobacco retailer,10and nearly half visit these stores at least weekly.11Living in neighborhoods with higher tobacco retailer density predicts a higher incidence of current smoking among adolescents12and more frequent smoking by adults.13Despite these associations, little is known about how pol-icies can most effectively reduce retail density, and whether those reductions can have notable public health benefits.
The foundational policy for monitoring and reducing density is retailer licensing.6 In the absence of a national requirement to license tobacco retailers, 39 states; Wash-ington, DC; and growing numbers of local-ities currently regulate how and where tobacco products can be sold through licensing.14 Retail licensing also paves the way for more innovative policy strategies, such as capping the number of licenses, maximizing distances between retailers, and prohibiting sales near youth-oriented locales (e.g., schools and parks) and at certain store types (most often pharmacies). For example, in 2014, San Francisco, California, amended its licensing ordinance to include a cap that aims to equalize the number of retailers in its 11 administrative districts, and to establish a 500-foot buffer zone between retailers as well as between schools and retailers. In the
first year after the amendment, the city saw an 8% decrease in retailers.15Almost 70% of Massachusetts residents live in municipalities that mandate tobacco-free pharmacies, and
ABOUT THE AUTHORS
Douglas A. Luke, Todd Combs, and Amy Sorg are with the Center for Public Health System Science, George Warren Brown School of Social Work, Washington University in St Louis, St Louis, MO. Ross A. Hammond, Matt Kasman, and Austen Mack-Crane are with Center on Social Dynamics and Policy, Brookings Institution, Washington, DC. Kurt M. Ribisl is with the Gillings School of Global Public Health, University of North Carolina, Chapel Hill. Lisa Henriksen is with Stanford Prevention Research Center, Stanford University, School of Medicine, Stanford, CA.
Correspondence should be sent to Douglas A. Luke, Washington University in St Louis, Campus Box 1196, One Brookings Drive, St Louis, MO 63130 (e-mail: [email protected]). Reprints can be ordered at http://www.ajph.org by clicking the“Reprints”link.
cities in Minnesota are currently working to reduce availability offlavored tobacco products (including menthol) by restricting their sale to tobacco specialty stores.16
Computational systems modeling is a powerful research tool for public health policies, especially when traditional experi-mental and observational studies of retail policies are not possible or practical.17 Al-though computational modeling has been used in tobacco control, most of these stu-dies have used system dynamics to model population-level characteristics such as smoking prevalence.18,19Agent-based mod-eling is a type of dynamic modmod-eling that uses computer simulations to examine how ele-ments of a system (agents) behave as a function of their interactions with each other and their environment.20Agent-based modeling is at the forefront of modern infectious disease research,21but is increasingly being used in chronic disease and health policy studies.22–24 Although some modeling studies have ex-amined retail policy effects, they have relied on econometric modeling techniques (such as life-table forecasting) that cannot ex-amine individual behavior–environment in-teractions.25,26The focus of agent-based modeling on agent interaction allows detailed examination of how public health policies may affect individual behavior, as well as how the local physical and social environment influences behavioral dynamics. Use of agent-based models to study policy mecha-nisms and effects has recently been recom-mended as an important tool in tobacco control policy and regulation.27
This article presents the results from an agent-based model and virtual policy labo-ratory that we named Tobacco Town, which we developed with state-of-the-art complex systems modeling procedures, and based on existing epidemiological, tobacco retailer, and Census data. We used Tobacco Town to explore the potential effects of 4 types of retailer reduction policies: (1) random retailer reduction (similar to how cap-and-winnow strategies based on licensing and zoning laws would work), (2) restriction by type of retailer (e.g., pharmacy bans), (3) limiting proximity of retailers to schools, and (4) limiting proximity of retailers to each other. The model examined the potential effects of these policies alone and in combination across 4 different types of towns, defined by 2 levels of
population density (urban vs suburban) and 2 levels of income (higher vs lower).
METHODS
The Tobacco Town agent-based model focuses on patterns in the purchase behavior of smokers. During each simulated run of the model, agents (smokers) commute between home and work and make decisions about whether to purchase cigarettes, where to purchase them, and how many cigarette packs or cartons to purchase. Because agents in this model utilize stylized but consistent decision-making approaches, we can glean important insight into the joint effect of environment and policy on tobacco retailer density and the total cost of acquiring cigarettes.
We designed this agent-based model by following current computational simulation best practices.28These begin with formulat-ing a clear question (e.g., What impact do retailer density dynamics exert over cost?), and include grounding assumptions in re-search and theory and collaboration with substantive experts, iteratively building in model complexity, thorough calibration and sensitivity analyses, and,finally, thoughtful translation, visualization, and communication of results. It was written in Java (version 1.7.0_51/1.8.0_51, Oracle Corporation, Redwood City, CA) within the Repast Simphony framework (version 2.1/2.3.1).29 In addition to the summary provided in this section, we direct interested readers to a more detailed technical description of the model in Appendix A (available as a supplement to the online version of this article at http://www. ajph.org) and to previous work by the authors that discusses the rationale and development of the features that were included in this model.
Environment and Agents
From previous studies1,10,30and experi-ence in tobacco control policy, we appreciate that policy effects differ across diverse envi-ronments. Therefore, our model consists of 4 archetypal and abstract town types that we derived from data from California cities and a national sample of retailers. We refer to the town types as urban rich, urban poor,
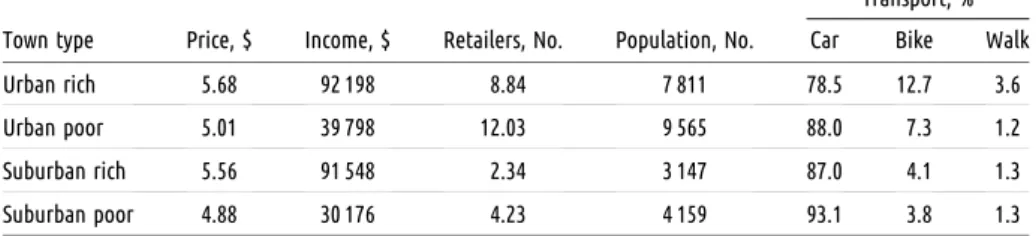
suburban rich, and suburban poor. Based on the California cities data, we constructed the 4 town types by using retailer, school, work-place, and population densities; commute times; and proportions of transport mode use (vehicle, bicycle, or walking; Appendix A, available as a supplement to the online version of this article at http://www.ajph.org). Data available from a national sample of retailers provide average prices for different store types that include convenience, pharmacy, liquor, grocery, warehouse, and tobacconist stores. We represented each town in an abstract 10-square-mile lattice grid of roads and blocks wherein retailers, homes, and workplaces are situated. Table 1 contains selected baseline statistics for the 4 town types.
Agents in the Tobacco Town model represented adult smokers and each had 6 time-invariant, or constant, attributes: smoking rate, mode of transport, wage, home and work locations, and a route between the 2 locations; we based distributions of these at-tributes on the environment in which a sim-ulation takes place. During the course of a simulated run of the model, each agent’s cigarette inventory and current location were dynamically updated based on their actions.
Agent Actions and
Decision-Making
Each simulated day in Tobacco Town consisted of 2 periods, morning and evening. Each evening, agents smoked a number of cigarettes based on their smoking rate, de-pleting their inventory. Each morning, agents assessed their cigarette inventory and decided to procure cigarettes if their current inventory was less than their daily smoking rate.
dollar cost of cigarettes (see Equation 2 in Appendix A, available as a supplement to the online version of this article at http://www. ajph.org).
Model Usage and Policy Tests
Each simulated run of the Tobacco Town model consisted of 30“days”(morning and evening periods). During these runs, we collected data on the environment, agents, and their purchase decisions; our model stored aggregated and individual-level data on cigarette purchases. These data included the cost, distance, and time for travel to the se-lected retailer, purchase price and quantity, and type of retailer. The 30 days was both conceptually tidy (reflecting a simulated month) and, coupled with 40 runs conducted under every parameter set, ensured that stable agent behavior patterns could be identified from the stochastic model.31Tobacco Town evaluated tobacco retailer reduction policies being tested in US com-munities and stronger versions of these pol-icies to see their potential effects. We tested 4 types of policies individually and in com-bination: (1) a retailer cap compared effects of capping the density of retailers to 90%, 80%, 70%, 60%, and,finally, 50% of initial levels; (2) a school-proximity buffer compared prohibiting retailers within 500, 1000, or 1500 feet of schools; (3) a retailer-proximity buffer compared requiring a minimum dis-tance between retailers of 500, 1000, or 1500 feet; and (4) a retailer type restriction tested the equivalent of a tobacco sales ban, by re-moving either all pharmacies or all conve-nience stores (with and without gasoline). Finally, we ran 2 sets of tests that combined all 4 individual policy types; a moderate-strength
combination (75% cap, 1000-foot school and retailer buffers, pharmacy ban) and a high-strength combination (50% cap, 1500-foot school and retailer buffers, convenience store ban).
RESULTS
Table 2 presents the results of all model runs, including the changes in retailer density (retailers per square mile) and the subsequent increase in overall cost of obtaining cigarettes for the different types of policy interventions across the 4 town types.
Retailer Density Reduction
In the baseline runs (before policy tests), retailer density varied from 2.34 retailers per square mile (for the suburban rich town type) to 12.09 retailers per square mile (urban poor). As expected, higher levels of the interventions were associated with greater reductions in density. For example, a 500-foot school buffer decreased density in the urban poor town type from 12.03 to 11.27, while the much larger 1500-foot buffer reduced density to 3.23 retailers per square mile.Figure 1 shows the relationship between density and overall cost across all model runs: in general, as density decreased, cost in-creased. Thefigure illustrates 2 other im-portantfindings. First, there appeared to be a nonlinear relationship between density and cost, with the possibility of a threshold effect around 3 retailers per square mile. Second, the relationship between density and cost varied by town type. In particular, the urban town types were less likely to see large increases in
costs, as they started out with much higher retailer densities.
Effects on Cost of Retailer
Reduction Policy Interventions
In addition to the specific average per-pack total travel plus price cost presented in Table 2, Figure 2 highlights the impacts on total cigarette travel plus price cost per pack in each town type as a result of each policy strategy. Each line plot shows the percentage increase in cost observed relative to the baseline costs. In general, stronger policies resulted in higher costs, although the pattern varied by town type.
Retailer caps and retailer type sales bans.For density, retailer cap strategies operated in a straightforward and uniform manner (i.e., capping the number of licenses at 50% of the current total cuts retailer density in half across town types). For town types other than suburban rich, cost increases were modest (<4%), even at the highest intensity of halving the number of retailers per square mile. However, for suburban rich communities, a 50% retailer density reduction resulted in a 7% increase. This indicates that the average baseline cost of $5.56 would rise more than 35 cents to $5.94.
Pharmacies represented a small portion of tobacco retailers: 5% to 11% of all stores in the 4 town types here. However, because pharmacies sell cigarettes more cheaply than other retailers on average,32removing to-bacco sales from pharmacies affected overall costs more than a random 10% retailer reduction (Table 2). Restricting sales for convenience stores, which comprised a much larger portion of tobacco retailers, predicted different impacts on density and cost. Here the policy effects for density re-duction were more pronounced, and cost increases further illuminated differences between urban and suburban environments. Because suburban areas had fewer retailers at the baseline, removing convenience store tobacco sales effectively halved retailer density and, as stated previously and seen in Figure 1, more marked cost increases were predicted. In suburban poor town types, for example, implementing this policy reduced retailers from more than 4 to less than 2 per square mile, and the associated cost increases were about 7%.
TABLE 1—Comparison of Baseline Town Type Characteristics in the Tobacco Town Agent-Based Model
Transport, %
Town type Price, $ Income, $ Retailers, No. Population, No. Car Bike Walk
Urban rich 5.68 92 198 8.84 7 811 78.5 12.7 3.6
Urban poor 5.01 39 798 12.03 9 565 88.0 7.3 1.2
Suburban rich 5.56 91 548 2.34 3 147 87.0 4.1 1.3
Suburban poor 4.88 30 176 4.23 4 159 93.1 3.8 1.3
School and retailer proximity buffers.For 500-, 1000-, and 1500-foot restrictions, both types of proximity buffer policies exhibited
largely the same impacts for density for each town type. We saw the most dramatic density and cost effects in urban poor environments,
which were the most densely populated—by both people and tobacco retailers. For urban poor communities, a 1500-foot-from-schools tobacco sales restriction resulted in a projected 5% increase in costs whereas the same policy in urban rich areas predicted a 3% increase. Conversely, in diffusely populated suburban environments, proximity buffers would see smaller projected impacts on costs.
Multiple policies.Implementation of mul-tiple or multifaceted policies in the model resulted in the largest density reductions and the largest overall cost increases. Interestingly, a set of multiple policies at moderate in-tensities topped out at about a 6% increase in costs for suburban rich and urban poor communities. The moderate set of policies cut the density“disparity”across town types in half, from about 5 to 1 to about 2.5 to 1. The combined set of high-intensity policies could leave an average of only 1 retailer (or less than 1 in the suburban rich town type) per
TABLE 2—Density Reduction and Cost Increase Results From Tobacco Town Agent-Based Model Runs
Urban Poor Urban Rich Suburban Poor Suburban Rich
Variable Retailer Density Cost, $ % Increase Retailer Density Cost, $ % Increase Retailer Density Cost, $ % Increase Retailer Density Cost, $ % Increase
Baseline 12.03 5.01 . . . 8.84 5.68 . . . 4.23 4.88 . . . 2.34 5.56 . . .
Retailer cap
90% 10.83 5.03 0.27 7.97 5.69 0.29 3.81 4.90 0.27 2.11 5.59 0.62
80% 9.62 5.05 0.68 7.08 5.73 0.85 3.38 4.94 1.15 1.88 5.61 1.05
70% 8.42 5.06 1.00 6.19 5.74 1.08 2.96 4.98 1.85 1.64 5.68 2.28
60% 7.21 5.09 1.55 5.30 5.77 1.69 2.53 4.99 2.26 1.41 5.81 4.55
50% 6.03 5.12 2.22 4.45 5.81 2.27 2.14 5.05 3.44 1.20 5.94 6.99
School buffer
500 ft 11.27 5.03 0.31 8.38 5.68 0.11 4.13 4.89 0.12 2.31 5.58 0.46
1000 ft 6.75 5.10 1.76 6.05 5.73 1.00 3.48 4.93 0.90 2.02 5.61 0.89
1500 ft 3.23 5.26 4.99 3.60 5.86 3.14 2.73 4.99 2.15 1.72 5.67 2.09
Retailer proximity
500 ft 11.06 5.02 0.23 8.24 5.69 0.18 4.10 4.89 0.03 2.30 5.56 0.15
1000 ft 6.36 5.12 2.25 5.38 5.76 1.50 3.23 4.94 1.14 1.99 5.67 2.13
1500 ft 3.55 5.25 4.80 3.29 5.87 3.42 2.46 5.02 2.75 1.67 5.73 3.10
Store type sales ban
Pharmacies 10.65 5.08 1.41 7.92 5.70 0.45 3.81 4.91 0.55 2.07 5.64 1.47
Convenience 5.60 5.10 1.68 4.02 5.76 1.53 1.97 5.24 7.25 1.08 6.06 8.99
Multiple policies
Moderatea 3.81 5.30 5.84 3.74 5.86 3.27 2.40 4.96 1.59 1.52 5.86 5.53
Highb 1.11 5.57 11.08 1.15 6.09 7.21 1.01 5.41 10.67 0.72 6.49 16.79
Notes.Each row represents the average result of 40 model runs. Density is number of retailers per square mile; cost values are scaled as average per-pack costs including purchase price and time and travel costs.
aModerate intensity = 75% cap, 1000-foot school and retailer buffers, pharmacy sales ban.
bHigh intensity = 50% cap, 1500-foot school and retailer buffers, convenience store sales ban.
square mile. For all types except urban rich communities, the set of high-intensity poli-cies predicted cost increases of more than 10%, and the expected cost increase for suburban rich communities was 17%.
We conducted an additional set of model runs by using a more realistic“2-phase”decision rule,33in which agents decided from which retailer to purchase tobacco products after ruling out some retailers on the basis of maximum acceptable price, maximum acceptable distance, or type of retailer. Both density reduction and cost increase results showed very similar patterns to the main model runs (see Table B-1 and Figure B-1 in Appendix B, available as a sup-plement to the online version of this article at http://www.ajph.org).
DISCUSSION
Communities around the United States are implementing a variety of policies to reduce
the retail availability of tobacco products.34 Despite these efforts, we still know little about how the underlying mechanisms of these policies drive down density, increase search costs, and affect price. In this study we used the Tobacco Town agent-based model to reveal important differences in potential policy impacts, both between policies and across town types. In a context in which real-time reduction can take years to evaluate, research informed by agent-based modeling is especially important to identify the most potent policies and to defend against in-creasing tobacco industry opposition to any and all forms of retailer reduction policies.
Contextual Policy Effects
The relationship between retailer density and cost is less straightforward than one might assume. Retailer density reduction exhibits a threshold effect on total cost of acquiring cigarettes; as retailer density decreases, the
overall travel plus purchase costs increase modestly up to a point (around 3 retailers per square mile) and then begin to increase more dramatically as the concentration of retailers continues to diminish. That is, retailer den-sities must be reduced dramatically before large cost effects are seen. This suggests that the impacts of retailer reduction policies are likely to vary on the basis of the retailer density starting points.
For example, in New York City, where retailer density is 31 retailers per square mile,35 it would take a dramatic 87% reduction in tobacco retailers to reduce retailers to fewer than 4 per square mile. Conversely, in the city of St Louis, Missouri, it would require only a 35% reduction to reach the same goal.36 More densely populated areas tend to have more tobacco retailers, and similar relative reductions in density (e.g., 20%) may not have an impact on total costs as markedly as the same reduction in a less populated area. In addition, existing income differentials 0
1 2 3 4 5 6 7 8 9 10 11 12 13 14 15 16 17 18
P
e
rc
entage
Retailer Buffer, ft School Buffer, ft Retailer Cap, % Store Type Sales Ban Multiple Policies 500 1000 1500 500 1000 1500 90 80 70 60 50 Drug Convenience Moderate High
Urban poor
Urban rich
Suburban poor
Suburban rich
between similarly populated and urbanized communities (e.g., suburban rich vs suburban poor) result in distinct impacts from the same policy.
Strength of Individual and
Combined Policy Effects
As one might expect, a policy that caps the number of tobacco retailers at 50% of the existing total exhibits larger impacts (on re-tailer density and cost) than one that caps the number only at 90% of the status quo. However, implementation of multiple policies—even at lower, more politically palatable intensities—can decrease tobacco retailer density and increase costs more than a single policy at a higher, or its highest feasible intensity.
Public Health Implications
The Tobacco Town agent-based model suggests that, especially for dense, urban en-vironments, modest reductions in tobacco retailer density may simply not lead to
“noticeable”environmental changes that translate into public health benefits. More dramatic reductions in density may be re-quired before consumers would either have to search longer for tobacco products or be willing to pay more for tobacco.26This has implications for communities that are con-sidering many different policy options. For example, in our model, a 500-foot buffer around schools only resulted in a density reduction of 1% to 2% for suburban settings, and essentially no increased search costs. Even in urban settings, the modest 500-foot buffer only reduced density by around 5% to 8%. In other words, these policies may only remove half a dozen retailers out of every 100. Al-though stronger policies, or multiple policies in combination, are needed for density re-duction, maximizing the distance from to-bacco retailers to schools serves other public health priorities, such as limiting young people’s exposure to retail tobacco marketing.
Ourfindings also suggest that there is not a“one sizefits all”retailer reduction policy. These effects of different mechanisms (e.g., buffers vs store type restrictions) vary according to town type. This has important health disparities implications: places that need retailer reduction policies the most
(i.e., lower-income urban communities) would benefit from policies that are specif-ically tailored to eliminate those inequities. For example, San Francisco’s policy estab-lished a cap at the lowest number of retailers across all administrative districts, explicitly aiming to eliminate existing density dispar-ities. Other simulations suggest that imple-menting bans on retailers near schools may reduce disparities across diverse communi-ties.37,38Finally, our results are consistent with the Centers for Disease Control and Prevention’s decades-long push for com-prehensive policy approaches to tobacco control.39Communities are far more likely to see public health benefits if they combine multiple retailer reduction strategies with strong traditional tobacco control efforts, rather than relying on 1 policy to do everything.
It is useful to keep in mind a number of important limitations of this study. As with any agent-based model, it is based on a set of abstractions (e.g., 4 town types, average commute times) that make it important to avoid overgeneralizing to real towns, real behavior, and real policies.40However, that abstraction allows us to focus on a smaller set of agent behaviors and agent–environment interactions that help to reveal underlying policy mechanisms and behavioral dynamics that themselves have important policy implications.41
For similar reasons, it is important not to interpret the Tobacco Town cost outcome variable as being indicative of real-world costs. Rather, the cost outcome is a metric that captures both search and purchase costs, and is sensitive to policy and environmental changes in a way that allows us to connect the model results to our interpretations of what a successful retailer density reduction policy is meant to accomplish (i.e., make it less con-venient and more expensive to obtain to-bacco products). By focusing on search and acquisition costs, the modeling did not take into account other ancillary benefits of retailer reduction, such as decreasing exposure to retail tobacco marketing and denormalizing tobacco use. Indeed, the initial version of the Tobacco Town model presented here is just thefirst phase in a planned program of study using computational modeling to explore the benefits of policy solutions to chronic disease challenges.
Communities may implement model policies to reduce tobacco retailer density, but their effects will always play out differently. Such policies will change individual neigh-borhoods, making tobacco products less convenient and more costly to obtain for the people who live and work in those neigh-borhoods. Tobacco Town suggests to us that these policies may reduce the burden of to-bacco in individual communities, but these benefits are more likely to be seen if the policies start out strong, are implemented in conjunction with other effective retailer policies, and are designed to take into account the specific characteristics of those communities.
CONTRIBUTORS
D. A. Luke originated and supervised the study. R. A. Hammond conceptualized and supervised the modeling. T. Combs supervised data collection and analysis. A. Sorg conducted data analysis. M. Kasman designed and grammed the model. A. Mack-Crane did model pro-gramming. K. M. Ribisl and L. Henriksen provided policy data and article feedback. All authors contributed to article development.
ACKNOWLEDGMENTS
Funding for this study was provided by grants R21CA172938, A Retail Policy Laboratory: Modeling Impact of Retailer Reduction on Tobacco Use, and U01 CA154281, the National Cancer Institute’s State and Community Tobacco Control Initiative.
The authors would also like to acknowledge the im-portant contributions of Doneisha Bohannon who helped with data collection and analysis in the early stages of the project, and Elizabeth Bruch who helped inform our thinking about agent decision rules.
Note.The funders had no involvement in the study design, collection, analysis, writing, or interpretation. K. M. Ribisl is the chair of the board of directors of Counter Tools (http://countertools.org), a nonprofit from which he receives compensation. Counter Tools provides technical assistance on point-of-sale tobacco control issues and distributes store mapping and store audit tools. K. M. Ribisl also has a royalty interest in a store mapping and audit system owned by the University of North Carolina at Chapel Hill, but these systems were not used in this study.
HUMAN PARTICIPANT PROTECTION
This research included no human participants. We re-ceived exempt status from the Washington University Human Research Protection Office.
REFERENCES
1. Brownson RC, Haire-Joshu D, Luke DA. Shaping the context of health: a review of environmental and policy approaches in the prevention of chronic diseases.Annu Rev Public Health. 2006;27:341–370.
2. Ashe M, Jernigan D, Kline R, Galaz R. Land use planning and the control of alcohol, tobacco,firearms, and fast food restaurants.Am J Public Health. 2003;93(9): 1404–1408.
4. Hoefges M. Protecting tobacco advertising under the commercial speech doctrine: the Constitutional impact of Lorillard Tobacco Co.Commun Law Policy.2003;8(3): 267–311.
5. Lange T, Hoefges M, Ribisl KM. Regulating tobacco product advertising and promotions in the retail envi-ronment: a roadmap for states and localities.J Law Med Ethics. 2015;43(4):878–896.
6. Ackerman A, Etow A, Bartel S, Ribisl KM. Reducing the density and number of tobacco retailers: policy so-lutions and legal issues.Nicotine Tob Res.2016; Epub ahead of print.
7. Institute of Medicine.Ending the Tobacco Problem: A Blueprint for the Nation. Washington, DC: The National Academies Press; 2007.
8. National Research Council and Institute of Medicine.
Reducing Underage Drinking: A Collective Responsibility. Washington, DC: The National Academies Press; 2004.
9. Schneider JE, Reid RJ, Peterson NA, Lowe JB, Hughey J. Tobacco outlet density and demographics at the tract level of analysis in Iowa: implications for envi-ronmentally based prevention initiatives.Prev Sci.2005; 6(4):319–325.
10. Schleicher NC, Johnson TO, Fortmann SP, Henriksen L. Tobacco outlet density near home and school: associations with smoking and norms among US teens.Prev Med. 2016;91:287–293.
11. Sanders-Jackson A, Parikh NM, Schleicher NC, Fortmann SP, Henriksen L. Convenience store visits by US adolescents: rationale for healthier retail environ-ments.Health Place. 2015;34:63–66.
12. McCarthy WJ, Mistry R, Lu Y, Patel M, Zheng H, Dietsch B. Density of tobacco retailers near schools: effects on tobacco use among students.Am J Public Health. 2009; 99(11):2006–2013.
13. Chuang YC, Cubbin C, Ahn D, Winkleby MA. Effects of neighbourhood socioeconomic status and convenience store concentration on individual level smoking.J Epidemiol Community Health. 2005;59(7): 568–573.
14. Centers for Disease Control and Prevention. State Tobacco Activities Tracking and Evaluation (STATE) System. 2016. Available at: https://www.cdc.gov/ statesystem. Accessed June 15, 2016.
15.Reducing Tobacco Retail Density in San Francisco: A Case Study. San Francisco, CA: Bright Research Group for the San Francisco Tobacco-Free Project; 2016.
16. Counter Tobacco. Flavored tobacco products. 2016. Available at: http://countertobacco.org/resources-tools/ evidence-summaries/flavored-tobacco-products. Accessed October 27, 2016.
17. Homer JB, Hirsch GB. System dynamics modeling for public health: background and opportunities.Am J Public Health. 2006;96(3):452–458.
18. Levy DT, Bauer JE, Lee HR. Simulation modeling and tobacco control: creating more robust public health policies.Am J Public Health. 2006;96(3):494–498. 19. Mendez D, Warner KE. Smoking prevalence in 2010: why the Healthy People goal is unattainable.Am J Public Health. 2000;90(3):401–403.
20. Luke DA, Stamatakis KA. Systems science methods in public health: dynamics, networks, and agents.Annu Rev Public Health. 2012;33:357–376.
21. Epstein JM. Modelling to contain pandemics.Nature. 2009;460(7256):687.
22. Hammond RA. Complex systems modeling for obesity research.Prev Chronic Dis. 2009;6(3):A97. 23. Van Wave TW, Scutchfield FD, Honore PA. Recent advances in public health systems research in the United States.Annu Rev Public Health. 2010;31:283–295. 24. Yang Y, Diez-Roux A, Evenson KR, Colabianchi N. Examining the impact of the walking school bus with an agent-based model.Am J Public Health. 2014;104(7): 1196–1203.
25. Golden SD, Farrelly MC, Luke DA, Ribisl KM. Comparing projected impacts of cigarettefloor price and excise tax policies on socioeconomic disparities in smoking.Tob Control. 2016;25(suppl 1):i60–i66. 26. Pearson AL, Cleghorn CL, van der Deen FS, et al. Tobacco retail outlet restrictions: health and cost impacts from multistate life-table modelling in a national pop-ulation.Tob Control. 2016; Epub ahead of print. 27. Institute of Medicine.Assessing the Use of Agent-Based Models for Tobacco Regulation. Washington, DC: The National Academies Press; 2015.
28. Hammond RA. Considerations and best practices in agent-based modeling to inform policy. Commissioned for Institute of Medicine report:Assessing the Use of Agent-Based Models for Tobacco Regulation. Washington, DC: The National Academies Press; 2015.
29. North MJ, Collier NT, Ozik J, et al. Complex adaptive systems modeling with Repast Simphony.
Complex Adaptive Syst Modeling.2013;1(1):3. 30. Luke DA. Getting the big picture in community science: methods that capture context.Am J Community Psychol. 2005;35(3–4):185–200.
31. Ormerod P, Rosewell B. Validation and verification of agent-based models in the social sciences. In: Squazzoni F, ed.Epistemological Aspects of Computer Simulation in the Social Sciences. Vol. 5466. Berlin, Germany: Springer; 2009: 130–140.
32. Henriksen L, Schleicher NC, Barker DC, Liu Y, Chaloupka FJ. Prices for tobacco and nontobacco products in pharmacies versus other stores: results from retail marketing surveillance in California and in the United States.Am J Public Health. 2016;106(10): 1858–1864.
33. Bruch E, Feinberg F. Decision making processes in social contexts.Annu Rev Sociol. In press.
34. Luke DA, Sorg AA, Combs T, et al. Tobacco retail policy landscape: a longitudinal survey of US states.Tob Control. 2016;25(suppl 1):i44–i51.
35. NYC Smoke-Free, Public Health Solutions. Tobacco proliferation. Available at: http://nycsmokefree.org/ issues/tobacco-proliferation. Accessed March 6, 2015.
36. Luke DA, Ribisl KM, Smith C, Sorg AA. Family Smoking Prevention and Tobacco Control Act: banning outdoor tobacco advertising near schools and play-grounds.Am J Prev Med. 2011;40(3):295–302. 37. Ribisl KM, Luke DA, Bohannon DL, Sorg AA, Moreland-Russell S. Reducing disparities in tobacco retailer density by banning tobacco product sales near schools.Nicotine Tob Res.2016; Epub ahead of print. 38. Ribisl KM, Luke DA, Henriksen L. The case for a concerted push to reduce place-based disparities in smoking-related cancers.JAMA Intern Med. 2016; 176(12):1799–1800.
39.Best Practices for Comprehensive Tobacco Control Programs—2014. Atlanta, GA: Centers for Disease Control and Prevention, National Center for Chronic
Disease Prevention and Health Promotion, Office on Smoking and Health; 2014.
40. Janssen MA, Ostrom E. Empirically based, agent-based models.Ecol Soc.2006;11(2):37.