TRIPARTITE REDISTRICTING CARTELS AND OVERLAPPING AMBITION
John A. Curiel
A dissertation submitted to the faculty at the University of North Carolina at Chapel Hill in partial fulfillment of the requirements for the degree of Doctor of Philosophy in the
Department of Political Science in the College of Arts and Sciences.
Chapel Hill 2019
Approved by:
Jason M. Roberts
Christopher C. Clark
Santiago Olivella
Sarah A. Treul
c
2019
John A. Curiel
ABSTRACT
John A. Curiel: Tripartite Redistricting Cartels and Overlapping Ambition
(Under the direction of Jason M. Roberts)
In this dissertation, I seek to answer the following questions in relation to party strength
and redistricting: (1) how can we better measure sources of party organizational strength over
time; (2) how do the three legs of the tripartite structure reinforce each other (3) why do some
state legislatures lose their power to redistrict; and (4) how can districts be drawn to influence
who runs successfully for higher office. First, I offer two new measures of party strength, one
for organizations and one for party competition. These new measures, the weighted funds
party campaign committees have on hand and the marginal majority measurement (MMM)
provide improved measures of party stability and capacity over time. I then demonstrate
in regards to the second question that while increased competition can strengthen party
organizations, increased polarization can displace organizational strength.
Third, I posit that redistricting is a collective action problem, with too many self interested
legislators amidst a complex technical issue. Only though decreasing the time necessary to
deliberate and avoid common redistricting pitfalls via strong party leadership can the state
legislature hold onto redistricting authority.
Finally, I argue that whether a legislator runs for office is very dependent upon where
districts are drawn, as legislators can carry over their incumbency advantage via shared
constituencies between multiple levels of districts.
To support these chapters, I employ time series and multistage survival modeling of party
ACKNOWLEDGMENTS
I am deeply indebted to everyone who aided me on my journey to earn my dissertation. I
would first like to thank my original advisor, Thomas Carsey, who passed away from ALS in
February of 2018. He is the one who was there to start me down the path of methodology
and state politics when I first started graduate school. He additionally read the roughest of
my work, and was always willing to meet with me, even when he was diagnosed with ALS.
Up until the night before he passed away, he always did his best to ensure that I walked
down the right path, and stopped using so many extended metaphors.
I also would like to thank my current advisor, Jason Roberts, who immediately took up
the role of dissertation adviser after Tom passed away. Things were tough following his death,
and it was a great relief to have Jason leading my committee, and doing what he could to
ensure that I was placed after graduating.
Christopher Clark additionally deserves many accolades, as he read some of my earliest
and roughest work as I was developing my ideas into a dissertation. He also provided a
wealth of feedback for all of the latter drafts in regards to state politics.
Santiago Olivella similarly aided in helping me polish up some of my rougher
method-ological skills and caught some of the earlier errors within my work. Santiago managed to
help despite the fact that he is the most sought after source of methodological knowledge
and always has a line outside his door. The fact that he has the patience and desire to help
so many, myself included, speaks to his generosity and quality as a person and scholar.
of my committee very late in the defense process. Despite the fact that I requested their aid
very late in the process, they jumped on the opportunity and provided very useful feedback
at every turn. Marc and Sarah provided great help especially in adding the final touches and
correct framing necessary to get out my work for publication.
Beyond my committee, I also thank my friends Devin Christensen and Jacob Smith.
Talking to them and destressing over coffee and pints helped me survive through the graduate
school in general, and both acted as first readers for all of my articles. Their generosity
probably took years off of their lives, so I am forever indebted to them. My friend and
coauthor Tyler Steelman proved a constant source of stimulating conversation and pillar of
support through some of the darkest days of graduate school, and was always there when I
needed him. His unique perspective on politics and life also led to a research agenda that
will likely never be exhausted.
I finally wish to thank everyone graduate student in the program. Each and everyone of
you tolerated my eccentricities (i.e. long conversations about how one would ride a whale)
and me taking over the office with pictures of hedgehogs. You all made my time at UNC a
great one. Please note that everything good about my work is due to the help of my friends
and colleagues, and any faults are my own. I will never be able to offer enough gratitude for
TABLE OF CONTENTS
LIST OF FIGURES . . . x
LIST OF TABLES . . . xi
CHAPTER 1: INTRODUCTION . . . 1
State Tripartite Structures and Representation . . . 4
Measuring the Tripartite Structure and the Hydraulic Framework . . 11
Obstacles and Outcomes of Legislative Redistricting . . . 14
Overlapping Ambition for Higher Office . . . 16
Contributions to the Field . . . 19
CHAPTER 2: FINANCING STATE PARTY CARTELS . . . 21
I Tripartite Structure and Interdependence . . . 25
II Financing Party Organizations in the Modern Era . . . 26
ii Party Organization Structure and Role in the Party Network . . . 28
III Determinants of Party Committee Investment . . . 35
iii State Competition for Majority Control . . . 37
iii Benefits of Access to Party Leadership . . . 39
iii Ideology at the Expense of Pragmatism . . . 40
IV Data and Methods . . . 41
iv Controls . . . 47
V Results . . . 48
v Marginal Majorities . . . 50
v Analysis of Determinants of Donations to Party Committee . . . 55
VI Discussion and Conclusions . . . 59
CHAPTER 3: HAZARDS AND OBSTACLES OF REDISTRICTING . . 65
I Legislative Time Limits and Ticking Clocks . . . 68
II The New Balance of Redistricting Power . . . 72
III Data and Methods . . . 83
IV Results . . . 94
V Discussion . . . 104
CHAPTER 4: OVERLAPPING LEGISLATIVE AMBITION . . . 109
I State Legislative Ambitions for the U.S. House . . . 111
II District Overlap and Progressive Ambition . . . 113
III Data and Methods . . . 118
iii Measuring Relative Constituency Overlap . . . 120
IV Results . . . 126
V Discussion and Conclusion . . . 130
CHAPTER 5: CONCLUDING REMARKS . . . 134
What Have We Learned? . . . 135
Limits of the Current Research and Avenues for Future Research . . 139
Final Normative Comments and Applications . . . 140
APPENDIX A: . . . 142
II Chapter 3 . . . 144
III Chapter 4 . . . 144
LIST OF FIGURES
1.1 Michigan’s 11th congressional District Overlap with State Senate Districts . 18
2.1 Model of Multilayered Political Parties . . . 34
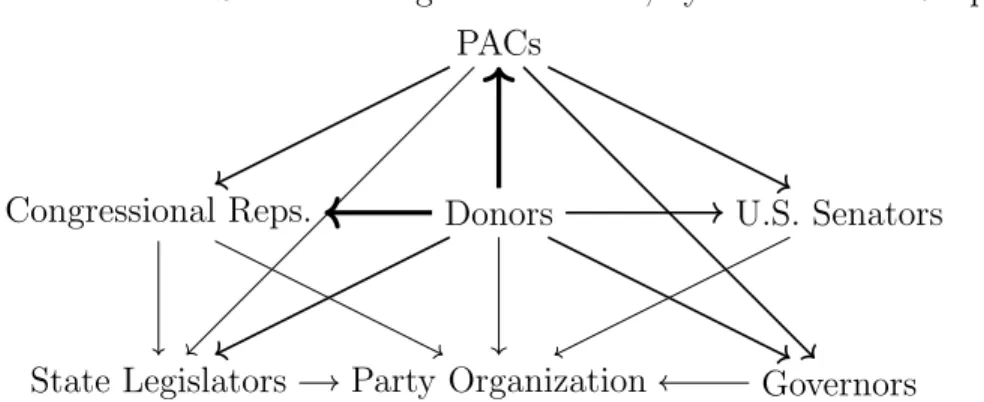
2.2 Model of State Funding Environment, by Donors and Recipients . . . 37
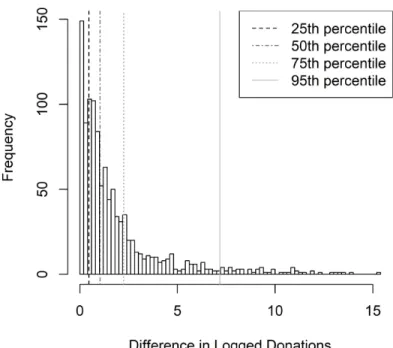
2.3 Distribution of Differences in Donations to Party Committees . . . 49
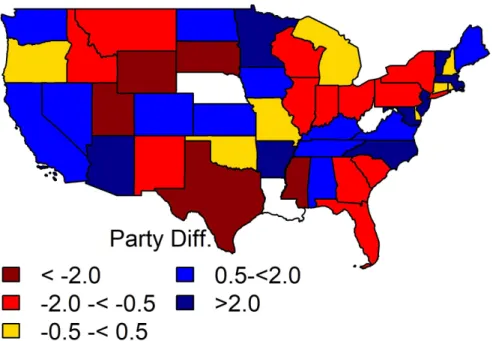
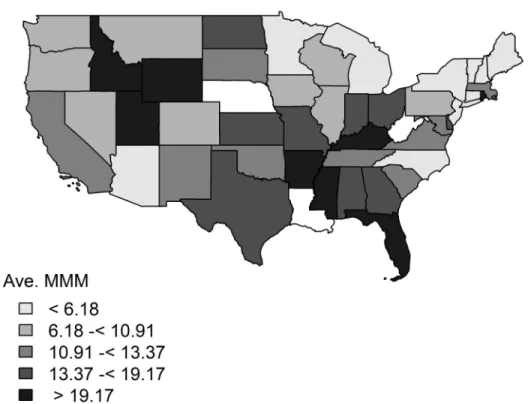
2.4 Map of Difference in Weighted Donations by Party, 2002–2010 . . . 51
2.5 North Carolina State Party Committee Receipts per Capita, 2002–2010 . . . 52
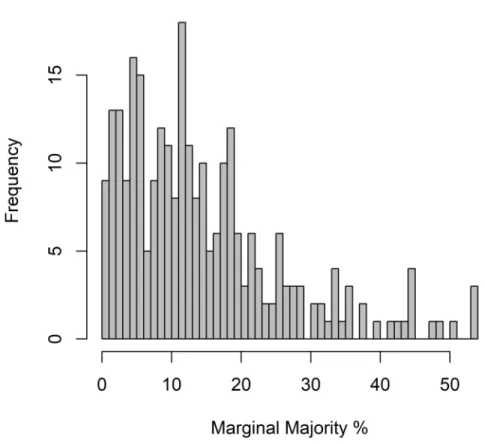
2.6 Distribution of the Marginal Majority Measurement (MMM), 2002–2010 . . 53
2.7 Distribution of the Marginal Majority Measurement (MMM), 2002–2010 . . 54
2.8 Predicted Impact of Marginal Majorities on Party Donations per capita . . . 57
2.9 Predicted Impact of Legislative Polarization on Party Donations . . . 59
3.1 Distribution of Days Redistricting . . . 87
3.2 Non-Legislative Created Maps and Levels of Competition . . . 95
3.3 Probability that a Court Redistricts By Majority Stability . . . 99
3.4 Probability that Non-Legislative Bodies Redistrict . . . 100
3.5 Change in Marginal Majority Strength Given Polarization . . . 102
3.6 Estimated Change in the HVD by Probability that a Court Redistricts . . . 103
4.1 Illustration of Population Overlap Computation . . . 121
LIST OF TABLES
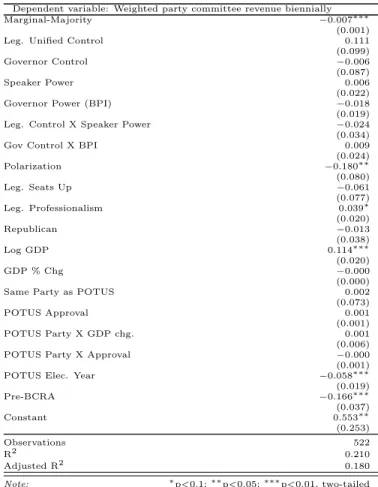
2.1 OLS Regression on Weighted Donations to Party Committees . . . 56
3.1 Bias in Congressional Maps by Redistricting Body . . . 72
3.2 Legislative Redistricting . . . 86
3.3 Multistage Models of Redistricting Risk . . . 97
4.1 Decision to Run for Higher Office Outcomes . . . 126
4.2 Multistage Models of Progressive Ambition for Higher Office . . . 128
A.1 Confirmatory Factor Analysis Estimates . . . 142
A.2 Summary Statistics of Variables, 2002–2010 . . . 143
A.3 Descriptive Statistics of Variables . . . 144
A.4 Non-Multistage Linear Models of Level Legislative Competition . . . 145
A.6 Summary Statistics . . . 146
CHAPTER 1: INTRODUCTION
Parties serve as the primary entry and end point to American political representation.
As formulated by Key (1958), political parties can be viewed as three component parts:
party in the electorate, party in government, and the party organization. Party identifiers
within the electorate select their preferred candidates in the primary stage and vote as a
general electorate during the general election, shaping the party in government. The party in
government aims to enact policies necessary to hold onto power, enjoy the goods of office (Cox
and McCubbins, 2005) and possibly advance legislation in line with their base’s preferences
(Rohde, 1991; Aldrich, 1995). Finally, party organizations largely link together the electorate
with office holders, maintaining the electoral viability of the party through the organization
of voters and recruitment/support of candidates for higher office (Cotter et al., 1989; Key,
1958; Hernson, 2009). As Schattschneider (1942) notes, “[D]emocracy is unthinkable save
in terms of parties.” Additionally, it is through state parties and their tripartite structure
that to varying degrees mediate the selection of office holders at the state and national level.
States provide the confines for political conflict at the state level, and provide the nexus for
multilevel political conflict.
Therefore, it is concerning that political parties within the states appear to be in a state
of disarray in maintaining their responsibility as a linkage institution and means to organize
social conflict necessary to govern efficiently. State parties in government are increasingly
polarized (Shor and McCarty, 2011), with more rigid unity and procedural power (Aldrich
Phillips and Muckler, 2012). The party electorate, as organized into districts, increasingly are
placed into constituencies where electoral responsiveness largely trends downwards (Shufeldt
and Flavin, 2012; McGann et al., 2016; Engstrom, 2013), with institutions structured to give
disproportionate weight to the primary electorate and ideologically extreme candidates (Krasa
and Polborn, 2018; Banda, Carsey and Curiel, 2019). Additionally, more ideological actors
increasingly displace party organizations, providing increased polarization, and thwarting the
mechanisms behind the recruitment for competitive candidates and races (La Raja, 2008;
La Raja and Schaffner, 2015). Insofar as parties diverge from their traditional responsibilities,
roles, and sources of strength, politics across the United States and ensuing representation are
at stake. Given that state politics in turn shape who makes it to national office (Carson et al.,
2011, 2012; Berkman, 1994), and the capacity and actions of local politics (Miller, 2008), it is
imperative to measure and understand the direction of state parties and the implications on
policy outcomes.
However, the sources of party strength and behavior are multifaceted and complex. The
poor performance of a pillar of party strength in one area can feed into the next over time,
collapsing the entire structure. Political parties shape, especially within the legislature, their
own procedures and institutions (Smith, 2007; Roberts, 2010; Roberts and Smith, 2003;
Aldrich, 2011; Mooney, 2012; Anzia and Jackman, 2012; Shepsle and Weingast, 1994), with
the intent to induce outcomes. In turn, the actions of party in government and which party
is in control affects the appeal of political office, which in turn affects who runs for office
(Jacobson, 2004; Fox and Lawless, 2005, 2011). Who runs for office strongly influences which
races are competitive (Jacobson, 1989; Carson, Engstrom and Roberts, 2006; Engstrom
and Kernell, 2005). Whether races are competitive influences the extent to which party
organizations can stake a claim to being necessary for the maintaining party majorities
(Rosenthal, 1995; Gierzynski and Jewell, 1992), and decreased party organization presence
state legislatures within most states can directly affect the extent to which state legislatures
and Congressional offices are competitive (Gelman and King, 1994a; McGann et al., 2016; McDonald and Best, 2015; Levitt, 2010a). Redistricting outcomes and ensuing political competition over a decade in turn shapes policy outcomes (Volden and Wiseman, 2014; Krasa
and Polborn, 2018) and the role of party organizations and organized interests (Daley, 2017;
Skinner, 2007; Skinner, Masket and Dulio, 2013).
Therefore, the task to understand party power over time and the quality of representation
that one receives is a dynamic and multivariate process. This dissertation seeks to further
develop the field of state politics and party strength through the following steps. First,
establish measures of party organizational strength and the intersection of party in government
as related to the tripartite structure. These measures as developed are then employed to
analyze the extent to which the intersection of individualistic motivations and state institutions
shape the power of parties, as framed using the rational hydraulic framework of campaign
finance, which in turn directly affects the capacity of political parties. I next employ these
newly developed measures to explain the bias towards the party in power as mediated through
redistricting. I posit that it is through the power of a strong party organization in combination
with unified government that is able to overcome the obstacles to redistricting, thus preventing
court intervention, which in turn affects who controls legislative and Congressional delegations.
Finally, given the individualistic approach to deciding who runs for office, I demonstrate
how the way in which districts are drawn affects whether and where state legislators run for
higher office, which in turn affects the competitiveness of electoral races at the micro scale.
The ensuing chapters build off our preexisting understanding of parties, redistricting,
and structured progressive ambition with theoretically driven quantitative measures and
multistage time series modeling. The variation over time coupled with advancements in how
one measures the explanatory variables of interest permits these articles to better ascertain
American states.
State Tripartite Structures and Representation
Key (1958) is among the first to establish the importance of the three different legs
of a state party, the party in government, electorate, and organization. The party in the
electorate provides the voting coalition necessary to elect the party in government. The party
in government in turn enacts laws in line with party preferences (Rohde, 1991; Aldrich, 1995)
and/or secures the goods of government while maintaining the party’s reputation necessary
to hold onto power (Cox and McCubbins, 1993; Heberlig and Larson, 2012). The party
organization in turn is responsible, to varying extents, to identify and acquire new voters,
recruit new candidates, and fundraise in order to maintain the organization itself in addition
to electioneering efforts. Each of these legs to party strength are interdependent on each
other. As Key (1949) notes in his studies of the least competitive states during his writing,
the American South, to establish a party organization requires some feasible claim to having
a competitive chance at securing political office. To secure political office requires some
type of party organization and voters in the electorate. Voters in the electorate in turn will
be less likely to turn out and vote in absence of quality candidates with name recognition
(Miller and Stokes, 1962; Jacobson, 1989; Ansolabehere, Brady and Fiorina, 1992; Roberts
and Carson, 2013) or voter outreach efforts (Green, 2004; Ansolabehere and Snyder Jr., 2000;
Broockman, 2014). Therefore, no single part of the tripartite structure can successfully be
analyzed, especially over time, without some consideration to the other components of the
tripartite structure.
Therefore, the field of research on the tripartite structure and its depends upon quality
measures and theoretical mechanism to ascertain its sustainability across time. Should
research into tripartite structures lack macro level measurements of parties across the states,
then a range of obstacles inhibit a wide variety of other potential avenues of research.
government amidst contentious and potentially divisive issues, like redistricting. Further,
given the role of party organizations to recruit and field quality candidates, what are the
mechanisms behind which potential candidates might be encouraged to do so? Further, can
the construction of the electoral environment through redistricting be set up to advantage
or encourage some candidates over others? Should the answers to these questions receive
the affirmative, it would suggest that the research fields of party strength, elections, and
progressive ambition are even more intertwined than previously thought.
Tripartite Structure Research to Date Within state politics, advancements have been made to measure and identify the political implications of party strength and competitiveness.
Ranney (1971) developed the Ranney Index, an average of Democratic control of state
government as calculated via the percentage of seats that Democrats hold within the legislature,
Democratic gubernatorial popular vote percentage, and duration of Democratic unified
control of government. The measure straightforwardly indicates Democratic presence within
government. At the level of legislator competition, Holbrook and Dunk (1993) developed
the HVD index as the average of the average legislator winning percent margin, percent of
uncontested seats, and percentage of safe seats. The HVD index therefore measures the
aggregated average of district level competition, a micro scale measurement.
Measures of party organizations are unfortunately lacking due to the changing nature of
party organizations from when Key (1958) first theorized the tripartite structure. Whereas
at their prime during the Gilded Age most party organizations decided the ideal candidates
to recruit without interference of primaries, ballot design, tracking of loyal versus disloyal
voters and more (Swenson, 1982; Summers, 2004), party organizations lost most of their
powers during the progressive era and the rise of electoral reforms (Roberts and Carson, 2013).
Although scholars such as Cotter et al. (1989) and La Raja (2008) have tracked the pivot
measurements of party organization capacity and sustainability are absent in the research.
La Raja and Schaffner (2015) and Masket (2009) offers in depth research into individual level
support of party organizations versus competing intra party actors, though these estimates
are not readily aggregated into macro level measures of party organizational strength.
Further, the lack of consistent macro-level estimates inhibit research as to how the strength
of one part of the tripartite structure impacts the next. Shufeldt and Flavin (2012) find
the Ranney and HVD indices to operate largely independent of each other, and the Ranney
index itself is prone to measurement problems due to the variability of a state’s gubernatorial
vote and candidate centered effects (Barrilleaux, Holbrook and Langer, 2002; Holbrook and
Dunk, 1993). These measurement problems also lead to complications with studying the
impact of party in government and the electorate effect’s on policy outcomes (Barrilleaux,
Holbrook and Langer, 2002). Therefore, the field of party competition within state politics
cannot effectively test the extent to which state legislative polarization detracts from party
organizations, the extent to which highly competitive states impact capacity of state party
organizations, and more.
Redistricting and Legislative Inaction Amongst one of the most valuable goods of office that a party might be able to attain through a strong organization and electorate
supporting members in office is the opportunity to redistrict. Central to influencing the
competitiveness of the political environment within state legislative and Congressional maps
is redistricting. The manner in which maps are drawn can heavily influence whether parties
win different proportion of districts relative to their support within a state (Gelman and
King, 1994b; Cain, 1985; McDonald and Best, 2015). Through a combination of spreading the opposition across multiple districts via cracking, or forcing the other party’s voters into
one district via packing, the party in charge of redistricting can win a disproportionate
2016). A state might appear competitive when looking at a state’s presidential vote share
statewide, but in reality be drawn in such a way as to make it all but impossible to change
majority control. Although redistricting in the past might systematically benefit one party
or set of incumbents early within a cycle and decay over time (Cox and Katz, 1999, 2002;
Chen and Rodden, 2013), recent maps passed by unified state governments resulted in
partisan bias strong enough to last the entire decade (McGann et al., 2016). The effect of
redistricting can be seen in the 2018 midterm elections, where of the districts that Democrats
won during a wave election, 73 percent were drawn by independent courts or commissions.1
The results of the 2018 election also highlight the importance of who redistricts, with unified party governments overwhelmingly drawing partisan biased maps, and independent court or
commissions maps indistinguishable from no effect (Cox and Katz, 2002).2 Crespin (2005)
finds a strong association between the probability that a Congressional district is competitive
and the presence of a non-legislative drawn map. Carson, Crespin and Williamson (2014)
goes onto reconfirm theses results from 1972–2012.
Therefore, it appears that to know who redistricts is to in part know the extent of bias with
in maps, and therefore which party controls state legislatures and Congressional delegations.
1Michael Li, “Why the Midterm Results Should Concern You Regardless of Which Party You
Support,” Brennan Center for Justice, November 16, 2018, https://www.brennancenter.org/blog/ why-midterm-results-should-concern-you-regardless-which-party-you-support (accessed April 16, 2019).
2Data from (McGann et al., 2016) as to whether a map reaches a systematic partisan bias reveals a significant
difference between state legislatures and courts/commissions drawn maps for Congressional districts. Their early work applying these results to state legislative maps also reveal the same association. See,
Alex Keena, Michael Latner, Charles Anthony Smith, and Anthony McGann, “Here’s how to fix partisan gerrymandering, now that the Supreme Court kicked it back to the states,”
Washing-ton Post Monkey Cage, July 2, 2019 https://www.washingtonpost.com/politics/2019/07/02/
However, with the Supreme Court ruling,Rucho v Common Cause, litigation against partisan gerrymanders was ruled as non-justiciable,3 seemingly locking in partisan biased maps as they
arise. A long standing finding and well justified belief within the redistricting community is
that when a party controls both the governor’s office and state legislature, a highly partisan
biased map will be enacted (Cox and Katz, 1999, 2002; McDonald, 2004). So long as the
legislature meets basic redistricting criteria, such as population equality, and potentially
racial minority representation, the map cannot be overruled (Levitt, 2010a).
However, since the year 2000, courts and independent commissions have redistricted
approximately 20 percent of legislative and Congressional maps where the default redistricting
authority is held by the legislature. The reason for the judicial and other non-legislative
body intervention is due to the state legislature passing maps that fail to adhere to technical
criteria of equal population and/or Voting Rights Act (VRA) criteria in time for elections.
Even the Roberts court accepted the premise that to prevent malapportionment of population
within legislative and Congressional maps, it is the duty of courts to act when the state
legislature does not.4 Therefore, to know when redistricting is to know who redistricts. To
know who redistricts is to know which party has a better hold on power.
Strategic Progressive Ambition and Electoral Institutions Redistricting and party strength within the system of legislative and Congressional elections in large part work through
quality candidates capable of providing voters a meaningful electoral choice. Competitive
elections are a necessary condition for democratic accountability (Pitkin, 1967; Miller and
Stokes, 1962). Party identity largely determines voting patterns, though a voter’s familiarity
318 U.S. 422 (2019)
with a candidate can reduce the overwhelming effect of partisanship (Ansolabehere, Snyder Jr.
and Stewart III, 2000; Ansolabehere, Brady and Fiorina, 1992; Miller and Stokes, 1962).
Whether an electoral challenger can overcome the strength of an incumbent and attain
the name recognition necessary to have a winning chance is their experience as a previous
elected office holder (Cox and Katz, 1996; Ansolabehere, Brady and Fiorina, 1992; Jacobson,
1989; Carson, Engstrom and Roberts, 2006). As Roberts and Carson (2013) find, a large
part of party organizations ability to successfully compete in districts was the ability to
field quality candidates with previous elected office holding experience. Within Congress,
the most common competitor and background for members is a career within their state’s
legislative chambers (Berkman, 1994; Berkman and Eisenstein, 1999). Therefore, insofar
as one can estimate the conditions in which candidates with previous elected office holding
experience, such as state legislators, run for higher office, one can estimate the competitiveness
of elections.
A multitude of factors impact whether one decides to run for higher office. The central
theory behind candidate entry is strategic politician theory, where candidates run for higher
office when the projected utility exceed the opportunity costs (Jacobson and Kernell, 1983).
Whether a candidate desires to run for higher office is affected by their personal ambition, as
some are progressively ambitious and seek higher office when the conditions are ideal to do so
(Schlesinger, 1966), whereas others might be content with their current office and statically
ambitious. Ultimately, to know whether a candidate desires higher office is progressively
ambitious relies upon in depth survey research (Maestas, 2003; Maestas et al., 2006), which is
also susceptible to change depending on changes in life at a given time (Fox and Lawless, 2011).
Therefore, much of the decision to run can be highly individualistic and not captured by
institutional features. Modern day potential candidates can be especially cautious in running
for office given the inability of party organizations to offer insurance should a candidate run
However, if one accepts the base premise of strategic politician theory in that politicians
will await for the most ideal conditions to run for higher office, then one can expect them
to only run when the benefits and probability of victory outweigh the costs (Rohde, 1979).
Of especial interest are state legislators, given that most members of Congress are former
state legislators (Berkman, 1994). Additionally, state legislators work within a variety of
environments and institutions that mediate their potential runs for higher office. Analyzing
the opportunity structure reveals the decision making infrastructure that state legislators
work within. All elected state legislators fall within the category of quality candidates, though
some tend to be better situated than others to handle campaigns. State legislators from
professional legislators tend to be in a strong position to run for higher office, they tend to be
more risk averse towards running given the increased costs of potentially losing (Maestas et al.,
2006; Lazarus, 2006; Fox and Lawless, 2005). Typically state legislators wait for an open
seat viable for their party (Black, 1972; Roberts and Carson, 2013). Candidates might also
take advantage of times in which the congressional incumbent is weak, following redistricting
(Hetherington, Bruce and Globetti, 2003; Cox and Katz, 2002) or when the incumbent no
longer represents the preferences of the median voter (Boatright, 2004; Canes-Wrone, Brady
and Cogan, 2002). State legislators likewise are more likely to run when the utility of their
current seat declines, such as the loss in security incurred following legislative redistricting
(Ansolabehere, Snyder Jr. and Stewart III, 2000) or term limits force them out of office
(Lazarus, 2006).
Previous research on progressive ambition tends to fall within either the candidate or
political environment categories in attempts to measure strengths and weaknesses of the
candidate or political opportunities or threats. However, there is conceptual overlap between
political opportunities and candidate strengths in regards to redistricting. All state legislators
necessarily share some of their constituents within a higher level district. For example,
districts. Where legislators share constituents with a higher level district, there is the
potential opportunity to carry over their strengths as an incumbent. Carson et al. (2011)
finds in a cross sectional study that state legislators with increased overlap with Congressional
districts are more likely to run. Given the nature of strategic ambition, whether, when, and
where a legislator runs for higher office cannot be separated. To understand progressive
ambition requires not only an over time analysis as performed by Maestas et al. (2006) and
Hetherington, Bruce and Globetti (2003), or by location as completed by Carson et al. (2011,
2012), but the intersection of the two in relation to redistricting cycles. A dynamic model of
progressive ambition necessarily unites the time and space to understand whether, when, and
where a legislator runs, which in turn determines level of electoral success and competition.
Measuring the Tripartite Structure and the Hydraulic Framework
Chapter 2 builds upon the work of past research in order to provide three primary benefits
in studies of state party tripartite structures: (1) a means to analyze the strength of party
organizations over time; (2) a macro-level measure that captures the intersection of party
control of government and electoral competition; and (3) an analysis of the extent to which
the competitiveness of legislative control, materialistic appeal of control of state government,
and polarization strengthen or displace the capacity and sustainability of party organizations.
The chapter first takes advantage of the fact that there is unanimous agreement that
modern day state party organizations rely upon high levels of funding so as to maintain
their operations and engage in coordinated expenditures necessary to support candidates
necessary to capturing office, in addition to getting out the vote (Hernson, 2009; Gierzynski
and Jewell, 1992; Jewell and Morehouse, 2001; Rosenthal, 1995; La Raja, 2008; La Raja
and Schaffner, 2015; Masket, 2009; Bibby and Holbrook, 1996; Cotter et al., 1989; Kolodny
and Dulio, 2003). Therefore, although one might not know the exact strength of a party
organization, it is possible to determine the extent to which a party organization meets the
party committees, the modern day and candidate serving organizations that maintain their
party’s outreach efforts, recruitment of new candidates, and spending in competitive elections
(Kolodny and Dulio, 2003). I acquire data on all donations to these state party committees
from the National Institute on Money in State Politics. I then create an aggregate measure of
party organizational capacity for a given party within a state for a two-year period via three
steps. I first aggregate all donations to a given party. I next weight the total donations based
on the breadth of the base for party committees, such that a wide donor base is weighted
closer to one, and a donor base more reliant upon a few individuals a weight of zero. Finally,
the weighted donations are divided by the state’s population. These three steps create a
measure of capacity and stability. Following the work by Banfield and Wilson (1963) into
the death of party machines, a party organization’s downfall is usually marked by if not an
outright loss of resources, then capture by a single interest or individual. Therefore, weighted
funds on hand allows one to both measure capacity of a party in addition to its sustainability
in the event of the loss of the largest donors.
I next capture the measure of competition through the creation of the marginal majority
measurement (MMM), which looks to the percentage of the electorate that would need to
switch their votes in the most marginal districts so as to flip majority control. The measure
builds upon the idea that party organizations would not seek to recruit and support a quality
candidate in every state legislative district, nor improve electoral performance uniformly
across all districts. Rather, a party organization, in addition to other political actors, would
seek to flip the districts necessary to change majority control (Barrilleaux, Holbrook and
Langer, 2002; La Raja and Schaffner, 2015). For example, in 2010 the GOP targeted specific
flip control, and advertised their strategy as a means to attract new donors (Daley, 2017).5
I therefore create the MMM as the total number of the two party vote within the minimum
number of legislative districts that would need to be switched in order to change majority
control within a chamber, divided by the total number of voters within the election. The end
result is a 0 – 1 score of the difficulty in changing majority control, with states near zero
holding very fragile majorities, and states near one as effectively immutable. MMM improves
upon the micro level HVD index which does not give proper weight to how individual elections
affect majority control within the legislature. Additionally, the measure is an improvement
over the Ranney index by discerning how fragile legislative control is based upon micro and
macro level electoral information.6 Additionally, looking to legislative control specifically
frees the measure of the unstable effect of gubernatorial elections (Holbrook and Dunk, 1993;
Shufeldt and Flavin, 2012). Confirmatory factor analysis goes on to confirm the strong
expected effect of MMM against the HVD and Ranney indices insofar as one would seek to
collapse all three measures onto one dimension.
Finally, I build upon the micro level framework of La Raja and Schaffner (2015) and offer
a test of rational campaign finance “hydraulics,” positing that money will flow based upon
5Karl Rove widely advertised the GOP “RED MAP” strategy in his 2010 Wall Street Journal Editorial as a
means to attract new donors. He started out his editorial writing,
“Some of the most important contests this fall will be way down the ballot in communities like Portsmouth, Ohio and West Lafayette, Ind., and neighborhoods like Brushy Creek in Round Rock, Texas, and Murrysville Township in Westmoreland County, Pa. These are state legislative races that will determine who redraws Congressional district lines after this year’s census, a process that could determine which party controls upwards of 20 seats and whether many other seats will be competitive.”
Karl Rove, “The GOP Targets State Legislatures,”wall Street Journal, March 4, 2010,https://www.wsj. com/articles/SB10001424052748703862704575099670689398044(accessed February 27, 2019)
6As Lublin (1997) and Grose (2011) write, pure margins of legislative or Congressional seats might be
the perceived appeal and opportunity costs of political donations. I argue that the appeal
of donations to party committees is influenced largely by the perceived competitiveness of
the state legislature and power of the leadership positions acquired upon winning majority
control. However, I expect polarized legislatures to detract from party organizational strength
as it becomes increasingly appealing to donate instead to more ideological driven interests.
Employing a linear time series panel model from 2000 to 2010, the result support the rational
hydraulic framework of party organizational strength. Therefore, chapter 2 concludes with
two measures to capture the tripartite structure within states and empirical evidence as to
the basis for party organizational strength.
Obstacles and Outcomes of Legislative Redistricting
Chapter three seeks to answer why legislatures fail to enact redistricting in time, and thus
cede their power to non-legislative bodies. I posit that the failure of legislatures to pass maps
in time is a function of the collective action problem and technical barriers to redistricting
that state legislatures face. Even should a party be in control of unified government, the
inability to effectively impose order and socialize the costs of maximizing party control over
legislative and Congressional districts, the legislature is prone to overly long deliberation and
inaction.
Even with advanced computers, it might still take far too long to find an ideal map
that satisfies a sufficient number within the majority party given technical criteria, such as
preservation of local boundaries and population equality. Further, without the means to
centralize and enforce a hierarchy within the map development process, the excess of self
interested legislators all competing for safe seats can detract from completing a map in time,
which in turn results in non-legislative take over of the map making process. I argue that
it is through a strong party organization, which funds a centralized mapmaker and offers
support to legislators who need to accept more competitive districts for the good of the party,
Chapter three offers qualitative and quantitative in support of the argument that technical
criteria and collective action failure lead to an inability of the legislature to redistrict state
legislative and Congressional maps. The chapter first takes advantage of the wealth of insight
into the redistricting process through a combination of interview research, amicus briefs from
redistricting litigation, and the personal notes and presentations of the National Conference
on State Legislatures (NCSL) redistricting expert and GOP redistricting coordinator. These
data offer insight into the complexity of the redistricting process and common obstacles
that must be overcome, in addition to the necessary personnel and organizational structures
necessary to overcome legislative and legal obstacles to redistricting. Additionally, the chapter
employs three stage model, with a two stage survival model, followed by a linear model to
analyze the following within the 2000 and 2010 redistricting cycles: (1) the duration until
redistricting for a given legislative chamber or Congressional map followed by, (2) a competing
risks analysis of whether a non-legislative actor redistricts in place of the legislature, and
finally (3) the impact on a map’s competitiveness as measured with the MMM and HVD
Index. I posit that the main obstacles to redistricting in time takes the form of geographic
requirements to preserve local boundaries and soft deadlines for when maps should be passed,
as required by state law. I argue that given the role of party leaders to spread out the costs
and benefits of various district designs, that unified governments are best able to prevent
non-legislative redistricting when in control of a well funded party committees. Through these
analyses, there appears to be strong support that the timing of redistricting, and in turn
legislative failure to redistrict, can be understood as a technical and collective action problem
that can be overcome with strong institutional party hierarchy. However, the results of the
final stage suggests that the relationship between courts and commissions implementing more
competitive maps might be questionable. Therefore, these contradicting results suggest the
Overlapping Ambition for Higher Office
In chapter four, I argue that when and where a legislator runs for higher office is largely
influenced by their relative strength as a candidate when compared to the incumbent of a
higher level district or the potential competition. A candidate performs their best in running
for higher office through a combination of choosing a race where their name recognition
and reputation within the higher level district is at its maximum, and when the potential
competition is at its weakest. A state legislator that successfully balances their candidate
strengths amongst their current constituency relative to the competition will be more likely
to run for higher office and win. Therefore, to understand the redistricting cycle and where
multiple levels of districts overlap is to understand whether, when, and where a legislator
runs for higher office.
I therefore build upon past work analyzing shared constituency between districts by
Carson et al. (2011) by expanding the range of potential competition to include every other
potential competitor for higher office within the state legislature. Further, I incorporate time
into considerations of the progressive ambition of decisions to run for higher office with a
survival model of whether and when a legislator runs for a particular office. As incorporated
into a two stage model, decision of where to run followed by election performance, the analysis
reveals the extent to which district design over time influences who runs for higher office,
which in turn influences the competitiveness of a given election.
Chapter four conceptualizes that constituencies matter to running for higher office only
insofar as they are not wasted against someone with a greater presence within the district.
Most obviously, the incumbent for a higher level district would hold the greatest name
recognition within their own district. An incumbent would be weaker purely on the dimension
competition share the exact same constituency.7 In the event that no incumbent runs for
office, then some legislator from a lower level district would be in a position to potentially
enjoy the greatest constituency overlap with a higher level district.
Consider the following map of Michigan’s 11th Congressional district. The map displays
Michigan State Senate districts overlapping with the open 11th Congressional district during
the 2002 midterms. All of these districts contained constituents who voted for both the
Congressional and a state senate races. In regards to population overlap and shared
con-stituency, the boundaries of state senate district 9 from the state senate map in place in the
year 2000, had the greatest level of shared constituency. The state senator of senate district
9 from the electoral cycle before shared 37 percent of the Congressional district’s population.
The nearest competitor, the state senator from district 15, shared only 24 percent of the
Congressional district’s population. Ultimately the state senator of district 9 ran uncontested
in the Republican primary and won the general election with 59 percent of the vote in 2002.8
The case of Michigan’s 11th Congressional district exemplifies a process that is part of the
state legislator to Congress career pipeline. However, to fully capture the effects on decisions
to run for higher office therefore requires a better attempt to model and measure the elements
that comprise the decision of whether, where, and when to run.
Chapter four therefore makes use of self-created python toolbox that calculates the
population overlap between state house to state senate, state house to Congress, and state
senate to Congressional districts. The calculated overlap is then transformed for each legislator
7Situations where some other office holder has 100 percent overlap with a higher level district occasionally
happens with California’s state senate to Congressional districts, or single member of Congress states to the U.S. Senate (Rohde, 1979).
8House General Elections, Michigan, 2002-2010 All Districts, Congressional Quarterly Press Voting and
Figure 1.1: Michigan’s 11th congressional District Overlap with State Senate Districts
Map only includes state senate districts from the year 2000 that overlaped with Michigan’s 11th congressional district for the 2002 midterm elections, the first of the new Michigan map in place following the 2000 Census.
Map created using information from the U.S. Census and Lewis et al. (2013) Digital Boundary Definitions of United States congressional Districts, 2003.
into a relative difference from the maximum overlap.The score is transformed into a 0 – 100
scale, where candidates who have a score of zero have the maximum shared constituency
with a district, relative to the incumbent, if present, and all other potential challengers
from legislators. Each one unit increase reflects a one percentage point difference in shared
constituency from the candidate with the most overlap within the district.
With the construction of the relative population overlap variable, chapter four’s competing
reveals relative population overlap to be a strong predictor of decisions to run for higher
office. In combination with changes to an incumbent’s district, relative population overlap
as constructed explains most of the incumbency advantage as measured in prior studies.
However, the ensuing regression on general election outcomes reveals a lack of an effect for
relative population overlap. Therefore, the results suggest that relative population, in large
part decided by redistricting, can provide the ideal conditions to convince a legislator to run
for higher office. Further, by knowing relative population overlap it is possible to ascertain
where a legislator will run for higher office, which in turn leads to more competitive elections.
Contributions to the Field
These following chapters will present the reader greater insight into the dynamics of party
strength and competition over time. Each chapter is united in the mission to analyze and
answer what provides for the conditions necessary for representative democracy as mediated
through parties to function.
Chapter two provides the means to better measure the tripartite structure at the macro
scale. These measurements then offer the means to test the extent to which the legs of the
tripartite structure support each other in a way so as to maintain a balanced two party
system. The results highlight the importance of a competitive electoral environment and
the threat of polarization to strong party organizations. Threats to party organizations in
turn affect the ability for a party to maintain the overall party and support competitive
elections. Further, these results bolster previous work by La Raja and Schaffner (2015), who
find that weak party organizations contribute to greater polarization. These results suggest
that polarization in turn weakens party organizations. Therefore, these results substantively
demonstrate the feedback loop and the poor outlook for party organizational strength in the
future.
Chapter three immediately makes clear the applicability of the new measurements provided
Given that late redistricting is the primary causal mechanism for non-legislative authored
maps, and that non-legislative authored maps provide the plurality of competitive districts
within Congress and state legislatures, it is crucial to understand what drives the process.
The three stage model demonstrates time to be the decisive factor in deciding who redistricts,
and that time to redistrict is based upon the capability of the majority party to centralize
and overcome the technical obstacles to redistricting. However, the lack of results for
court and commissions in changing the competitiveness of maps suggests that the field of
redistricting research and representation needs to carefully consider the means by which
courts or commissions redistrict.
Chapter four builds upon and unites previous work into progressive ambition and
redis-tricting. The results demonstrate the precise means by which redistricting affects who runs
for office by shaping overlapping constituencies between different levels of districts. Further,
the overtime nature of the model combined with a new measurement to better capture
the strategic considerations of potential candidates provide insight into the intersection of
individualistic decision making and political institutions. Given the importance of quality
challengers to competitive elections, these results uncover how micro scale competition can
aggregate up to macro level effects on competition.
Therefore, this dissertation in its three article both improves our measurements of
party strength and competition, in addition to the causal processes that go onto shape
CHAPTER 2: FINANCING STATE PARTY CARTELS
Key (1958) is among the first to establish the importance of the three different legs
of a state party, the party in government, electorate, and organization. The party in the
electorate provides the voting coalition necessary to elect the party in government. The party
in government in turn enacts laws in line with party preferences (Rohde, 1991; Aldrich, 1995)
and/or secures the goods of government while maintaining the party’s reputation necessary
to hold onto power (Cox and McCubbins, 1993; Heberlig and Larson, 2012). The party
organization in turn is responsible, to varying extents, to identify and acquire new voters,
recruit new candidates, and fundraise in order to maintain the organization itself in addition
to electioneering efforts. Each of these legs to party strength are interdependent on each
other. As Key (1949) notes in his studies of the least competitive states during his writing,
the American South, to establish a party organization requires some feasible claim to having
a competitive chance at securing political office. To secure political office requires some
type of party organization and voters in the electorate. Voters in the electorate in turn will
be less likely to turn out and vote in absence of quality candidates with name recognition
(Miller and Stokes, 1962; Jacobson, 1989; Ansolabehere, Brady and Fiorina, 1992; Roberts
and Carson, 2013) or voter outreach efforts (Green, 2004; Ansolabehere and Snyder Jr., 2000;
Broockman, 2014). Therefore, no single part of the tripartite structure can successfully be
analyzed, especially over time, without some consideration to the other components of the
tripartite structure.
party organizations from when Key (1958) first theorized the tripartite structure. Whereas
at their prime during the Gilded Age most party organizations decided the ideal candidates
to recruit without interference of primaries, ballot design, tracking of loyal versus disloyal
voters and more (Swenson, 1982; Summers, 2004), party organizations lost most of their
powers during the progressive era and the rise of electoral reforms (Roberts and Carson, 2013).
Although scholars such as Cotter et al. (1989) and La Raja (2008) have tracked the pivot
to candidate centered campaigns and a supporting role for party organizations, consistent
measurements of party organization capacity and sustainability are absent in the research.
La Raja and Schaffner (2015) and Masket (2009) offers in depth research into individual level
support of party organizations versus competing intra party actors, though these estimates
are not readily aggregated into macro level measures of party organizational strength.
Further, while much work within state politics successfully analyzes party control of
government (Ranney, 1971, 1976) and competition across legislative districts (Shufeldt and
Flavin, 2012; Holbrook and Dunk, 1993), they are not readily interconnected with the
tripartite structure and role of party organizations.
In regards to party organizations, though they lost much of their formal power, they still
play a crucial role in American politics, especially at the state level. In the face of changing
campaign finance laws and candidate centered campaigns, party organizations adapted to
support individual candidates with services in kind, consultants, and decisive ad buys for
marginal seats late during elections (Kolodny and Dwyre, 1998; Kolodny and Dulio, 2003;
Hernson, 2009). Additionally, it is through party organizations that the state and national
parties coordinate to hire redistricting consultants and develop redistricting strategies (Daley,
2017; Chin, 2017). Further, it is largely state party organizations that recruit and train
candidates to run for office (Kolodny and Dulio, 2003). Additionally, it is active recruitment
by party members that acts as one of the primary determinants as to whether one runs for
organizations, they must be very strategic in where they spend, limiting their activities to
marginal seats that have a chance at affecting majority control of the legislature (Rosenthal,
1995; Barrilleaux, Holbrook and Langer, 2002). Therefore, I aver that the field of state
politics must rethink and measure how the tripartite collectively works together, with special
attention given to the measurement and sustainability of party organizations over time.
I therefore develop two new measures to gauge party organizational strength and its
connection with a competitive party electorate. To analyze party organizational strength, I
measure per capita state party campaign committee receipts from 1996 to 2016. To measure
the competitiveness of the state’s elections, I create the marginal majority measurement
(MMM), the percent of the vote that would need to change in order to switch majority control
of the state’s legislature. I argue that to measure the connection between party organizational
strength and the intersection of party in government and electorate via these two measures
offers the means to better unite the field of state politics conceptualization and measurement
of the tripartite structure. Looking to revenues received by state party campaign committees
acts as a valid method to measure party strength given that money is the primary means
by which party organizations can exert influence (Jewell and Morehouse, 2001). Further, a
measure that specifically measures the fragility of majority control offers the macro level
benefits of measures like the Ranney index, yet the precision of the HVD index.
With these new measures, I go onto test the rational hydraulic framework of campaign
finance, and thus party organizational strength. I build upon the framework posited by La Raja
and Schaffner (2015) and formulate that where money accumulates follows both campaign
finance laws and the institutional features that make competing political organizations more
appealing over others, given the motivations of the individual. Where competitiveness and the
benefits of controlling procedural power of leadership positions high, money will accumulate
to party organizations. In turn, where higher levels of polarization and partisan conflict mark
like party organizations. Therefore, states where ideology displaces the pragmatism of party
organizations amidst polarization, donations to party organizations will dwindle.
In order to develop these new measures, I first draw upon donation data from the National
Institute on Money in State Politics to determine the funding for state party committees from
1996 to 2016. I then weight parties both upon total receipts and the broadness of their donor
base using a reverse Herfindahl index weight, divided by the state’s logged population. The
analysis reveals which state party committees are overly reliant on few donors, and therefore
more susceptible to greater fluctuation and control by relatively few political interests. I
next employ the Klarner (2018) Legislative Elections Returns data to determine the most
marginal legislative seats in a given election period, and votes necessary to change election
outcomes per marginal district. I next gauge the impact of the MMM compared to the
Ranney measure of party control of government (Ranney, 1976) and Holbrook-Van Dunken
index of party competition via confirmatory factor analysis. I finally gauge the determinants
of party organizational strength and electoral marginality via a time series panel linear model
from 2000 to 2010.
The results overall support a rational hydraulic framework to party organizational strength.
Party committees draw greater funds within competitive electoral environments. Additionally,
increased polarization within state legislatures detracts from revenue to party committees.
Further, confirmatory factor analysis supports MMM to be a unique and improved measure
of electoral competition relative to the Ranney and HVD index. These results offer several
specific insights into future research into state party tripartite structures. First, the new
weighted measurement of party committee strength can be employed in future time series
research where such a measure was previously missing. Additionally, the analysis reveals how
susceptible party organizations are to inescapable downward spirals of loss in influence due
to runaway polarization and bias in redistricting. Further, insofar as one seeks to measure a
electorate and government, the MMM offers a more accurate and simplified measurement of
how fragile party control is of legislative chambers. Finally, given that these results confirm a
negative spiral between polarization and party organizational strength, future research might
go onto specifically analyze the organizations directly displacing party organizations. Though
the tripartite structure will likely continue to be the best means to conceptualize parties,
party organizations might again undergo another evolution in their structure, purpose, and
connection to the rest of the party.
I
Tripartite Structure and Interdependence
Parties highly depend upon each component part working together in order to viably
compete for power. Different political actors might be motivated by materialistic gain (Olson,
1965), or expression of identity and ideology (Hansen, 1985), though all parties ultimately
must acquire public office to maximize their end goals (Epstein, 1980; Wray, 1981). Whereas
those in public office might seek the position itself for influence in government (Mayhew,
1974; Fenno, 1978), or their party’s control and good policy as framed by their ideologies
(Mayhew, 1974; Aldrich, 1995; Rohde, 1991; Cox and McCubbins, 1993), it is a necessary
condition to win public office through elections. Given position taking by parties and the
need to organize different groups of voters unified by a collective brand, cohesive parties need
to be able to coordinate the electorate with party in government. Failure to do so might
result in situations where the party is not able to capitalize on favorable electoral conditions
(Roberts, Smith and Treul, 2016) or minimize losses during unfavorable years (Rosenthal,
1995).
Relatedly, without a competitive electoral environment it is difficult to build up a cohesive
party in government or organization. A competitive electoral environment acts to provide a
sense of collective threat to unify the party (Lee, 2009; Cox and McCubbins, 2005; Smith,
in government to adopt cohesive policy stances (Key, 1958, 1949; Strom, 1990; Riker, 1962),
or act on policy goals (Barrilleaux, Holbrook and Langer, 2002). A party organization
without a claim to being necessary to ensure party majority control might likewise seem
as an unnecessary investment, as happened in the non-competitive Democratic Solid South
(Key, 1949; Bibby and Holbrook, 1996). In turn, a party in government without some type of
longterm voting coalition and shared identity will not be able to establish the party brand
and institutions necessary to keep the party viable (Aldrich, 1995; Aldrich and Battista, 2002;
Lee, 2009; Cox and McCubbins, 2005; Smith, 2007).
The tripartite structure is therefore highly interdependent and endogenous. To understand
the strength of one component requires an understanding and analysis of the other two. Of
the three components of the tripartite structure, however, party organizations have undergone
some of the most debilitating changes and transformations from their inception and zenith. To
not understand and measure the party organization, therefore, is to leave out both knowledge
of organizations and how they relate to party in government and the electorate, all of which
go onto shape electoral competition and accountability.
II
Financing Party Organizations in the Modern Era
Modern day American state party organizations lack the type of resources and stature
once enjoyed during their prime. State party organizations once mobilized and coordinated
all campaigns within the state, chose their party’s candidates, printed out ballots, controlled
access to government jobs, and enjoyed far more authority than the national level party
organization (Heard, 1960; Key, 1958). However, progressive era reforms in ballot access,
primaries, civil service, and campaign finance effectively ended the sources of power and
meaningful variation in state party organizational strength (Mayhew, 1986; La Raja, 2008;
Cotter et al., 1989). Therefore, it is not possible to judge and measure the strength of state
State party organizations in the modern era primarily exist to service the party in
government, and engage in candidate service and party building activities. State party
organizations within their far more limited role now have the duty to train and recruit new
talent into the party, register voters, conduct voter outreach in the form of door-to-door
canvassing and direct mail, and identify upcoming campaign issues with polls (Bibby and
Holbrook, 1996).
Cotter et al. (1989) performed the most in depth study of state party organizational
strength from their nadir to regrowth during the 1980s. In their interviews with state party
committee organizational leaders, his responses reveal three primary dimensions which party
organizational strength relies upon: quality of services offered to candidates, recruitment of
new candidates, and maintenance of its own bureaucracy. La Raja (2008) confirms these
features of party strength hold up in the 2000s, and finds that state party organizations focus
far more on these features of party maintenance than other activities, such as media ad buys
(190–1).1 For example, La Raja (2008) found Democratic party committees spent
approxi-mately 35 percent of all expenditures on grassroots mobilization in 2004, and Republicans
approximately 36 percent (184).
As La Raja (2008) notes, large campaign funds and plentiful donations are not a sufficient
condition for a strong party organization (188–9). However, a constant stream of revenue
to state party organizations do amount to a necessary condition for state party strength
given that there are no other avenues in the present day for parties to conduct party
maintenance activities. Jewell and Morehouse (2001) note that as of the late 1990s, the
1La Raja (2008) finds an upsurge of state party committee expenditures during the 2000 presidential election
single most important role of party organizations is to “[R]aise enough money to maintain
the headquarters and to pay for the functions that state parties should be carrying out” (50).
Therefore, state party organization committees strength can in large part be determined
based upon the breadth of their donor base and total receipts.
ii Party Organization Structure and Role in the Party Network
Perhaps most crucially, the actions state party organizations take to maintain the party
meaningfully differ from other political organizations within the party network. The presence
of party organizations within states take three forms: the central state party committee,
legislative party campaign committees (LPCCs), and affiliated temporary victory funds.2
The state party committees focus primarily on active administration and voter mobilization
efforts (La Raja, 2008; Cotter and Bibby, 1984; Cotter et al., 1989). Legislative Party
Campaign Committees focus more on the recruitment of new candidates and maintaining
legislative chamber majorities (Bibby and Holbrook, 1996; Rosenthal, 1995; Gierzynski
and Jewell, 1992). Affiliated party victory committees in turn arise as part of national
party pushes to aid in acquiring state legislative and Congressional majorities with late
campaign ad buys and another venue for donors who reached the contribution limit for other
candidates/organizations (Hernson, 2009; La Raja, 2008; Heberlig and Larson, 2012). Three
2The Federal Elections Committee (FEC) requires a state party committee meet three requirements:
features unite these organizations from others within the party network: direct control by
party leaders, coordinated expenditures with higher expenditure limits, and efficiency of
campaign targeting.
All party-associated committees, whether it take the form of the central party committee,
an LPCC or temporary majority push, all are headed by the primary officeholders and their
appointees within the state. Cotter et al. (1989) and Bibby and Holbrook (1996) consistently
find that governors have direct input into the selection of party chairs, and other members
are appointed with the permission of state house speakers and senate presidents.3 Gierzynski
and Jewell (1992) and Rosenthal (1995) find that the legislative chamber leaders directly
head their LPCC, though tend to leave day-to-day activities to a trusted appointee, such as
their chief of staff. Affiliated victory funds vary more in staffing, though usually comprise
those with connections and the trust of both state and national party leaders. For example,
the Promote Oregon Leadership Republican committee formed in 2007 to bolster the Oregon
Republican Party.4 The organization is still maintained and is currently headed directly
by House Republican Leader Rep. Carl Wilson and Deputy House Republican Leader Rep.
Greg Barreto.5 All of these committees bear responsibility for implementing the statewide
strategy for party power within the state. Additionally, Federal Election law limits donations
to both state and local political party committees to $10,000 per donor.6 Therefore, it is
3Or the equivalent head of the state senate.
4Data on Promote Oregon Leadership acquired from Brandenburg (N.d.) and the organization’s website,
“Promote Oregon,”https://www.promoteoregon.gop/ (accessed April 11, 2019)
5Ibid.