ADIPOSE GENE AND ISOFORM EXPRESSION EFFECTS ON CARDIOMETABOLIC TRAITS
Chelsea Kaitlin Raulerson
A dissertation submitted to the faculty at the University of North Carolina at Chapel Hill in partial fulfillment of the requirements for the degree of Doctor of Philosophy in the Bioinformatics and Computational Biology program in the School of Medicine.
Chapel Hill 2019
Approved by: Karen L. Mohlke Terrence S. Furey Yun Li
© 2019
ABSTRACT
Chelsea Kaitlin Raulerson: Adipose gene and isoform expression effects on cardiometabolic traits (Under the direction of Karen L. Mohlke and Terrence S. Furey)
To my parents, Craig and Gail, whose encouragement to “keep my eye on the ball” got me this far. To my fiancée, Chris, who endured a lot of nervous “but what ifs” and still loves me. And to my
ACKNOWLEDGEMENTS
First, I would like to thank my mentors, Karen Mohlke and Terry Furey. I couldn’t ask for a better team to support me. Through many trials and tribulations with cell-type heterogeneity and PEER factors, you taught me the critical scientific skill of perseverance. I have been astonished to find that I can now predict your questions and future analysis suggestions, because of the care you put into explaining your thought processes over the years. Thank you for your wisdom and intuition and thank you for letting me try to do the analysis both ways.
I would also like to extend thanks to my committee members, Yun Li, Michael Love, Joel Parker, and Daniel Pomp. Your questions and suggestions in our meetings have been extremely helpful to my development as a scientist, especially in shaping the way I approached new problems and questions as they arose. Special thanks to Mike Love for developing the “unmix” segment of DESeq2 to help me with the heterogeneity of our adipose tissue.
I would also like to thank the members of the Mohlke and Furey labs past and present. Your encouragement through the rough times and your advice on various aspects of analysis have been critical to this dissertation. In particular, I would like to thank my “science big brothers” Jeremy Simon, Damien Croteau-Chonka, Bryan Quach, and Jim Davis, who gave me a bunch of important and
unsolicited advice. I would also like to thank Cassie Spracklen, Ying Wu, and Alaine Broadaway for letting me pick their brains endlessly about statistical models, career development, and for time saving code. Financial support for this dissertation was provided by NIH T32GM067553.
herding me to bed. And last, but not at all least, thank you to my fiancé Chris. You have been my
TABLE OF CONTENTS
LIST OF TABLES ... x
LIST OF FIGURES ... xi
LIST OF ABBRIEVIATIONS ... xii
CHAPTER 1: INTRODUCTION ... 1
Cardiometabolic traits and GWAS ... 1
Expression Quantitative Trait Loci (eQTLs) and RNA-sequencing ... 2
Adipose tissue and gene expression ... 4
Deconvolution and cell-type heterogeneity... 5
Colocalization of GWAS and eQTL signals ... 5
Expression-trait associations and mediation analysis ... 6
METabolic Syndrome in Men (METSIM) Study ... 7
CHAPTER 2: ADIPOSE TISSUE GENE EXPRESSION ASSOCIATIONS REVEAL HUNDREDS OF CANDIDATE GENES FOR CARDIOMETABOLIC TRAITS ... 12
Introduction ... 12
Methods ... 13
METSIM study participants and sample characteristics ... 13
RNA extraction and sequencing ... 14
Expression quantification and sample level QC ... 14
eQTL mapping ... 15
eQTL validation ... 16
Analysis of tissue heterogeneity ... 20
eQTL identification and characterization... 20
Colocalization of eQTLs and cardiometabolic GWAS loci ... 22
Cross-ancestry colocalization analysis ... 24
Cardiometabolic trait association with expression level of eQTL-GWAS colocalized genes ... 26
Mediation analysis ... 26
Discussion ... 27
Acknowledgements ... 30
CHAPTER 3: SPLICE EQTL DETECTION REVEALS ISOFORM VARIATION IN CARDIOMETABOLIC TRAITS ... 117
Introduction ... 117
Methods ... 118
METSIM study participants, genotypes and sequencing ... 118
Gene, exon, and splice junction quantification ... 119
Gene eQTL, exon eQTL, and sQTL detection ... 119
Pathway analysis ... 120
Colocalization with cardiometabolic GWAS loci ... 120
Validation of a novel NR1H3 splice junction ... 121
Results ... 121
sQTL identification and characterization ... 121
Colocalization of sQTLs and cardiometabolic GWAS loci ... 123
Colocalizations at MADD-NR1H3 locus, by trait and quantification ... 124
Discussion ... 125
Acknowledgements ... 126
CHAPTER 4: DISCUSSION ... 147
LIST OF TABLES
Table 2.1: Characteristics of the METSIM study participants in 434 sample subset ... 47
Table 2.2: Comparison of cis-eQTL discovery between sample subsets ... 48
Table 2.3: Comparison of known adipose cis-eQTLs between sample subsets ... 49
Table 2.4: Replication of lead eQTLs between METSIM and GTEx ... 50
Table 2.5: Enrichment in Roadmap adipose nuclei marks and METSIM adipose tissue ATAC-seq peaks ... 51
Table 2.6: Trans-eQTL discovery at three significance thresholds ... 52
Table 2.7: Replication of METSIM trans-eQTL for KLF14 target genes in TwinsUK ... 55
Table 2.8: 93 cardiometabolic diseases and quantitative traits key terms for which GWAS Catalog loci were examined ... 58
Table 2.9: Primary eQTLs (FDR <1%) colocalized with GWAS variants based on linkage disequilibrium and conditional analysis between GWAS and lead eQTL variants ... 73
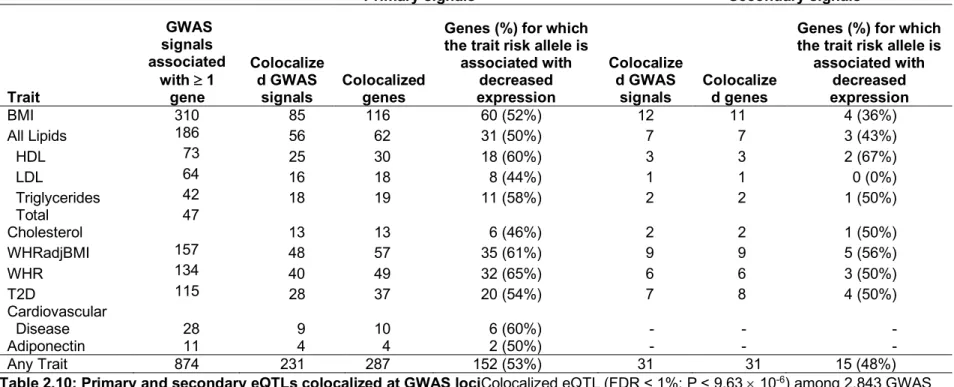
Table 2.10: Primary and secondary eQTLs colocalized at GWAS loci... 74
Table 2.11: Proportion of tested GWAS signals colocalized ... 75
Table 2.12: Secondary eQTLs (FDR <1%) colocalized with GWAS variants based on linkage disequilibrium and conditional analysis between GWAS and lead eQTL variants ... 78
Table 2.13: Coloc2 summaries of 173 genes found to be colocalized by conditional analysis ... 93
Table 2.14: Comparison of LD for loci with strongest GWAS signals for BMI identified in East Asians .... 95
Table 2.15: Gene expression - trait associations (unadjusted for BMI) for genes colocalized by LD ... 98
Table 2.16: Gene expression - trait associations (adjusted for BMI) for genes colocalized by LD ... 101
Table 2.17: Mediation of cardiometabolic traits through gene expression ... 115
Table 2.18: Mediation analysis of GWAS variants ... 116
Table 3.1: Gene, exon, and splice eQTL discovery with various PEER factors ... 132
Table 3.2: A summary of gene-, exon-, and splice junction eQTL discovery ... 133
Table 3.3: Pathway analysis of sQTL-specific genes ... 134
Table 3.4: sQTL colocalizations with cardiometabolic traits ... 140
Table:3.5: Distinct GWAS signals around the MADD-NR1H3 locus ... 141
LIST OF FIGURES
Figure 1.1: Assignment of reads for different quantification methods ... 9
Figure 1.2: Colocalization between GWAS and eQTL signals ... 11
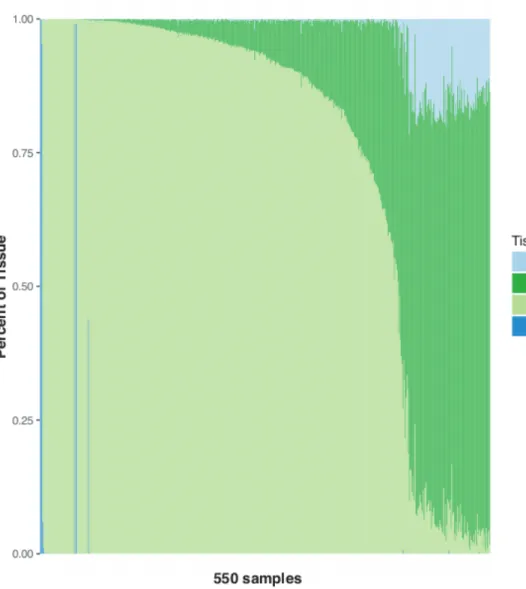
Figure 2.1: Percentages of different tissues across 550 samples ... 32
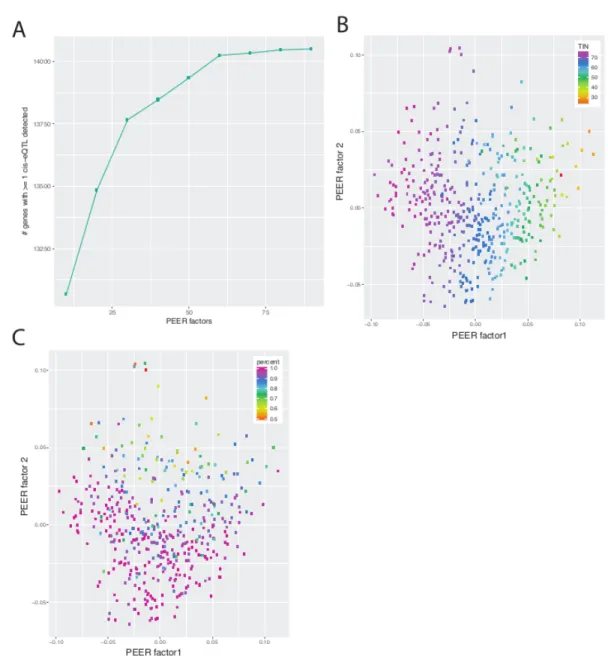
Figure 2.2: Selection and identification of PEER factors ... 33
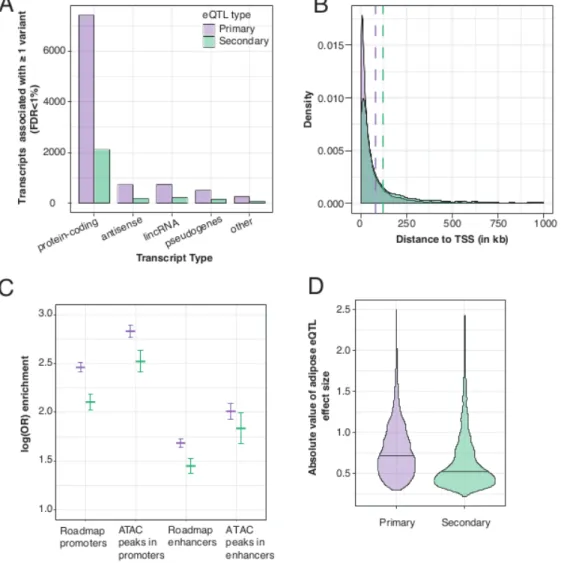
Figure 2.3: Comparison of primary and secondary eQTL association signals... 34
Figure 2.4: eQTL effect sizes for variants located in adipose tissue ATAC-seq peaks or ... 35
Figure 2.5: Cardiometabolic GWAS and eQTL colocalizations, stratified by trait ... 37
Figure 2.6: Extended Cloud City plots of cardiometabolic GWAS and eQTL colocalizations, stratified by trait ... 41
Figure 2.7: A WHRadjBMI signal colocalizes with the secondary eQTL for DGKQ ... 43
Figure 2.8: Comparison of GWAS and eQTLs found not to be colocalized by coloc2 ... 44
Figure 2.9: Cross-ancestry comparison of colocalized GWAS – eQTL signals ... 45
Figure 3.1: The number of significant splice QTLs observed per gene ... 127
Figure 3.2: Overlap between genes identified by eQTLs on the gene-, exon- and splice-level ... 128
Figure 3.3: Novel splice junction that removes exon 4 of NR1H3 ... 129
Figure 3.4: Colocalization of multiple GWAS and eQTL signals at MADD-NR1H3 ... 130
LIST OF ABBRIEVIATIONS
BMI Body mass index CI Confidence interval
COPD Chronic obstructive pulmonary disease CPM Counts Per Million
CVD Cardiovascular disease
eQTL Expression quantitative trait locus EST Expressed sequence tag
FDR False discovery rate FGlu Fasting glucose
GWAS Genome-wide association study HDL High density lipoprotein
LD Linkage disequilibrium LDL Low density lipoprotein
M Million
Mb Megabase
METSIM METabolic Syndrome in Men PSI Percent spliced in
RNA Ribonucleic acid
RNAseq Ribonucleic acid sequencing
sQTL Splice expression quantitation trait locus TC Total cholesterol
TG Triglycerides
CHAPTER 1: INTRODUCTION
Cardiometabolic traits and GWAS
Cardiovascular disease (CVD) and type 2 diabetes (T2D) present a substantial cost and public health burden in the US and worldwide1,2. In the United States, cardiovascular disease affects about 121.5M people and will cost the US an estimated 680 billion dollars in 20203. An estimated 26M Americans are living with Type 2 diabetes and about 101.2M are undiagnosed or have prediabetes3. Cardiovascular disease and T2D share a cluster of risk factors, sometimes called metabolic syndrome, that are thought to contribute to disease progression4,5. These risk factors include obesity and body fat distribution, measured by body mass index (BMI) and waist-to-hip ration (WHR), circulating lipid levels, such as high-density lipoprotein cholesterol (HDL), low-density lipoprotein cholesterol (LDL) and triglycerides, and clinical measures of glycemic traits, such as fasting insulin, proinsulin, and glucose6. Risk factors for cardiometabolic diseases are heritable7–9 and are themselves complex traits, meaning that numerous genes are involved in the development of these clinical phenotypes. The complexity of these diseases and traits requires genome-wide efforts to detect the many genetic loci that contribute to disease etiology and progression.
European ancestry GWAS studies have had the largest sample sizes for complex traits, but GWAS of other ancestries, particularly East Asian ancestry, are rapidly increasing in sample size. This expansion is critical, because allele frequency can differ substantially between populations with different ancestries, resulting in changes in the lead variant(s) or even novel signals18.
While GWAS have identified regions of the genome that may influence the trait of interest, they do not provide evidence for which gene or genes are altered by the signal, or identify the mechanism of action. The identity of the putative genes and mechanisms at these loci is valuable because candidate genes could be analyzed biochemically to assess their effects on traits and disease and could eventually be used as potential targets for pharmaceutical interventions. To name these loci, some GWAS
investigators attempt to identify a plausible biological candidate gene in the surrounding region but many simply name the locus after the nearest gene due to the high volume of signals detected genome-wide.
While a fraction of GWAS variants change the coding sequence of proteins, the majority of variants found in these analyses are non-coding and have unknown function10. One common hypothesis is that noncoding variants may influence clinical traits by altering the expression of nearby genes. Since gene expression levels have been found to be highly heritable19,20, one of the many methods have been proposed to focus on the plausible candidate genes is mapping expression quantitative trait loci
(eQTLs)21. This method uses the gene expression, assayed via microarray or RNA-sequencing, and genotypes from the same samples to perform association testing, ordinarily using linear regression, and identify eQTLs.
Expression Quantitative Trait Loci (eQTLs) and RNA-sequencing
chromosomes. Distal eQTLs also commonly have a local association between the lead variant and a transcript encoding a transcription factor or other molecule that may modulate the expression level of other genes. Power to detect trans-eQTLs is still limited given current sample sizes due to multiple testing burden and modest effect sizes, especially when compared with model organisms22. Both cis- and trans-eQTL associations have been reported across many tissue types23. Like GWAS associations, eQTL studies can identify multiple distinct associations in a region, by conditional analysis. Primary eQTLs are the associations identified without any conditional analysis, and all subsequent signals are called conditional eQTLs. Studies have shown that conditional eQTL signals are common genome-wide23 and their associated lead variants are farther away from the TSS than primary eQTL signals24. Allelic heterogeneity, a process by which multiple variants act through a gene on a trait, may account for the ‘missing heritability’ observed at GWAS loci25, rendering the inclusion of conditional eQTL in current and future studies vital.
Adipose tissue and gene expression
Adipose tissue is involved in a wide variety of cardiovascular and metabolic processes, including angiogenesis42 and blood pressure43, body weight homeostasis and appetite regulation44, and insulin sensitivity and glucose homeostasis45,46. Adipocytes expand to store excess lipids, buffer lipid energy balance45,47, and release adipokines to regulate energy levels48. Subcutaneous adipose tissue in
particular has been suggested to play a protective role in metabolic risk49. Adipose tissue can also buffer energy balance by expanding either the size of individual adipocytes or by forming new adipocytes; larger adipocytes have been linked to insulin resistance45,46, while proliferation of adipocytes confers lower risk. While an estimated 94% eQTLs are shared across two or more tissues50, some are tissue-specific due to the expression pattern of the gene, necessitating the study of tissues closely connected to disease etiology and progression.
Prior efforts have been made to identify the expression profile of subcutaneous adipose tissue and the variants that alter expression of genes and splices. Many studies have identified cis-eQTLs in adipose tissue51–55. Among these, several have compared adipose tissue with other metabolically active tissues such as liver and skeletal muscle53–55. Gamazon et al. identified adipose-specific eQTLs by comparing with other tissues within GTEx55. Studies have also mapped trans- eQTLs in adipose tissue, discovering several potential master regulators51–53,56,57. Small et al. identified a trans-eQTL signal
Deconvolution and cell-type heterogeneity
Bulk tissue expression analysis presents a unique set of challenges to isolating gene expression profiles, such as contamination from other tissues or heterogeneity of expression between different cell-types native to the tissue of interest. Subcutaneous adipose tissue itself is heterogeneous and contains native cell-types, such as adipocytes, preadipocytes, and endothelial cells, as well as infiltrating
macrophages, which enter adipose tissue as part of the inflammatory processes surrounding obesity58,59. Additionally, the type of biopsy can contribute heterogeneity to the sample, with needle biopsies providing more potential for blood cell contamination than other methods60. Due to these challenges, deconvolution methods have been proposed to detect and remove contaminated samples to improve data quality or to attempt to isolate the signals of specific sub-populations of cells61–63. Deconvolution analyses can also be used to adjust for the cell-type component of the signal to allow more heterogeneous samples to be compared. Recently, Glastonbury et al. noted that adjustment for known and unknown factors that influence gene expression, using PEER or similar software, is sufficient to reduce the variability for reliable detection of gene-level cis-eQTLs64. However, studies with the goal of ascertaining a signal’s cell-type of origin require more careful deconvolution methods.
Colocalization of GWAS and eQTL signals
chance alone, colocalization methods are applied to formally test whether the GWAS and eQTL represent the same signal.
Numerous colocalization methods have been proposed, using both Bayesian and frequentist statistical models65–71. Some colocalization methods require access to primary genotypes and gene expression levels, while others require only summary-level data from both the GWAS and eQTL studies, that are often made publicly available. All of these methods are somewhat sensitive to the priors and assumptions 65,72, thresholds for significance, or to the presence of multiple signals66. Colocalization is further complicated due to changes in allele frequency when comparing eQTL studies of smaller sample size to large GWAS meta-analyses with heterogeneity of sample size from variant to variant and by comparing eQTLs of one ancestry to GWAS in another.
Several studies have identified cis-eQTLs that colocalize with GWAS loci for T2D, WHR, BMI, and other cardiometabolic traits51–54. Civelek et al. found evidence of 140 eQTLs colocalized with 109 cardiometabolic GWAS traits52. The STARNET study compared cardiometabolic disease GWAS loci to eQTLs from seven vascular and metabolic tissues, including subcutaneous and visceral adipose tissue (n=600 patients with coronary artery disease) and found substantial overlap between adipose tissue and blood lipid phenotypes54. Sajuthi et al. mapped eQTLs in adipose and muscle tissue from 260 non-diabetic African Americans and found cis-eQTL associations with more than 54 genes at GWAS loci for T2D and obesity53. Gamazon et al. found enrichment of adipose-specific cis-eQTLs for diastolic blood pressure GWAS signals in GTEx (version 6)55. Additional GWAS-eQTL colocalizations may be detected by using larger eQTL sample sizes and different methods of measuring gene expression, as well as by analyzing additional GWAS loci.
Expression-trait associations and mediation analysis
because BMI is also associated with other clinical traits and included as a covariate for traits like WHR, fasting glucose, and fasting insulin. Collider bias occurs when an artificial association is introduced due to both the exposure (gene) and the outcome (trait) associating with a third variable, in this case, BMI73. When interpreted with appropriate consideration of collider bias, gene-trait association can help to elucidate the genes that are associated with clinical traits.
Mediation analyses incorporate genetic variants to perform a more sophisticated test for the effect of a variant on a trait level through gene expression level. Mediation analyses with individual level data for variant, trait and expression level is rare, because very few eQTL studies have been performed with tissue from individuals that have extensive clinical traits measured. Evidence of mediation can provide additional statistical support for the involvement of candidate genes in the modulation of traits, particularly at colocalized GWAS and eQTL signals.
METabolic Syndrome in Men (METSIM) Study
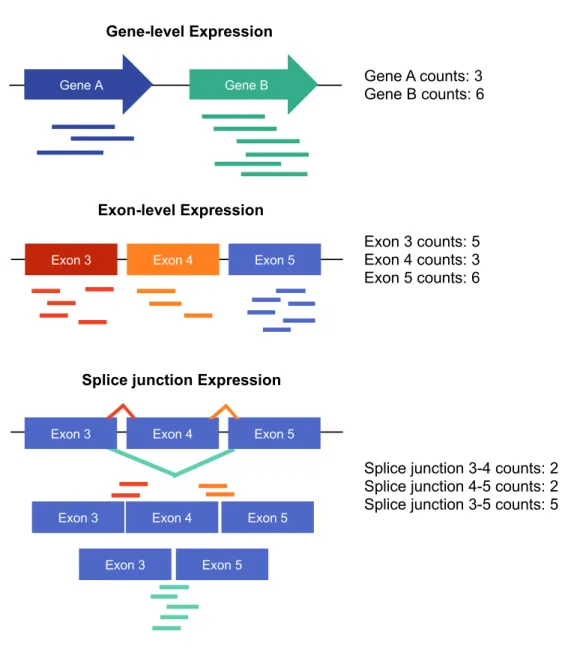
Figure 1.1: Assignment of reads for different quantification methods: Read counts in RNA-sequencing can be quantified on different levels. For each model (gene-, exon-, and splice-level), the reads overlapping different features are shown (left) and the resulting read counts are shown (right).
Gene-level Expression
Gene A Gene B Gene A counts: 3
Gene B counts: 6
Exon-level Expression
Exon 3 counts: 5 Exon 4 counts: 3 Exon 5 counts: 6
Exon 3 Exon 4 Exon 5
Exon 3 Exon 4 Exon 5
Exon 3 Exon 4 Exon 5
Exon 3 Exon 5
GWAS
-lo
g10
(p
-va
lu
e)
chromosomal position
Gene D
Gene A Gene C
Gene B
Gene D eQTL (not colocalized)
-lo
g10
(p
-va
lu
e)
Gene C eQTL (colocalized)
-lo
g10
(p
-va
lu
e)
chromosomal position
Gene D
Gene A Gene C
CHAPTER 2: ADIPOSE TISSUE GENE EXPRESSION ASSOCIATIONS REVEAL
HUNDREDS OF CANDIDATE GENES FOR CARDIOMETABOLIC TRAITS1
Introduction
Excess adipose tissue, especially in central abdominal depots, is associated with increased cardiometabolic risk76,77 and mortality78. Subcutaneous adipose tissue expands to store additional lipids and serves as a buffering system for lipid energy balance, especially for fatty acids45,47, providing a protective role in metabolic risk49. However, expansion of adipocyte size, rather than formation of new adipocytes has also been linked to insulin resistance45,46.
Genome-wide association studies (GWAS) have identified thousands of loci for hundreds of human traits, but most functional variants, genes affected by variants, and mechanisms remain elusive. Identification of genetic variants associated with gene expression level (eQTLs) in relevant tissues has proven useful to link non-coding GWAS variants to plausible candidate genes that may influence complex traits50. While 94% of eQTLs are shared across at least two tissues50, some are specific to one tissue or a subset of tissues, necessitating the study of tissues that potentially contribute to GWAS traits to identify candidate genes.
Recently, eQTL studies have begun to identify additional eQTL signals through conditional analysis23,24,79in addition to the more commonly reported primary eQTLs. These additional conditionally distinct secondary eQTL signals are widespread and located more distal than primary signals from the transcription start sites of the associated genes23,24. The additional eQTL signals have also been shown to colocalize with GWAS loci24, suggesting that they can detect additional candidate genes.
Previous studies have identified adipose tissue cis-eQTLs and tested for colocalizations of eQTL signals with cardiometabolic GWAS loci52,54,80,81. Additionally, GWAS have reported colocalized
subcutaneous adipose cis-eQTLs with loci for body mass index (BMI), waist-hip ratio (WHR), WHR adjusted for BMI (WHRadjBMI), type 2 diabetes (T2D), circulating lipid levels, and adiponectin, a hormone produced by adipocytes that regulates glucose levels and fatty acid breakdown12,15,82–84. However,
colocalization presents its own challenges, particularly when the GWAS and eQTL studies are from different ancestries or when multiple, conditionally distinct signals exist.
Here, we describe the analysis of subcutaneous adipose tissue gene expression levels from 434 participants in the METabolic Syndrome in Men (METSIM) study. METSIM participants have been well characterized for detailed clinical phenotypes, including metabolic and cardiovascular traits such as plasma lipids, anthropometric, and glycemic traits74. We identified and characterized primary and secondary cis-eQTL genes that colocalize with GWAS loci for BMI, cholesterol and triglyceride levels, WHR and WHRadjBMI, T2D, adiponectin, cardiovascular endpoints, and other cardiometabolic traits. We further associated gene expression level with cardiometabolic trait levels in the METSIM cohort and identify the genes that show the strongest evidence of mediating the variant to trait associations.
Methods METSIM study participants and sample characteristics
METSIM is a population-based cohort composed of 10,197 males of Finnish ancestry from Kuopio, Finland74. For this analysis, we used a subset of 550 participants from whom subcutaneous adipose tissue had been collected near the umbilicus by needle biopsy. The METSIM study was
approved by the Ethics Committee of the University of Eastern Finland and Kuopio University Hospital in Kuopio, Finland and carried out in accordance with the Helsinki Declaration. Written informed consent was obtained from all participants.
described52. For this study, we filtered HRC-imputed genotypes to retain 7.8 million variants with minor allele frequency (MAF)>0.01 and imputation quality, r2>0.3.
RNA extraction and sequencing
Following the adipose tissue biopsies, total mRNA was isolated using the Qiagen miRNeasy kit (Qiagen, Hilden, Germany), following the manufacturer’s instructions. mRNA was isolated with a polyA+ selection protocol (Illumina TruSeq RNA Sample Preparation Kit v2) and sequenced on the Illumina HiSeq 2000 platform at the University of California Los Angeles Neuroscience Genomics Core (UNGC) to an average sequencing depth of 45 million paired-end 50 bp reads.
Reads were filtered using the Fastx-toolkit requiring 80% of bases to have phred quality > 20. Reads containing linker and adapter sequences were removed using TagDust (see URLs). We implemented STAR (version 2.4.2a)86 to align reads to the hg19/GRCh37 human genome reference sequence87, using GENCODE v19 (July 2013 freeze) as the annotation. Duplicate reads were retained. Read pairs with unpaired alignments were removed. The average uniquely mapped reads across all samples was 82.2%.
To ensure RNA samples were matched with the correct genotypes, we applied MixupMapper88, verifyBamID89, and GATK best practice guidelines(see URLs) to call variants from RNA-seq data and assign best matches between the RNA-seq and genotype data. We retained samples that matched DNA genotypes corresponding to the expected self-sample for at least one method.
Expression quantification and sample level QC
To assess the tissue heterogeneity of tissue samples, we used the unmix function in DESeq263 to estimate the percent composition of whole blood, Epstein Barr virus (EBV)-transformed lymphocytes, skeletal muscle, and subcutaneous adipose, using Genotype-Tissue Expression (GTEx) v7 median TPM values per tissue as reference55. We examined the expression of adipose-specific genes in three sample sets: all samples (n = 550) and the subsets comprised of samples with approximately >50% adipose composition (n = 434) and > 75% adipose composition (n = 387).
eQTL mapping
To adjust for the known and unknown technical factors that influence gene expression estimates, we inverse normal transformed gene-level TPMs and implemented probabilistic estimation of expression residuals (PEER)92 and inverse normal transformed again, since both PEER and eQTL detection require data in a normal distribution. To optimize for cis-eQTL discovery, we performed PEER analysis including differing numbers of factors (k = 10 to 90) at intervals of 10. We next performed cis-eQTL detection using FastQTL (v2.184)93 on all variants within 1Mb of the TSS of each gene and assessed the total number of cis-eQTLs and the number of genes associated with ³ 1 variant with various PEER factor values. We
selected 60 PEER factors to maximize the number of cis-eQTLs identified. We next implemented FastQTL permutation testing to estimate adjusted p-values and calculated the P-value corresponding to 1% FDR using the qvalue packagein R (P < 9.6 ´ 10-6) to account for genome-wide eQTL testing of variants within 1Mb of each transcript and determine the significance threshold.
To identify conditionally distinct cis-eQTLs, we first identified all genes with ³ 1 significantly
associated variant at FDR < 1% and the lead variant for each of these genes. We then included the dosage values of the lead variant for each gene as a covariate for eQTL mapping using FastQTL. Conditional secondary eQTLs were considered significant at FDR < 1% for primary cis-eQTLs (P < 9.6 ´
10-6).
gene expression for 18,553 remaining genes and adjusted for TIN, batch, age, insert size, deletion distribution, and either 0 or 3 PEER factors prior to analysis. To avoid collider bias, we used limited PEER factors in trans-eQTL mapping. Using QTLtools (v1.1)32, we performed association tests for variants > 1 Mb away from the transcription start site (TSS); the significance threshold for identifying trans-eQTLs was calculated using the Bonferroni correction (P < 3.4 ´ 10-13).
eQTL validation
For validation, we compared eQTLs with the significant eQTLs from the GTEx Project V7 release for both subcutaneous (n = 385) and visceral adipose tissue (n = 313). For variant-gene pairs available in both files, we matched the effect alleles to compare the of direction of effect. To ensure that groups of variants associated with the same gene did not inflate replication estimates, we limited this analysis to the lead variants for each gene in either METSIM or GTEx. We used the lead variant for each gene from one study and assessed whether that variant was significant for the same gene in the other study. We then counted the number of variant-gene pairs that showed a consistent direction of effect and met several different P-value thresholds between 5 ´ 10-3 and 5 ´ 10-8 in both studies.
selected background variants using GREGOR100; variants were matched on allele frequency, distance to gene, and LD (r2 > 0.8 1000 Genomes phase 1, in a 1 Mb window). Background variants were then pruned with swiss using the same parameters as for significant eQTLs. We removed background variants that were themselves significant eQTLs at FDR < 1% (primary or secondary signals) or that were in high LD (r2 > 0.8) with an eQTL lead variant (primary or secondary signals). We tested for enrichment using logistic regression, regressing the eQTL status of a variant (1 = significant eQTL, 0 = not eQTL), against whether that variant overlapped a given genomic annotation (1 = overlapped, 0 = not overlapped). An eQTL or background variant was considered to overlap a genomic annotation if it or any of its LD proxies (r2 > 0.8, 1000 Genomes phase 1) overlapped the annotation. Enrichment was defined as the beta of the regression model, which is the log of the odds ratio that a variant is an eQTL if it overlaps the given genomic annotation.
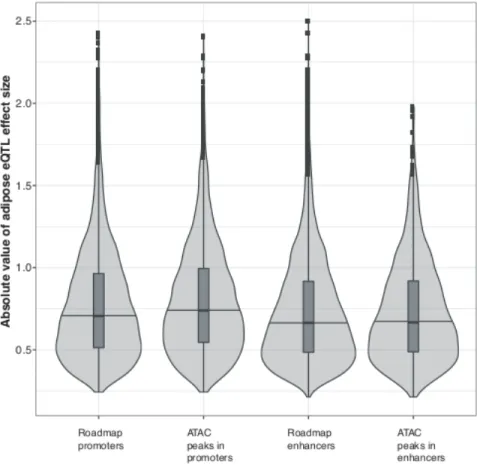
To compare the effect sizes of eQTL signals that overlap various genomic annotations, we used the lead eQTL variant and all variants in high LD (r2 > 0.8) to identify overlaps with promoters, enhancers, and ATAC-seq peaks, stratified by primary and secondary eQTLs. We then used the effect size of the lead variant of the overlapping eQTLs to test for differences in the strength of effect among different annotations using a Wilcoxon rank sum test.
Selection of GWAS loci and GWAS-eQTL colocalization
We performed initial colocalization analysis based on LD between a lead GWAS variant and a lead eQTL variant. We then performed conditional analysis in the eQTL data by providing genotypes for the lead GWAS variant to FastQTL as a covariate. We considered signals to be colocalized if: (i) the pairwise LD was high between the GWAS variant and eQTL variants (r2 ³ 0.8 in METSIM), and (ii) after conditioning on the GWAS variant, the lead eQTL variant no longer met the 1% FDR equivalent P-value (P > 9.6 ´ 10-6).
For eQTLs that appeared colocalized with GWAS signals based on LD, we applied coloc224 to further assess evidence of colocalization. Coloc2 is a Bayesian method that uses summary statistics to test whether variants underlying a signal are shared between two studies. For each gene, we included all variants located within 1 Mb of the TSS for which summary statistics were available in both the GWAS and eQTL studies. Coloc2 estimates the posterior probabilities of five hypotheses concurrently (H0, no association signal in either the GWAS or eQTL; H1, only the GWAS has an association signal; H2, only the eQTL has an association signal; H3, both datasets have an association signal, but they are not the same; H4, the GWAS and eQTL associations signals are colocalized). To make our results more
comparable with prior colocalization studies, we set prior probabilities for coloc2 to values comparable to coloc’s66 default settings, rather than allowing the software to generate its own priors. We used coloc’s default priors for p1 and p2, the prior probabilities that a variant is causal for either GWAS or eQTL respectively (p1 and p2 = 1 ´ 10-4) We set p12, the prior probability that a variant is causal to both GWAS
and eQTL, to 1 ´ 10-6. We selected this more conservative value than coloc’s default p12 prior (1 ´ 10-5)
because we are using coloc to provide additional support for conditional analysis results based on LD and conditional analysis. We evaluated the posterior probabilities that correspond to H3 and H4, that both the GWAS and the eQTL have signals, but that they are not the same (PP3) and that the GWAS and eQTL signals colocalize (PP4), respectively. We considered the signals to have strong evidence of
colocalization if PP4 > 0.8.
Trait-gene expression association
of the 20 cardiometabolic traits measured in the 434 individuals (for a list of traits, see Tables 2.15 and 2.16). We adjusted traits for age and gene expression level for TIN, sequencing batch, and age. Following inverse normal transformation of both trait and expression level residuals, we used linear regression to test for association between the gene expression levels and traits. Because adipose expression level of a large number of genes is associated with BMI, we also performed these analyses additionally adjusting both gene expression levels and traits for BMI. The P-value corresponding to 5% FDR was calculated using the qvalue package in R.
Mediation analysis
Mediation analyses were conducted in 434 METSIM individuals using a procedure described by Imai et. al103, similar to that of Huang et al.104, implemented in R and C++, assuming an additive effect and modified for a continuous outcome. We performed mediation analyses only when the eQTL and GWAS data were colocalized and trait data for the GWAS trait itself or a similar trait was available for METSIM individuals, specifically testing fasting glucose, fasting insulin, Matsuda index, and HOMA-β for T2D. We determined the effect of a variant on a trait through the mediator of gene expression, the effect of the variant on the trait when the mediator is held constant, and the combined effect, which is the sum of the mediation and variant-trait effects. This method uses two least squares regression models, where the first model uses the variant genotype, coded as 0, 1, or 2, as the predictor and the mediator of gene expression as the response, and the second model uses both gene expression level and variant
Results Analysis of tissue heterogeneity
To identify cis-eQTLs for subcutaneous adipose tissue, we performed RNA-seq on needle biopsy samples obtained from 550 Finnish men in the METSIM study (Table 2.1). Adipose tissue is comprised of adipocytes, pre-adipocytes, endothelial cells, and various immune cells58,59, and needle biopsies of adipose tissue can include whole blood and/or muscle. The resulting heterogeneity between samples can confound the analysis of bulk tissue transcriptomics105–107, but its effects can be mitigated by tissue deconvolution methods. We estimated tissue composition using tissue from GTEx as reference tissue profiles (Figure 2.1). We found wide variation in the estimated percentage of adipose tissue within our samples. To determine whether to limit the analysis to higher purity samples or to retain the larger sample size including lower quality samples, we compared eQTL results from the set of all 550 samples to subsets of samples with estimated adipose tissue percentage of approximately >50% (n=434) and >75% (n=387). For all three sample sets, we performed cis-eQTL analyses with a range of PEER factor
corrections using 7.8M variants and 21,735 genes. We then compared the strength of association at three previously described adipose eQTL loci52,80 and counted the total number of variant-gene associations observed (Tables 2.2, 2.3). The known eQTLs showed the strongest associations within the >50% adipose subset (Table 2.3). The 50% adipose subset also had the most significant cis-eQTL variants (1.6M vs. 1.5M and 1.4M, 50%, all, and 75% sample sets, respectively) and the most variant-gene pairs (3.0M vs. 2.8M and 2.5M, 50%, all, and 75% sample sets, Table 2.2). These results suggest that the heterogeneity between samples in the full sample set of 550 samples and the smaller sample size of the 387 samples with >75% adipose attenuated the association signals and that requiring samples to contain >50% adipose tissue (n=434) yielded a set of cis-eQTL results that best correspond to adipose tissue; thus, we performed all subsequent analyses using the subset of 434 samples.
eQTL identification and characterization
We performed genome-wide cis-eQTL analyses using ~7.8 million genetic variants (MAF > 0.01) from the 434 samples with >50% adipose tissue and 21,735 genes. Of these, 9,687 genes were
and second PEER factors correlated with TIN96 and estimated percent adipose tissue, respectively (Figure 2.2).
To examine the validity of our results, we compared the METSIM subcutaneous adipose tissue eQTL results to those from the GTEx project’s subcutaneous (n=385) and visceral (n=313) adipose eQTL analyses. Overall, GTEx detected fewer cis-eQTLs (FDR<5%) than METSIM (Table 2.4). At a
significance threshold of P < 5 ´ 10-5, which meets the FDR <5% threshold in both studies, 4,442 (95.4%)
and 3,370 (96.4%) of the lead eQTL variants identified in METSIM also showed significant associations with the same gene and in a consistent direction of effect in the GTEx subcutaneous and visceral adipose data, respectively. Combined, these results demonstrated consistency of the METSIM subcutaneous adipose tissue eQTLs with GTEx eQTLs.
Secondary association signals are frequently identified at eQTL loci and may reflect more complex gene regulation23,24. Of 9,687 genes that exhibited primary eQTL signals, 2,785 genes (28.7%) showed a significant secondary cis-eQTL (FDR < 1%, P < 9.6 ´ 10-6). The proportions of transcript types
with primary and secondary cis-eQTLs were not significantly different from each other (&2 P = 0.42, Figure 2.3A). Secondary eQTLs have been reported to be located farther away from the TSS than primary eQTLs23,24. We also observed this pattern; the distribution of distances to TSS for secondary eQTLs (median=40.3 kb) was significantly higher than for primary eQTLs (median=26.7 kb, Mann Whitney U-test, P < 2.2 ´ 10-16; Figure 2.3B). The identification of secondary eQTL signals in subcutaneous adipose
tissue greatly expanded the set of cis-eQTL signals for available further investigation.
4.3 ´ 10-131; Figure 2.3D). Including both primary and secondary eQTL variants, effect sizes of variants
within promoters were significantly larger than variants within enhancers (P = 8.1 ´ 10-12; Figure 2.4), and
effect sizes of variants within open chromatin in promoters were significantly larger than promoter variants generally (P = 3.2 ´ 10-5). We observed no significant difference in the effect sizes between variants
within open chromatin in enhancers and all enhancer variants. These results indicate that eQTL variants within promoters, particularly those in open chromatin, have larger effects on expression levels of nearby associated genes than those variants in enhancers.
To identify variants that influence the expression of distal genes and contribute to regulatory networks in adipose tissue, we performed a trans-eQTL analysis using 7.8 M variants (MAF > 0.01) and 18,553 protein-coding and lncRNA transcripts, requiring variants to be > 1 Mb away from the TSS. Accounting for the number of tests performed (Bonferroni, P < 3.4 ´ 10-13), we identified 4,432 target genes, and at a relaxed significance threshold (P < 5 ´ 10-8), we identified 13,953 target genes,
representing 24 and 75% of genes tested, respectively (Table 2.6). At the known adipose-specific trans-eQTL hub near KLF1452,57, which is also a known GWAS locus for HDL-cholesterol108 and type 2 diabetes (T2D)109, we identified rs4731702 as the lead KLF14 cis-eQTL variant and validated (P < 5 ´ 10-8) the distal association of this variant with expression level of one known target gene, PRMT2, and two additional target genes, SNX14 and RBBP7, not previously reported52,57 (Table 2.7). This male-only METSIM study detected fewer trans-eQTL associations for KLF14 than the larger female-only TwinsUK study57, consistent with power and the reported stronger effects in females at this locus110.
Colocalization of eQTLs and cardiometabolic GWAS loci
While thousands of cardiometabolic GWAS loci have been identified, many of the genes underlying these associations remain unknown. We evaluated cis-eQTLs for evidence of colocalization with 2,843 GWAS signals (variants clumped by LD r2 ³ 0.8) associated with one or more of 93
Colocalized GWAS and eQTL signals suggest potential candidate genes for cardiometabolic risk. Among the 287 primary eQTL genes colocalized with a GWAS trait, eQTLs for 116 genes were identified at BMI loci, 62 genes for lipid traits, 57 genes for WHRadjBMI, 37 genes for T2D, and 10 genes for cardiovascular disease (Table 2.10). These colocalizations were based on differing numbers of GWAS signals per trait; to identify the proportion of GWAS signals with colocalized eQTLs for each trait, we compared the total number of signals reported by five recent GWAS publications for BMI, lipids, WHR, WHRadjBMI, and T2D, which reported between 79 to 851 conditionally distinct GWAS signals per trait, to the number of signals with a colocalized eQTL signal from those same studies. Across traits from five studies12–15,102, the proportion of signals found to be colocalized ranged from 8% for T2D and BMI to 12% for WHRadjBMI, 14% for all lipids, and 15% for WHR (Table 2.11). These results suggest that adipose tissue gene expression levels are relevant to a broad set of cardiometabolic and other GWAS traits, potentially reflecting the cell types present in adipose tissue.
Genes may influence disease risk by downregulating or upregulating expression level or
function111. To assess the direction of effect of GWAS signals on gene expression level, we matched the GWAS risk alleles to the gene expression effect alleles (see Methods). Across all primary colocalized loci, the GWAS trait risk allele corresponded to decreased gene expression for 53% of transcripts (Table 2.10; Figure 2.5; Figure 2.6), with a range from 44% for LDL loci to 65% for WHR loci. These results show that for common complex traits, disease risk is associated with decreased gene expression level for about half of all colocalized signals.
r2 = 0.26) but was colocalized with the secondary eQTL signal for DGKQ, rs13101828, based on LD and conditional analysis (r2 = 1.0; Figure 2.7). In hepatic cells, silencing DGKQ decreased the ability of synthetic FXR ligand to promote phosphorylation of mTOR, Akt and FoxO1112, and misregulation of the mTOR pathway has been shown to result in peripheral insulin resistance and to promote adipogenesis and lipogenesis in adipose tissue113. These results suggest that colocalization of secondary eQTLs can identify substantially more GWAS loci for which at least one potential candidate gene can provide insights into GWAS biology, than primary eQTL colocalizations alone.
For a subset of the 287 GWAS-colocalized primary eQTLs for which GWAS summary statistics were available (n=173; BMI, WHR, WHRadjBMI, and T2D), we further investigated colocalization of primary eQTL signals by applying coloc2, a Bayesian colocalization test that uses summary statistics24,66 (Table 2.13). Of 173 genes tested, 81 showed strong or moderate evidence of GWAS-eQTL
colocalization (coloc2 posterior probability H4 > 0.8 and H4 > 0.5, respectively). An additional 82 genes showed strong or moderate posterior probabilities that did not support colocalized signals (coloc2 H3 > 0.8 and H3 > 0.5, respectively), which was especially unexpected for nine signals with the same lead variant in both the GWAS and eQTL data and 31 signals with very strong pairwise LD (r2 > 0.95) between lead GWAS and eQTL variants. A comparison of GWAS and eQTL association plots (e.g. Figure 2.8; Table 2.13) showed the GWAS and eQTL signals are very similar and suggests that coloc2 is sensitive to additional nearby GWAS and eQTL signals.
Cross-ancestry colocalization analysis
As an example of similar LD patterns across populations, the lead BMI-associated variant near GON4L in Japanese individuals114, rs860295, was also the lead eSNP for DAP3 (Figure 2.9A). Similar to previous examples comparing GWAS and eQTL signals within one ancestry, the similar patterns of GWAS and eQTL association signals here suggest DAP3 as a candidate gene for the observed association with BMI. DAP3 has been shown to mediate interferon gamma-induced cell death115 and IFNG is involved in pro-inflammatory responses related to obesity116. Of note, a GWAS in Europeans102 also identified BMI-associated variants in this chromosomal region, although the European and Japanese GWAS variants exhibited low pairwise LD (r2 = 0.32 in 1000 Genomes East Asians and r2 = 0.35 in Finns) and the European signal was not colocalized with any genes (Table 2.9). While further characterization of the locus may identify additional candidate genes, the shared LD patterns support cross-ancestry
conclusions of colocalized GWAS and eQTL signals.
Two GWAS-eQTL signals we considered to be colocalized showed high LD (r2 ³ 0.8) between the lead GWAS and eSNP in Finns but not in East Asians. The lead GWAS variant at the IL27/NUPR1 East Asian BMI locus, rs62034325, is a cis-eQTL for SULT1A2 (P = 1.03 ´ 10-27; β = 0.67; Figure 2.9B).
LD between the lead GWAS variant and the eSNP, rs28698667, is high in Finns (r2 = 0.93) but low in East Asians (r2 = 0.22). However, LD between the lead GWAS variant and other near-lead eQTL variants (e.g. rs62034322, P= 1.02 x 10⁻²⁷; β = 0.67) is high in both Finns (r2 = 1.0) and East Asians (r2 = 0.89), and conditional analyses in the eQTL data (Pcond = 1.61 ´ 10-3) showed that these signals are colocalized. The SULT1A2 eQTL signal in Finns consists of more variants than the BMI signal in Japanese, and the BMI-associated variants appear to be a subset of the eQTL variants. SULT1A2 catalyzes the sulfate conjugation of estrogens, estrogenic alkylphenols, and 17-β-estradiol, to facilitate their removal from the body117, and increased levels of 17-β-estradiol are associated with obesity118; in addition, SULT1A1 levels were altered in adipose tissue of rats on a high fat diet119. These results are consistent with the
Cardiometabolic trait association with expression level of eQTL-GWAS colocalized genes To further investigate the 287 genes identified based on colocalized primary eQTL-GWAS signals, we tested for association of expression level with 20 cardiometabolic traits measured in the same 434 METSIM individuals. Because BMI is correlated with the expression level of a high percentage (51%) of all genes in our study, we performed gene-trait associations with and without adjustment for BMI (Table 2.15 & 2.16). Without adjustment for BMI, expression levels of 154 genes were associated with at least one trait, and with adjustment for BMI, expression levels of 49 genes were associated with a trait. The difference between the analysis with and without adjustment for BMI may demonstrate the influence of this trait on adipose tissue gene expression levels. This difference also could be due to gene expression and cardiometabolic traits influencing BMI (collider bias). We recommend caution interpreting association results when a gene’s expression level is associated with BMI (Table 2.15), as collider bias can alter the effect size and significance level of the association. The traits associated with expression level of the most genes were Matsuda index, WHR, and triglycerides. For example, at a WHRadjBMI locus, EIF4G2, also known as DAP5, was significantly associated with fasting free fatty acids (P = 3.0 x 10⁻⁵) and with Matsuda index, a measure of insulin sensitivity120 (P = 7.2 x 10⁻⁵) (Table 2.16), and EIF4G2 was not associated with BMI (Table 2.15), suggesting that this gene may affect these traits. EIF4G2 is thought to play a role in the interferon gamma-induced cell death pathway121. Association between adipose gene expression level and clinical traits provides an additional line of evidence that changes in expression of the colocalized genes may influence quantitative traits and disease risk.
Mediation analysis
multiple traits in some cases, leading to more potential mediations than colocalized signals. Of 348 potential mediations, 90 (25.9%) showed evidence of gene expression mediating the effect of an association signal on a trait (the 95% CI of a mediation effect, ME, does not include 0; Table 2.17). We focused on signals with nominal evidence of the combined effect of mediation and a direct effect of the GWAS variant on the trait (P < 0.05, Table 2.18). Of these, at least four loci have functions relevant to cardiometabolic traits. For example, at a well-characterized GWAS locus for adiponectin levels, adipose expression level of CDH13, which encodes a receptor for high molecular weight adiponectin multimers122, mediates the effect of rs12051272 on plasma adiponectin levels (ME = 0.34; CI [0.086, 0.63]). At another GWAS locus, MLXIPL, also known as ChREBP, mediates the variant effect on triglyceride levels (ME = -0.12; CI [-0.21, -0.40]). In adipose tissue, MLXIPL has been shown to regulate glucose homeostasis and fatty acid synthesis123. In addition, RSPO3 mediates the effect of rs72959041 on triglycerides (ME = -0.12; CI [-0.21, -0.043]), and RSPO3 activates the Wnt/b-catenin pathway which promotes
angiogenesis124, suggesting a potential role in the expansion of adipose tissue. Finally, JAZF1 mediates the effect of rs1708302 on BMI (ME = 0.17; CI [0.059, 0.30]); in adipocytes, overexpression of JAZF1 inhibits lipid accumulation and regulates lipid metabolism125. In addition to these well characterized loci, expression level of CATSPERZ, also known as TEX40, mediates an association with BMI (ME= -0.23; CI 0.44, -0.065]), and expression level of ADH1A mediates an association with WHR (ME= -0.01; CI [-0.016, -0.005]). CATSPERZ encodes a calcium ion channel and ADH1A encodes a member of the alcohol dehydrogenase family; while neither gene has yet been directly linked to body size or fat
distribution, these mediation results support the eQTL colocalization and suggest that these genes play a role in obesity.
Discussion
GWAS signals), and T2D (8% of GWAS signals). Additional integration of clinical trait information from the eQTL study participants through gene-trait association and mediation analysis provided further support of a role for these genes in cardiometabolic trait variation.
While GWAS have successfully identified thousands of genomic regions associated with cardiometabolic diseases and complex traits, the genes and mechanisms responsible for many of these loci remain unknown. Identifying candidate transcripts for GWAS loci is relatively straightforward when one of the lead GWAS variants is predicted to cause a loss of gene function, but identifying candidate genes with a testable link to function is more ambiguous when all candidate GWAS variants are
noncoding. Colocalized eQTL signals provide one of several approaches to identify reasonable candidate genes126,127. The value of eQTLs derives from the low prior probability that GWAS variants will by chance also be functional variants associated with a gene’s expression level. For our main colocalization
analysis, we assumed that candidate functional variants would be among those that show the strongest association with both a GWAS trait and gene expression level. Consistent with widespread evidence that expression levels of most genes are regulated by genetic variants128, 31% of lead GWAS variants in this study showed nominal evidence of association (FDR < 1%) with expression levels of at least one transcript. Further evaluation of signal colocalization using one or more methods65–69is critical, because here only 1.3% of the associations showed the identical lead variant to be associated with both the GWAS and gene expression traits. Interpretation of colocalization can be challenging as comparison of signals is affected by sampling heterogeneity, the presence of multiple and/or differing GWAS and eQTL signals per locus, and differences in LD patterns between GWAS and eQTL study participants.
Colocalization methods are imperfect and sensitive to the thresholds applied. In the LD and conditional analysis approach, we applied a threshold for LD between the GWAS variant and the eSNP as well as a threshold for evidence of association after conditional analysis. These thresholds are arbitrary and sensitive to the strength of the original eQTL signal, the use of lead variants subject to sampling variability, and a conditional analysis step that requires individual-level data. In comparison, coloc2 requires setting prior probabilities and thresholds for interpreting posterior probabilities and is sensitive to the presence of multiple signals in either the eQTL or the GWAS data. Further development of colocalization methods may improve the use of eQTLs for identifying candidate genes for GWAS loci.
We provide evidence for cross-ancestry GWAS-eQTL colocalizations and demonstrated the importance of evaluating colocalization using the LD structure of the eQTL study population. When the lead variants for the GWAS and eQTL studies are the same or in high LD in both populations,
colocalization is straightforward. At these loci, conditional analysis showed evidence of colocalization. However, when the LD structure differs substantially between populations, closer comparison of the patterns of association in GWAS and eQTL data is required to ensure that the conclusion of colocalization is warranted. The results of colocalization across populations can be influenced especially when the pattern of association is broader due to LD in one population than another and the selection of a different lead variant within the set of highly associated variants would result in high LD between the GWAS variant and eSNP in both ancestries. Although some loci can be compared cleanly across ancestries, as eQTL studies in more diverse populations become available, comparing GWAS and eQTL signals within ancestries will likely provide stronger evidence of colocalization.
further tested for effects of the variants mediated through gene expression on the GWAS trait or a related trait. The six highlighted mediations (Table 2) show not only an association between these variant, gene, and trait, but also a directional, and potentially causal, path. This mediation analysis method is limited by statistical power because it uses only the hundreds of individuals with expression data to detect an effect of the genotype on the trait, whereas thousands of samples were used to originally detect these
associations in GWAS studies. To mitigate this limitation, we confined our analysis to established GWAS loci and required the combined effect of the genotype on the trait and the mediation to be significant. The results of both gene-trait associations and mediation analysis can be used to guide efforts in functional tests of genes for mechanistic effects on cardiometabolic traits.
The 318 candidate genes identified here correspond to GWAS loci across a broad range of cardiometabolic traits. These genes may act to influence obesity, diabetes, and cardiovascular traits and should be prioritized for future functional analysis. As larger subcutaneous adipose data sets become available in diverse ancestries, multiple eQTL signals will become easier to identify and colocalize with GWAS signals from across populations.
Acknowledgements
whole blood, and EBV-transformed lymphocytes identified using DESeq2 are shown.
Figure 2.4: eQTL effect sizes for variants located in adipose tissue ATAC-seq peaks or
Figure 2.5: Cardiometabolic GWAS and eQTL colocalizations, stratified by trait: Each point
Figure 2.6: Extended Cloud City plots of cardiometabolic GWAS and eQTL colocalizations,
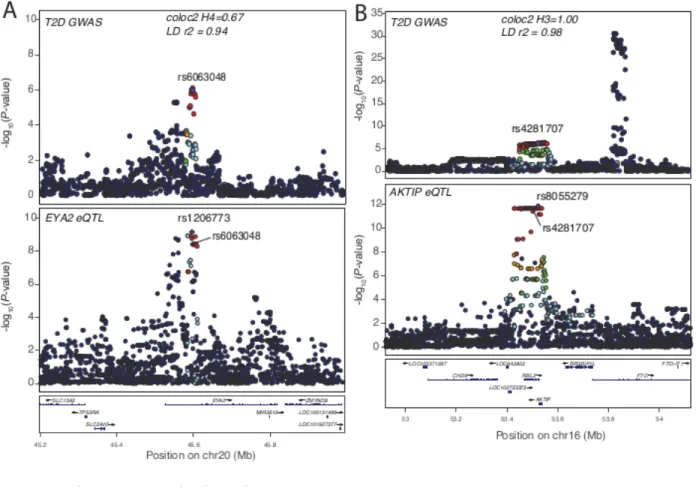
Figure 2.8: Comparison of GWAS and eQTLs found not to be colocalized by coloc2:
Locus plots showing the regional associations for GWAS (top) and gene expression level (bottom) results. (A) The EYA2 eQTL is colocalized with T2D by LD and reciprocal conditional analysis (LD r2=0.94, Pcond= 0.058), but the posterior probability that they were colocalized is more marginal
Abbreviation Metabolic trait Mean± standard deviation Median (25th, 75th percentile)
Age Age (years) 54.6 ± 5.3 54.0 (51.0, 58.5)
BMI Body mass index (kg/m2) 26.6 ± 3.5 26.1 (24.4, 28.4)
WHR Waist-to-hip ratio 0.96 ± 0.06 0.96 (0.92, 1.00)
WC Waist circumference (cm) 96.6 ± 10.3 95.0 (90.0, 102.0)
HIP Hip circumference (cm) 100.8 ± 7.0 100.0 (96.0, 104.0)
FFMASS Fat-free mass (%) 78.8 ± 5.1 79.2 (76.3, 82.0)
FFA Fasting plasma free fatty acid (mmol/l) 0.35 ± 0.13 0.33 (0.25, 0.43)
TG Total triglycerides (mmol/l) 1.37 ± 0.93 1.16 (0.87, 1.59)
CHOL Total cholesterol (mmol/l) 5.50 ± 0.89 5.40 (4.88, 6.07)
LDL-C LDL cholesterol (mmol/l) 3.48 ± 0.77 3.42 (2.96, 3.96)
HDL-C HDL cholesterol (mmol/l) 1.50 ± 0.38 1.45 (1.21, 1.70)
Adiponectin Plasma adiponectin (ug/ml) 7.44 ± 3.55 6.70 (5.00, 9.00)
Matsuda Matsuda composite insulin sensitivity index (mg/dl, mU/l) 7.52 ± 3.97 6.81 (4.33, 9.98) HOMA-B Insulin resistance index based on homeostasis assessment 66.8 ± 41.3 54.1 (40.7, 80.8)
Glucose Fasting plasma glucose (mmol/l) 5.71 ± 0.47 5.70 (5.40, 5.95)
Insulin Fasting plasma insulin (mU/l) 44.1 ± 29.3 34.8 (24.6, 54.6)
Proinsulin Fasting plasma proinsulin (pmol/l) 12.9 ± 6.38 11.5 (8.70, 15.2)
HbA1c Blood glycated HbA1c (%) 5.64 ± 0.31 5.60 (5.40, 5.80)
SBP Systolic blood pressure (mm Hg) 133.3 ± 14.7 132.0 (122.0, 140.7)
DBP Diastolic blood pressure (mm Hg) 86.9 ± 8.80 86.7 (80.7, 92.7)
CRP High sensitivity C-reactive protein (mg/l) 2.15 ± 5.20 0.99 (0.46, 2.18) IL1RA Interleukin-1 receptor antagonist (pg/ml) 200.4 ± 145.9 167.0 (126.4, 225.5)
GFR Glomerular filtration rate 0.091 ± 0.01 0.089 (0.082, 0.098)
TotFA Total fatty acids (mmol/l) 14.4 ± 3.28 13.7 (12.1, 16.0)
T2D & IGT Type 2 diabetes & Impaired glucose tolerant (count) 32
NGT Normal glucose tolerant (count) 355
Table 2.1: Characteristics of the METSIM study participants in 434 sample subset This table contains the trait characteristics of 434 samples from the METSIM study. An extended version of this table is available in Raulerson CK et al. (AJHG 2019).
n=550, >0% adipose (P < 6.07e-4) n=434, >50% adipose (P < 6.06e-4) n=387, >75% adipose (P < 3.79e-4) Number
of PEER
factors 20 40 60 80 20 40 60 80 20 40 60 80
#
variant-gene pairs 2.55M 2.74M 2.82M 2.86M 2.74M 2.95M 3.02M 3.05M 2.30M 2.45M 2.50M 2.50M # variants 1.40M 1.48M 1.51M 1.53M 1.49M 1.57M 1.60M 1.61M 1.29M 1.35M 1.38M 1.38M # genes 15,999 16,286 16,356 16,393 15,788 16,043 16,135 16,183 14,442 14,600 14,715 14,712 Table 2.2: Comparison of cis-eQTL discovery between sample subsets cis-eQTL discovery statistics reported for chr 1-22 based on FDR<5% calculated from FastQTL permutation test and qvalue package. Analyses were based on 21,735 genes and 7.8M variants (hg19, GENCODE v19 comprehensive, Haplotype Reference Consortium-imputed genotypes with MAF > 1%). The number of variant-gene pairs and variants are displayed in the millions (M).
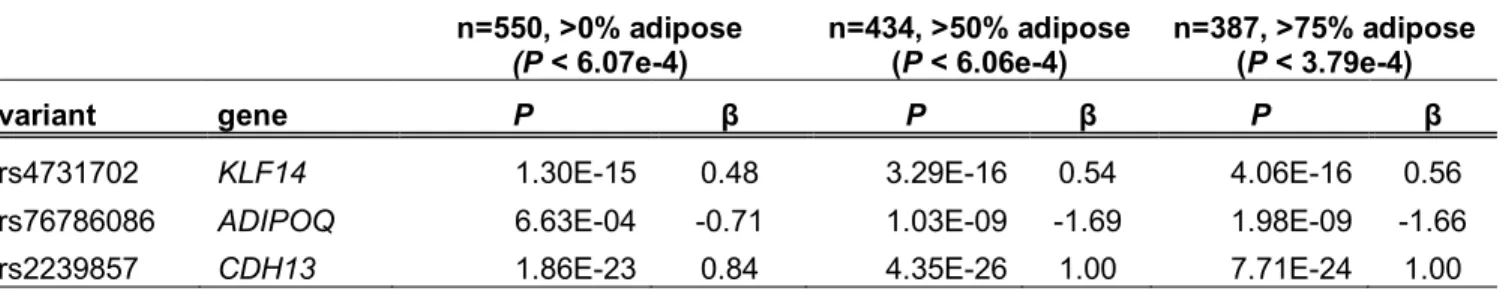
Table S2.3: Comparison of known adipose cis-eQTLs between sample subsets Results for the same variant-gene pair in the three sample subsets. These eQTL genes were identified in Civelek et al. (2017). The named variant (column A) was the lead variant in each subset except for CDH13 and n=550, where it was the second best variant, which is in high LD with the identified lead. Thresholds match the FDR < 5% in each sample set.
n=550, >0% adipose
(P < 6.07e-4)
n=434, >50% adipose (P < 6.06e-4)
n=387, >75% adipose (P < 3.79e-4)
variant gene P β P β P β
rs4731702 KLF14 1.30E-15 0.48 3.29E-16 0.54 4.06E-16 0.56
rs76786086 ADIPOQ 6.63E-04 -0.71 1.03E-09 -1.69 1.98E-09 -1.66
rs2239857 CDH13 1.86E-23 0.84 4.35E-26 1.00 7.71E-24 1.00
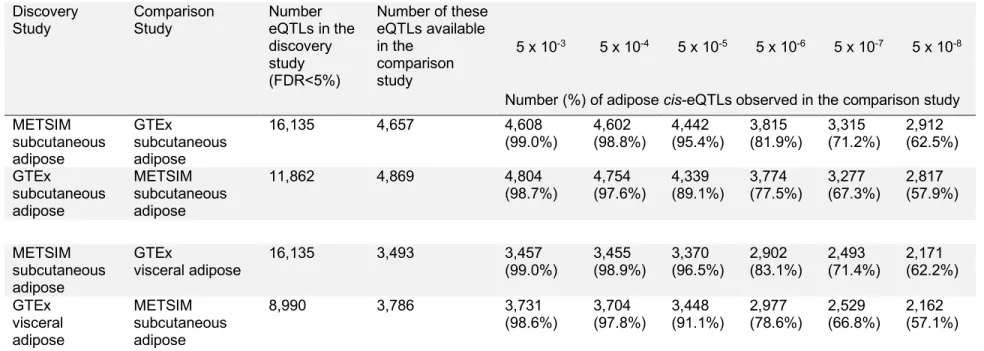
Table 2.4: Replication of lead eQTLs between METSIM and GTEx The number of eQTLs in each discovery study is counted by the number of genes with at least one significant eSNP. The numbers of cis-eQTLs observed are shown at various p-value thresholds requiring the same
direction of effect. The percent of eQTLs that matched the direction of effect from the discovery study is based on the number of SNPs available in both studies. Variants in GTEx were only reported at the FDR<5% threshold.
P-value Threshold Discovery
Study Comparison Study Number eQTLs in the discovery study (FDR<5%)
Number of these eQTLs available in the
comparison study
5 x 10⁻³ 5 x 10⁻⁴ 5 x 10⁻⁵ 5 x 10⁻⁶ 5 x 10⁻⁷ 5 x 10⁻⁸
Number (%) of adipose cis-eQTLs observed in the comparison study
METSIM subcutaneous adipose
GTEx subcutaneous adipose
16,135 4,657 4,608
(99.0%) 4,602 (98.8%) 4,442 (95.4%) 3,815 (81.9%) 3,315 (71.2%) 2,912 (62.5%) GTEx
subcutaneous adipose
METSIM subcutaneous adipose
11,862 4,869 4,804
(98.7%) 4,754 (97.6%) 4,339 (89.1%) 3,774 (77.5%) 3,277 (67.3%) 2,817 (57.9%)
METSIM subcutaneous adipose
GTEx
visceral adipose 16,135 3,493 3,457 (99.0%) 3,455 (98.9%) 3,370 (96.5%) 2,902 (83.1%) 2,493 (71.4%) 2,171 (62.2%)
GTEx visceral
adipose
METSIM subcutaneous adipose
8,990 3,786 3,731
(98.6%) 3,704 (97.8%) 3,448 (91.1%) 2,977 (78.6%) 2,529 (66.8%) 2,162 (57.1%)
eQTL set Genomic Annotation ! Confidence Interval
P
First Signals All ATAC peaks 2.53 2.48 2.58 < 2e-308
Second Signals All ATAC peaks 2.17 2.08 2.27 < 2e-308
GWAS-Coincident First Signals All ATAC peaks 3.20 2.93 3.49 7.40E-111 First Signals ATAC peaks in Enhancers 2.01 1.93 2.09 < 2e-308 Second Signals ATAC peaks in Enhancers 1.84 1.68 1.99 7.40E-119 GWAS-Coincident First Signals ATAC peaks in Enhancers 2.67 2.31 3.00 1.20E-52 First Signals ATAC peaks in Promoters 2.83 2.77 2.89 < 2e-308 Second Signals ATAC peaks in Promoters 2.52 2.41 2.63 < 2e-308 GWAS-Coincident First Signals ATAC peaks in Promoters 3.47 3.18 3.76 6.80E-124 First Signals ATAC peaks in Stretch Enhancers 2.12 2.00 2.23 1.90E-271 Second Signals ATAC peaks in Stretch Enhancers 1.93 1.70 2.14 3.50E-65 GWAS-Coincident First Signals ATAC peaks in Stretch Enhancers 2.75 2.28 3.17 6.80E-34 First Signals ATAC peaks in Typical Enhancers 1.82 1.69 1.95 5.00E-161 Second Signals ATAC peaks in Typical Enhancers 1.72 1.46 1.96 2.90E-42 GWAS-Coincident First Signals ATAC peaks in Typical Enhancers 2.28 1.69 2.80 4.70E-16
First Signals Roadmap Enhancers 1.68 1.64 1.73 < 2e-308
Second Signals Roadmap Enhancers 1.45 1.37 1.53 5.60E-277
GWAS-Coincident First Signals Roadmap Enhancers 2.81 2.48 3.17 4.50E-59
First Signals Roadmap Promoters 2.46 2.41 2.51 < 2e-308
Second Signals Roadmap Promoters 2.11 2.02 2.19 < 2e-308 GWAS-Coincident First Signals Roadmap Promoters 3.06 2.78 3.35 2.70E-97
First Signals Stretch Enhancers 1.38 1.31 1.44 < 2e-308
Second Signals Stretch Enhancers 1.31 1.20 1.41 3.50E-132
GWAS-Coincident First Signals Stretch Enhancers 2.42 2.14 2.70 1.60E-64 First Signals Typical Enhancers 1.81 1.75 1.87 < 2e-308
Second Signals Typical Enhancers 1.58 1.47 1.68 1.50E-197
GWAS-Coincident First Signals Typical Enhancers 2.51 2.23 2.78 6.90E-70 Table 2.5: Enrichment in Roadmap adipose nuclei marks and METSIM adipose tissue ATAC-seq
peaksThe top 2,534 primary signals were selected to match the number of lead variants in the secondary
Without adjustment with PEER factors With adjustment for 3 PEER factors
trans-eQTL
eGenes (P < 1e-4)
trans-eQTL eGenes (P < 5e-8)
trans-eQTL eGenes (P < 3.4e-13)
trans-eQTL eGenes (P < 1e-4)
trans-eQTL eGenes (P < 5e-8)
trans-eQTL eGenes (P < 3.4e-13)
> 1Mb > 5Mb > 1Mb > 5Mb > 1Mb > 5Mb > 1Mb > 5Mb > 1Mb > 5Mb > 1Mb > 5Mb
protein-coding 14,902 14,902 12,138 12,106 3,613 3,575 14,902 14,902 11,352 11,304 3,691 3,635 antisense
1,734 1,734 1,306 1,300 363 357 1,734 1,734 1,216 1,211 347 340
lincRNA 1,357 1,357 1,043 1,035 266 260 1,357 1,357 986 976 244 237 other
560 560 425 423 155 151 560 560 399 394 150 146
total
18,553 18,553 14,912 14,864 4,397 4,343 18,553 18,553 13,953 13,885 4,432 4,358 Table 2.6: Trans-eQTL discovery at three significance thresholds eGenes are reported if at least 1 variant > 1 Mb (or the subset > 5 Mb) away
from the transcription start site shows significant eQTL association. P < 1e-4 is equivalent to the p-value with and FDR of < 5% using the Storey
method in Small et al. Nat Gen 2018 (PMID 29632379). P < 5e-8 is an approximate genome-wide threshold. P < 4.66e-9 is equivalent to the
p-value with an FDR < 5% using the Benjamini Hochberg method. Analyses were based on 18,553 genes and 7.8M variants (hg19, GENCODE v19
comprehensive excluding psuedogenes and genes with low mappability, Haplotype Reference.