ESSAYS ON FINANCE AND LABOR
Wenting Ma
A dissertation submitted to the faculty of the University of North Carolina at Chapel Hill in par-tial fulfillment of the requirements for the degree of Doctor of Philosophy in the Department of
Economics.
Chapel Hill 2019
c
2019
Wenting Ma
ABSTRACT
WENTING MA: ESSAYS ON FINANCE AND LABOR. (Under the direction of Paige P. Ouimet and Neville Francis)
My dissertation applies different empirical methodologies with a variety of administrative datasets to investigate the interrelationship between firms and labor market outcomes. Chapter 1 examineshowandwhymarket power affect wages differently in financial industries. Increasing industry concentration has raised concerns that declining competition among firms for labor has led to slow wage growth. However, I find that finance wages have increased by almost three times the increase in non-finance wages, despite similar trends in market concentration. Using data from the U.S. Census, I construct measures of firm-specific market power and show that higher mar-ket power is associated with significantly higher wages in finance than in non-finance. I provide evidence that rent-sharing plays an essential role in driving the more pronounced effect of mar-ket power on finance wages for two reasons. First, financial firms with higher marmar-ket power can extract relatively higher rents to share. Second, financial firms give a relatively higher share of rents to workers, especially high-skill workers, due to relatively higher worker bargaining power. As rents are disproportionally distributed to high-skill workers, financial firms with higher market power are associated with relatively higher within-firm inequality.
findings in M&A impacted establishments as compared to a matched sample of control establish-ments. These results generalize within industries, suggesting M&A activity is an important driver of economy-wide trends in job polarization and income inequality.
ACKNOWLEDGMENTS
I am deeply indebted to my tremendous advisors, Paige Ouimet and Neville Francis. Thank you for being supportive of my research, for encouraging me to pursue my career goals and for working actively to help me achieve those goals. Thank you!
I would like to thank Elena Simintzi, Patrick Conway and Valentin Verdier for serving as my committee members. I also want to recognize Rebecca Zarutskie, Tania Babina, Xingxing Wang, Yunzhi Hu, Jessie Davis, Andrei Concalves, Gill Segal, Andrew Yates, Lutz Hendricks, Fei Li, Peter Hanson, Dragana Cvijanovic, Stan Rabinovich, Jacob Sagi, and James Carlton Ingram for all their help.
TABLE OF CONTENTS
LIST OF TABLES . . . ix
LIST OF FIGURES . . . xii
1 Market Power, Finance Wages and Inequality . . . 1
1.1 Introduction . . . 2
1.2 Data . . . 7
1.2.1 Datasources . . . 7
1.2.2 Sample Construction . . . 9
1.2.3 Define Firm Industry and Finance Firms . . . 10
1.2.4 Industry Concentration and Firm Market Power . . . 11
1.2.5 Summary Statistics . . . 13
1.3 Empirical Analysis . . . 15
1.3.1 Concentration and Average Wages . . . 15
1.3.2 Firm Market Power and Finance Wages . . . 16
1.4 Exploring the Mechanism . . . 20
1.4.1 Evidence on Higher Rents in Finance . . . 21
1.4.2 Evidence on Higher Bargaining Power in Finance . . . 23
1.5 Firm Market Power and Within-firm Inequality . . . 25
1.6 Additional Robustness Checks . . . 26
1.6.1 Local Market Power . . . 26
1.6.3 Import Competition . . . 29
1.6.4 Sorting Effect Based on Worker Characteristics . . . 30
1.7 External Validity . . . 31
1.8 Conclusion . . . 33
2 Mergers and Acquisitions, Technological Change and Inequality (with Paige Ouimet and Elena Simintzi) . . . 49
2.1 Introduction . . . 49
2.2 Data and methodology . . . 54
2.2.1 Data . . . 54
2.2.2 Methodology . . . 58
2.3 Results . . . 58
2.3.1 Baseline results . . . 58
2.3.2 Evidence concerning mechanisms . . . 61
2.3.3 Investment in IT . . . 64
2.3.4 Identification concerns . . . 66
2.3.5 External validity . . . 68
2.4 Industry-level evidence . . . 70
2.4.1 Industry Analysis: Data and summary statistics . . . 70
2.4.2 Industry Analysis: Results . . . 72
2.5 Conclusion . . . 74
3 Entrepreneurial Wages (with Tania Babina, Paige Ouimet and Rebecca Zarutskie) . 89 3.1 Introduction . . . 90
3.2 Why New Firms Pay Lower Wages? . . . 94
3.3 Data . . . 95
3.5 Summary Statistics . . . 99
3.6 Baseline Results . . . 101
3.6.1 OLS Estimation . . . 101
3.6.2 Worker Fixed Effects . . . 101
3.6.3 Individual and Firm Fixed Effects (AKM) . . . 102
3.7 Alternative Samples . . . 105
3.7.1 College Educated Employees . . . 105
3.7.2 High Technology Firms . . . 106
3.8 Controlling for Firm Size . . . 106
3.9 Tenure Wage Relationship . . . 107
3.10 Does Worker Quality Matter for New Firm Performance? . . . 108
3.11 Validating AKM Assumptions and Endogenous Mobility . . . 110
3.12 Conclusion . . . 112
A Chapter 1 Appendix . . . 126
A.1 Variable Definitions . . . 126
A.2 Appendix Graphs and Tables . . . 130
B Chapter 2 Appendix . . . 137
B.1 Variable Definitions . . . 137
B.2 Appendix Tables . . . 140
B.3 Industry Mapping Between IPUMs and SDC Data . . . 147
C Chapter 3 Appendix . . . 149
C.1 Appendix Graphs and Tables . . . 149
LIST OF TABLES
1.1 Summary Statistics: Firm Wage Pattern, Market Power and Other Characteristics . . . 37
1.2 Industry Concentration and Firm Wages . . . 38
1.3 Firm Market Power and Wages in Finance . . . 39
1.4 Firm Market Power and Other Measures of Wages . . . 40
1.5 Firm Market Power and Profitability in Finance . . . 41
1.6 Firm Market Power, Price-cost Margins and Efficiency in Finance . . . 42
1.7 Firm Market Power and Wages of High-Skill Workers in Finance . . . 43
1.8 Firm Market Power and Within-firm Inequality in Finance . . . 44
1.9 Firm Local Market Power and Wage Patterns in Finance . . . 45
1.10 Firm Market Power Measured by Sales and Wage Patterns in Finance . . . 46
1.11 Finance vs. construction, transportation and public utilities, and services . . . 47
1.12 Individual Level Regressions: Firm Market Power and Worker Wages . . . 48
2.1 Summary statistics of establishment-level variables . . . 76
2.2 Effects of M&A on establishment routine share intensity . . . 77
2.3 Effects of M&A on establishment high-skill employment . . . 78
2.4 Effects of M&A on establishment average wages . . . 79
2.5 Effects of M&A on establishment wage dispersion . . . 80
2.6 Mechanisms . . . 81
2.7 M&As and investment in IT . . . 83
2.8 Cancelled M&As . . . 84
2.9 Within-establishment labor outcomes . . . 85
2.11 Industry-level analysis: Summary statistics . . . 87
2.12 Industry-level analysis: Baseline results . . . 88
3.1 Summary Statistics for New and Established Firms . . . 117
3.2 Summary Statistics for Workers Who Change and Do Not Change Employers . . . 118
3.3 New Firm Wages for All Workers . . . 119
3.4 New Firm Wages by Firm Age . . . 120
3.5 New Firm Wages for College Educated Workers . . . 121
3.6 New Firm Wages for College Educated Workers at Technology Firms . . . 122
3.7 New Firm Wages After Controlling for Firm Size . . . 123
3.8 Wages by Worker Tenure and Firm Age . . . 124
3.9 New Firm Outcomes as a Function of Worker Fixed Effects from Wage Regressions 125 A.1 Summary Statistics: Public Firm Wage Pattern, Market Power and Other Characteristics . . 131
A.2 Firm Market Power and Wages in Finance (Public Firms Only) . . . 132
A.3 Summary Statistics: Local Market Power and Local Wage Patterns . . . 133
A.4 Offshorability . . . 134
A.5 Summary Statistics: Firm Market Power Measured by Sales and Wage Patterns . . . 135
A.6 External Validity . . . 136
B.1 Robustness: Effects of M&A on establishment routine task intensity . . . 140
B.2 Robustness: Effects of M&A on establishment high-skill employment . . . 141
B.3 Robustness: Effects of M&A on establishment median wages . . . 143
B.4 Robustness: Effects of M&A on establishment wage dispersion . . . 143
B.5 Industries ranked by level of routine share intensity. . . 144
B.7 Robustness: Defining M&A counts using first six years of each decade . . . 146
LIST OF FIGURES
1.1 Trends in Industry Concentration and Wages, 1990-2008 . . . 35 1.2 Wage Patterns and Firm Market Power: Finance vs. Non-finance Industries . . . . 36
3.1 Average Wages and Average Wage Growth by Firm Age . . . 114 3.2 Worker Fixed Effects by Firm Age . . . 115 3.3 Mean Wages of Job Changers Classified by Quartile of Mean Wages of Coworkers
at Origin and Destination Firm . . . 116
A.1 Accessible States in LEHD . . . 130
C.1 Map of the US states available in the LEHD . . . 149 C.2 Mean Adjusted Wages of Job Changers Classified by Quartile of Mean Wages of
CHAPTER 1
MARKET POWER, FINANCE WAGES AND INEQUALITY
Disclaimer
1.1 Introduction
Recent literature documents an important trend in U.S. product markets: increasing concentra-tion. Grullon et al. (2017) show that 75% of U.S. industries have become more concentrated since the 1990s, and the average firm is almost three times larger. One potential concern with this rise in industry concentration is that it reduces workers’ employment options, and thus gives employers the ability to lower wages (Manning, 2011; Stiglitz, 2017; Benmelech et al., 2018).1 The finance
sector, however, has been an exception. I observe that from 1990 to 2008, real wages increased by 23.38% in finance but only 8.85% in non-finance. In the same period, the degrees of industry concentration as measured by the Herfindahl-Hirschman index (HHI) increased by roughly 40% in both finance and non-finance. These novel findings indicate that market concentration may not have the same wage dampening effect in the financial sector, suggesting a more nuanced under-standing of the effects of concentration on wages and the finance wage premium.
Why does concentration impact finance wages differently? In this paper, I argue that rent-sharing plays an essential role in driving the difference. Industry concentration increases the mar-ket power of firms, especially larger firms within a given industry. An increase in firms’ marmar-ket power not only increases firms’ labor market monopsony power to lower wages by decreasing competition for hiring workers, but also increases firms’ product market monopoly power by de-creasing competition for selling products or buying inputs. With higher product market monopoly power, firms can charge higher markup and thus extract higher rents. Wages rise when firms share
1This concern was raised in the Council of Economic Advisers Issue Brief (2016). The similar
these rents with their workers.2 Therefore, higher market power is associated with two compet-ing effects on wages: rent-sharcompet-ing effect and labor monopsony effect. In finance, the rent-sharcompet-ing effect appears to dominate the labor monopsony effect, and the net effect is relatively stronger. To support this argument, I propose and provide empirical evidence on two non-mutually exclu-sive mechanisms. First, financial firms with higher market power can extract relatively higher rents, and thus they have more to share with employees. Under this scenario, financial firms’ prof-itability responds more positively to the increase in firm market power relative to non-financial firms. Second, financial firms may have to give a larger fraction of rents to employees, especially high-skilled workers, due to higher worker bargaining power. Under this scenario, the wages of high-skilled workers in finance respond more positively to an increase in firm market power as compared to those in non-finance.
Using administrative micro-level data from the U.S. Census, this paper first examines the rela-tion between wages and industry concentrarela-tion, and whether the relarela-tionship differs in finance. I find that concentration measured by HHI is negatively correlated with wages in non-finance indus-tries. By contrast, HHI is positively correlated with wages in finance, and the positive correlation is statistically significant at 1% level. These findings are robust to various measures of industry concentration, indicating that industry concentration has different implications in finance.
While industry concentration means higher market power for firms remaining in the industry on average, previous studies argue that concentration disproportionally benefits larger players within industries. Relative to small players in a given industry, larger firms have higher market power to raise prices or lower input prices and thus make higher rents. In other words, market power should be firm-specific and dependent on the firm’s market share, implying that rents increase with firm size within industries (Shepherd, 1972; Porter, 1979). With more rents, firms with higher market
2Previous literature provides evidence that firms share rents with their workers. For example, Blanchflower et
power can afford higher wages on average as compared to firms with lower market power within a given industry. Using this within-industry variation, I next conduct firm-level cross-sectional analysis to examine how the relationship of firm-specific market power and wages in finance is different from that in non-finance.
As the baseline, a firm’s market power is defined as its employment share in its industry.3 The
main result of this paper is that higher firm market power is associated with significantly higher wages in finance than that in non-finance. This result holds when controlling for a battery of factors that are likely to drive the heterogeneity of wage-setting behaviors across firms. Also, this result holds for defining firms’ market by either two-digit or three-digit Standard Industry Classification (SIC). The difference between finance and non-finance is still significant if I instead look at median wages, average wages adjusted by cost of living, and average wages of male or female workers.
I next provide evidence for two non-mutually exclusive mechanisms that can explain why the positive relationship between firm market power and wages is stronger in finance. First, I argue that financial firms with higher market power can extract relatively higher rents as compared to non-financial firms. Market power may be particularly valuable in finance due to a stronger belief in “too big to fail, ” or less geographical restrictions for allocating resources. For example, the “too big to fail ” argument suggests that larger financial firms are more likely to be supported by the government when they face potential failure, and thus they can borrow at a much lower cost than smaller financial firms who must borrow based on their creditworthiness (Baker et al., 2009). Because financial firms can extract relatively higher rents with higher market power, they have more to share with workers. In support of this mechanism, I find that firms with higher market power exhibit higher profitability measured by return on assets (ROA) in finance relative to non-finance.4
3This measure is used by the courts as a primary criterion to assess the existence of monopoly power in a given
product market. See chapter 2 in “Competition and Monopoly: Single-Firm Conduct Under Section 2 of the Sherman Act” by Department of Justice for more details.
4Barber and Lyon(1996) show that ROA is a better measure than other profitability measures in detecting abnormal
To further investigate the sources of the additional profitability created by firm market power in finance, I decompose ROA into two components: the Lerner Index and the Asset Utilization ratio. The Lerner Index (or price-cost margin) has been widely used in the literature as a proxy for the extent to which prices exceed marginal costs (e.g., Muller et al., 2017; Aghion, 2005; Grullon et al., 2017). The asset utilization ratio captures operational efficiency (Grullon et al., 2017). Results show that financial firms can generate relatively higher profitability with higher market power because they are able to charge significantly higher price-cost margins relative to non-financial firms.
Second, compared to non-financial firms, financial firms may have to give a higher proportion of their rents to workers due to higher worker bargaining power. This mechanism should apply especially to high-skilled workers in finance because they are more likely to be matched with larger scale tasks, or high external visibility of their performance increases the probability of being poached. I find that a one standard deviation increase in firm market power is associated with 1.7% higher average wages for high-skill workers in non-financial firms, whereas the effect is 6.37% in finance, which can be translated into $1468 per quarter. The results are robust to various definitions of high-skill workers.
As a consequence of rents being disproportionally distributed to high-skilled workers within firms, I find that financial firms with higher market power exhibit higher within-firm inequality, especially among male workers, as compared to non-financial firms.
finance wages still have the highest sensitivity to market power when compared with wages in non-finance industries facing low import exposure. This result helps alleviate the concern that market power measured by domestic share is less valuable in non-finance because non-finance firms face higher import competition. Lastly, I conduct individual-level analysis while controlling for indi-vidual time-varying and time-unvarying quality. I continually find higher firm market power is associated with significantly higher wages in finance as compared to non-finance, which alleviates the concern that my results could be explained by sorting effect based on worker quality.
My paper builds on several bodies of literature. First, it builds on the literature on market con-centration and its potential effects on wages. Much of this literature focuses on non-finance sectors, and a discussion onhowandwhyconcentration plays a differential role in finance wages has been missing. Weiss (1966) shows that wages are higher in more concentrated industries. However, the relationship is no longer significant and positive after controlling for personal characteristics, and the results only hold within manufacturing, transportation, and utility industries. Landon (1970) finds higher concentration in the newspaper industry is associated with lower wages. More re-cently, Autor et al. (2017) document higher industry concentration is associated with lower labor share. However, they do not find a significant relationship between concentration and wages in manufacturing. Benmelech et al. (2018) use U.S. manufacturing data to show that employer con-centration increases firms’ labor monopsony power, thus lowering wages. This study contributes to the literature by uncovering the differential role of market power on finance wages. I further provide evidence that rent-sharing can help explain the difference. Meanwhile, this study also contributes to the literature by showing that higher firm market power has different effects on the wages of different skill-level workers, thus contributing to higher within-firm inequality.
in finance, these factors cannot fully explain the surge of finance wage premium (Philippon and Reshef, 2012; Bohm, Metzger and Stromberg, 2018). Building on previous literature, my paper provides a more nuanced understanding of finance wage premium through the lens of firms. Using U.S. employer-employee matched data, I show that higher market power is associated with higher wages in finance because market power is associated with a stronger rent-sharing effect in finance. My results suggest that firm market power can help explain the finance wage premium.
This paper also builds on the literature that investigates factors affecting within-firm inequality. Muller, Ouimet, and Simintzi (2017) examine UK data and find that, on average, larger firms have high pay inequality. Consistent with their finding, my results show firms with relatively larger sizes in a given industry exhibit higher pay inequality. My study further shows that firms that are relatively larger in finance industries are associated with even higher within-firm inequality because rents are disproportionally distributed to finance high-skilled workers who have relatively higher worker wage bargaining power. Ma, Ouimet, and Simintzi (2018) document that mergers and acquisitions (M&A) act as the catalyst for firm technology adoption, which in turn leads to an increase in inequality within target establishments. Instead of looking at how firm reorganization affects the wage distribution within the firm, my paper shows that the variation in firm market power can explain the heterogeneity of within-firm inequality.
1.2 Data
In this section, I start with reviewing multiple data sources used in this study and describing how I combine them to construct the baseline sample. I then describe how firms’ industry and financial firms are defined. At the end of this section, I construct the measures of industry concen-tration and firm market power.
1.2.1 Datasources
I use the LEHD to obtain information on firms’ wage patterns and workforce composition. The LEHD is an employer-employee matched database which tracks employees and their wages with various employers on a quarterly basis.5 Individual wages reported in the LEHD include
all forms of compensation that are immediately taxable, including bonuses and exercised stock options which take a heavyweight in finance sector pay.6 The LEHD also reports age, gender, and
education level of each employee.7 As workers in this program can be linked to their employers, it
allows me to track wage distribution and workforce composition within each employer. The data start in 1990 for several states and coverage of states increases over time. The data coverage ends in 2008. This project has access to 31 states.8 I map these states in Appendix Figure A1. While I do not observe data for all states, I observe almost 100% of private employment for any state in the program. I discuss the consequence of omitting states in section 1.7.
I supplement the information in the LEHD with firm-level information on employment and industry from the LBD.9This database tracks all US business establishments on an annual basis.
An establishment is any separate physical location operated by a firm with at least one paid em-ployee. The LBD includes information on industry, the number of employees and total payroll at each establishment. Also, the LBD contains a unique firm-level identifier which longitudinally links establishments that are part of the same firm. As the LBD tracks all establishments in the U.S., it allows me to measure total domestic employment for each firm and industry by aggregat-ing employment across establishments. In section 1.2.3, I will discuss how I utilize establishment employment and industry to define firms’ industry and identify financial firms.
5See Abowd et al. (2006) for a more detailed description of the LEHD program and the underlying datasets that
it generates.
6Axelson and Bond (2015) show that the financial sector is featured with high reliance on bonuses. Bell and Van
Reenen (2013) use UK data to show the increase in top bankers’ pay is entirely due to increased bonuses.
7Education is imputed for employees with missing education data (Abowd et al. 2006).
831 states include: Arkansas, Colorado, Florida, Georgia, Hawaii, Iowa, Idaho, Illinois, Indiana, Louisiana,
Mary-land, Maine, Minnesota, Missouri, Montana, North Carolina, New Jersey, New Mexico, Nevada, Oklahoma, Oregon, Rhode Island, South Carolina, Tennessee, Texas, Utah, Virginia, Vermont, Washington, Pennsylvania and Wisconsin.
To conduct mechanism tests in section 1.4, I collect firm financial information on earnings before interests, taxes, depreciation and amortization (EBITDA), total sales, and total assets from Compustat.
Lastly, I obtain sales data for firms from the Business Register (BR) database to conduct ro-bustness checks in section 1.5.10 This database collects business sales, including total revenue
from selling products, interest income and gross rents, from the Internal Revenue Service (IRS). It tracks firms from all 50 states and the District of Columbia on an annual basis. A key advantage of the sales data from BR over standard firm-level databases such as Compustat is that they comprise both private and public listed firms.
1.2.2 Sample Construction
The baseline sample is at firm-year-quarter-level and spans from 1990 to 2008. To obtain firm wage patterns and workforce composition, I start with linking filtered employee-level data from the LEHD to firm identifiers in the LBD through federal employer identifier (EIN), and then I aggregate employee-level data to firm-level in each year-quarter.11
Specifically, I restrict my attention to full time workers in the LEHD by only including workers aged between 16 and 65 years old and by excluding employee-quarter that earned less than 80% of the 1990 federal minimum wage following Philippon and Reshef (2012), where wages are con-verted to constant 2001 dollars.12 To ensure that I am not observing quarters in which an employee
was only partially employed at a given firm, I only keep employee-firm quarters where I observe a full quarter of employment at the firm prior to and post that quarter.13
10Before 2002, this database was referred as the Standard Statistical Establishment List(SSEL). See DeSalvo et al.
(2016) for more information about the dataset.
11The matching process between establishments in LBD and units in LEHD is not perfect because the LBD
in-frastructure is based on physical establishments while the LEHD inin-frastructure uses reporting units (SEIN) in a given state for a given firm. SEINs may or may not match the physical establishments identified in the LBD. Therefore, I take firm as the unit of analysis.
1280% of the 1990 federal minimum wage in 2001 dollars is equal to $1923/quarter (=0.8×$3.8/hour ×40
hours/week×12 weeks/quarter×1.318).
13To limit the probability of data errors in the sample, I also drop all observations for individuals where wages
I then link the filtered employee data to firms in the LBD to construct firm-year-quarter-level measures of wage patterns and workforce compositions. Since self-employment may have different wage setting behavior, I exclude firms who only have one paid employee to minimize the possibility of picking up self-employment. I define all the variables used in my analysis, in more detail, in the Appendix.
1.2.3 Define Firm Industry and Finance Firms
Throughout the study, I use the 1987 Standard Industry Classification (SIC) codes to define markets. To define a firm’s market (termed ”firm industry”), I use establishment-level information on SIC and employment from the LBD.14 For a firm owning only one establishment, its industry is defined by its establishment’s industry. For a firm owning multiple establishments spanned multiple industries, the firm is classified in an industry where it has more than 50 percent of its employment. I drop a negligible percentage of firms who span in multiple industries, but their employment share in each industry is less than 50 percent. Following these rules, a firm’s industry is defined by a 2-digit or 3-digit SIC code.15
Following Philippon and Reshef (2012), finance industries include depository institutions (ex-cept central reserve depository institutions), nondepository institutions, security and commodity
14Census uses SIC to define industries until 2002. Starting 1997, Census defines industries using the North
Amer-ican Industry Classification System (NAICS). To get SIC codes for post-2001 observations, I follow Babina (2016) to build a crosswalk between SIC and NAICS codes using LBD data between 1997 and 2001. However, the mapping between SIC and NAICS may not be a one-to-one mapping. Under the case of one NAICS code being matched with multiple SIC codes, I assign the NAICS code with the SIC code used by the most number of establishments to create a one-to-one mapping between NAICS and SIC. For example, NAICS 0001 is matched with SIC 111 for 100 establish-ments, but it is only matched with SIC 112 for 10 establishments. Then I assign establishments in post-2001 classified into NAICS 0001 with SIC 111. If there is a tie in the number of establishments under different SIC’s, then I assign the NAICS code with the SIC with the highest employment.
15The first two digits of SIC codes indicate the major group, and the first three digits indicate the industry group.
brokers, insurance carriers, insurance agents, brokers and service and holding and other invest-ment offices. Non-finance industries include all other nonfarm private industries. For a corporate to be a finance firm, its industry must be in one of the finance industries. Similarly, a firm is clas-sified as a non-finance firm if its industry is in one of the non-finance industries.16 Based on this
classification rules, financial firms account for approximately 4.3% of my baseline sample, which is similar to the statistics reported in the Statistics of U.S. Businesses (SUSB): 4.1% in 2000 and 4.27% in 2008.17
1.2.4 Industry Concentration and Firm Market Power
In this subsection, I construct the measures of industry concentration and firm market power using employment data from the LBD.
To measure the degree of industry concentration, I construct the Herfindahl-Hirschman Index (HHI) as the sum of the squared firm employment shares in industryj in yeary:
HHIj,y = X
f
(empf,j,y
empj,y
)2 (1.1)
whereempf,j,y is employment of firmf in industryj in yeart. empj,y is the total employment in
industryj in year t. I construct two variants of the HHI measures using two- or three-digit SIC industry codes.
As the HHI’s are measured using employment data for almost all private and publicly listed firms in the U.S., they can capture the degree of industry concentration more accurately than the ones constructed using publicly listed firms. Moreover, my measures of HHI cover a wider range of industries and years than the publicly available statistics reported in the Economic Census, where HHI is limited to manufacturing industries in calendar years ending in 2 or 7.18
16To reduce the probability of misclassifying workers into finance industries, I drop a small proportion of firms
which have employment in both finance and non-finance industries. In the unreported results, I find baseline findings are robust to including these firms.
17In the SUSB, a firm is classified into 2-digit NAICS sector in which it paid the largest share of its payroll. See
more details at https://www.census.gov/programs-surveys/susb/technical-documentation/methodology.html
I next define the market power for a firm classified into industryj as the ratio of total employ-ment in firmf in industryj to total employment in industryj:
MarketPowerEf,j,y = empf,j,y
empj,y
×100 (1.2)
where empf,j,y is employment of firm f in industryj in year t. empj,y is the total employment
in industryj in yeart. E represents this market power measure is constructed using employment data. I construct two variants of the firm market power measures using two or three-digit SIC codes to define industries.
A firm’s market power can be interpreted as its ability in extracting rents. The measure of firm market power is constructed following the argument of Shepherd (1972) that market power is firm-specific and it depends on the firm’s market share. Relative to other firms within the same market, firms with higher market share are expected to extract higher rents because they have the higher bargaining power to lower input prices, they can take advantage of economies of scale, or they have higher monopoly power in raising prices. This measure has been used by courts as a primary criterion to assess the existence of monopoly power in a specific product market because measuring market power using firm-level markup is notoriously difficult.19 20
Measures constructed in this section are at annual-level since the LBD reports employment as of March 12th in each year. To create a quarterly panel, I then link these measures in the yearyto quarterly measures of firm workforce composition and wage patterns in the first three quarters of yearyand the last quarter of yeary−1.
https://www.census.gov/econ/concentration.html
19See chapter 2 in ”Competition and Monopoly: Single-Firm Conduct Under Section 2 of the Sherman Act” by
Department of Justice for more details. Other examples mentioned in this article are: U.S. Anchor Mfg., Inc. v. Rule Indus., Inc., 7 F.3d 986, 999 (11th Cir. 1993) (”The principal measure of actual monopoly power is market share...”); Weiss v. York Hosp., 745 F.2d 786, 827 (3d Cir. 1984) (”A primary criterion used to assess the existence of monopoly power is the defendant’s market share.”).
20Measuring firm-level markup requires detailed information on product prices, quantities produced, characteristics
1.2.5 Summary Statistics
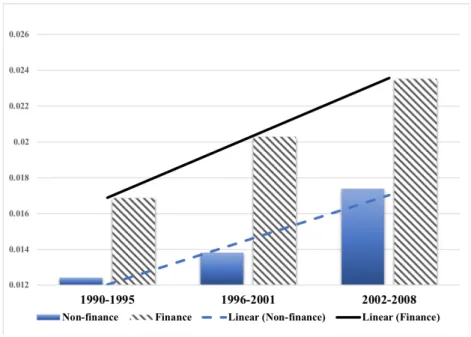
1. Trends in Concentration and Wages: Finance vs. Non-finance. Figure 1a plots trends of the Herfindahl-Hirschman Index(HHI) constructed by Equation (1) using 3-digit SIC. The computed HHI is averaged across industry-year cells within each of the six-year periods (the last period includes seven years, 2002-2008) using the number of employees in each cell as the weight. The average HHI can be interpreted as the degree of employer concentration the average worker faces in the finance or non-finance industries. On average, the employer concentration keeps increasing since 1990 in both finance and non-finance industries. Specifically, the average HHI concentration measure has increased by approximately 39.56% in finance, and by about 40.16% in non-finance.21 Figure 1b plots trends of average real wages computed in finance and non-finance industries. The computed average wage is averaged across firm-year-quarter cells within each of the six-year periods (the last period includes seven years, 2002-2008) using the number of employees in each cell as the weight. Figure 1b shows stronger growth in real wages in finance over 1990-2008: real wages on average have increased by 23.38% in finance, whereas the increase is only 8.95% in non-financial industries within the sample. By looking at changes, figure 1a and 1b show that the increase in finance wages is around 2.6 times than the increase in non-finance wages while the changes in concentration are similar in the financial and non-financial industries. These results indicate that industry concentration creates less wage dampening effect on finance wages.
2. Cross-sectional Summary Statistics. Table 1.1 reports summary statistics of firm-level vari-ables from the baseline sample. Column 1 reports mean values along with standard deviation in parentheses calculated across all firm-quarter within the sample. Column (2) and (3) report mean values calculated for non-finance and financial firms respectively. The last column reports the difference between columns (3) and (2) along with statistical significance-level. Panel A re-ports summary statistics of firm-level wage patterns, and Panel B rere-ports other firm characteristics including measures of firm market powers and workforce composition respectively.
Panel A shows that the quarterly average wage in finance is $10914 within the sample, which is 24% higher than the one in non-finance. Moreover, the average wage of high-skilled workers is 34.16% higher in finance. Compared to existing literature, I document a lower finance excess wage due to:1) the calculated wage is averaged across workers from the LEHD. However, the coverage of the LEHD data used in this study only extends to 31 states, and thus I may underestimate average finance wages by excluding workers working in excluded states such as New York and Connecticut where excess wages paid by financial firms are even higher (Philippon and Reshef, 2012). 2) The frequency of my baseline sample is quarterly. The excess wages paid by financial firms, which is mainly driven by bonuses (Bell and Van Reenen, 2013), may be smoothed out by taking averages across quarters. 3) Based on my firm classification rules described in section 1.2.3, I drop firms spanning in both financial and non-financial industries. I also drop firms which are too diversified to be classified into one single industry. Applying these filters exclude some diversified and large firms which pay higher wages (Oi and Idson,1999). I discuss the consequences of these restrictions in Section 1.7.
Panel B shows that, on average, firm market power constructed by equation (2) using two-digit (three-two-digit) SIC industries is 0.002 percentage points (0.011 percentage points) with a stan-dard deviation of 0.05 percentage points (0.193 percentage points) for all firms within the sample. Among financial firms, the average of their market powers in two-digit (three-digit) SIC industries is 0.003 percentage points (0.014 percentage points) which is slightly higher than the average of non-financial firms by 0.001 percentage points (0.003 percentage points).
on average is consistent with the labor force statistics reported by the Bureau of Labor Statistics.22 1.3 Empirical Analysis
1.3.1 Concentration and Average Wages
Trends presented in Figure 1 indicate that industry concentration affects finance wages differ-ently, but the difference can be driven by other factors varying across industries. This subsection conduct a cross-sectional analysis to estimate the difference between finance and non-finance in the correlation of concentration and average wages with controlling for other observed and un-observed factors. At one extreme, firms in more concentrated industries may extract higher rents by exercising product market monopoly power, and wages should rise when firms share these rents with workers (rent-sharing effect). Alternatively, workers in a more concentrated industry may face fewer outside options in the industry. In this case, firms have labor market monopsony power to lower wages (labor monopsony effect). The relationship between industry concentration and wages depends on the relative strength of rent-sharing effect and labor monopsony effect in a given industry.
To examine the relation between industry concentration and average wages, I estimate the following cross-sectional regression:
logWagef,j,t =αt+γ1HHIj,t−4+γ2FINf +γ3FINf ×HHIj,t−4 +X 0
f,j,t−4β+f,j,t (1.3)
wherelogW agef,j,t is the log of average wages in firmf, operating within industryj, in
year-quarter t. HHIj,t−4 is the four-quarter lagged measure of concentration in industry j; F INf is
equal to 1 if the firm is a finance firm. Xf,j,t−4 is a vector of firm-level control variables in
four-quarter lags comprising the log of average worker education level, the share of male workers, the share of college workers, the log of average working experience and the log of firm age. All re-gressions include year-quarter fixed effect,αt, to control for macro-level trends in affecting wages.
To control for potential time-series dependence in the residuals, I cluster the standard errors at the
industry-level.
Table 1.2 presents the results from estimating Equation (3). Column (1) shows that, on aver-age, wages in private sectors are negatively correlated with industry concentration measured by Herfindahl- Hirschman Index (HHI) using two-digit SIC industry codes. The negative relationship is still statistically significant at the 1% level after controlling for firm workforce composition and firm age which may affect firms’ productivity and thus affect wages (column (2)). While there is a negative relationship between wages and industry concentration in non-finance, column (3) shows the relationship is positive in finance and significant at the 1% level after controlling for firm work-force composition and firm age. Precisely, a one standard deviation increase in HHI is associated with 13.78% (=0.011×(-3.917+16.44)×100) higher average wages in finance. Column (4) shows results are robust to HHI defined using three-digit SIC industry codes.
For robustness, I follow Grullon, et al (2018) and use total number of firms in a given two-digit SIC industry as a proxy of industry concentration. An industry is more concentrated when fewer firms remain in the industry. Consistently, column (5) shows that a decrease in the number of firms is associated with lower average wages in non-finance, whereas it is associated with significantly higher average wages in finance. In sum, these results indicate industry concentration is associated with stronger rent-sharing effect in finance.
1.3.2 Firm Market Power and Finance Wages 1.3.2.1 Main Result
own interests. Therefore, market power should be firm-specific and dependent on the firm’s market share. Firms with higher market power can extract higher wages as compared to firms with lower market power. Using this within-industry variation in this subsection, I examine the relationship between firm-specific market power and average wages to better identify the marginal difference in the treatment of firm market power on finance wages.
To visualize the relationship between firm market power and wages, I conduct a flexible esti-mation of the following equation for finance and non-financial firms separately:
logWagesf,j,t =αt+γ1D2f,j,tnd−4+γ1D3f,j,trd−4+γ1D4f,j,tth−4+X 0
f,j,t−4β+f,j,t (1.4)
wherelogW agesf,j,trepresents the log of average wages at firmf, operating within industryj,
in year-quartert. D2f,j,tnd−4,Df,j,t3rd−4, orD4f,j,tth−4 are equal to 1 if the firmf’s market power in year-quartert−4is respectively in the second, third or fourth quartile of firm market power distribution within the sample, where firm market power is constructed by equation (2) based on two-digit SIC industry classification. Xf,j,t−4 is a vector of workforce composition variables in 4-quarters
lags comprising the log of average worker education level, the share of male workers, the share of college workers, and the log of average working experience.
I plot the coefficients ofD2f,j,tnd−4, Df,j,t3rd−4, andD4f,j,tth−4 from estimating equation (4) in Figure 2a. Overall, the relationship between firm market power and wages appears to be convex and the slope is significantly steeper in finance. Specifically, workforce composition adjusted wages (wage premium) paid by financial firms with high market power (in the fourth quartile) is about 33% higher than financial firms with low market power (in the first quartile), whereas non-financial firms with high market power only pay about 3.69% higher. The high wage premium paid by financial firms with market power above the third quartile indicate that the firms with high market power drive up the average of finance wages.
estimating the following equation:
logWagesf,j,t=αt+γ1MarketPowerEf,j,t−4+γ2FINf+γ3FINf·MarketPowerEf,j,t−4+X
0
f,j,t−4β+f,j,t (1.5)
whereM arketP owerE
f,j,t−4is the market power of firmf, operating mainly in industryj (two- or
three-digit SIC) in year-quartert−4and firm market power is defined by equation (2). The other variables are defined as the same as in equation (4). Standard errors are clustered at firm-level.
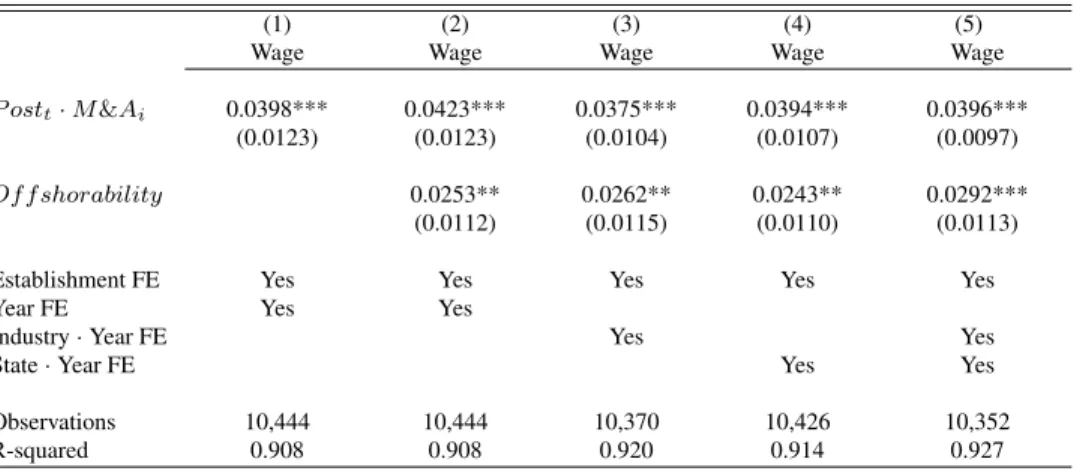
Table 1.3 reports results of estimating equation (5). Column (1) confirms that financial firms pay 19.8% higher on average than non-finance private sector when controlling for unobserved macro trends. I next add in my main variable of interest: M arketP owerE constructed based on two-digit SIC codes, and I also controls for firm workforce compositions which may drive the heterogeneity in productivity and wages across firms. 23 Column (2) reports the results. Overall, there is a significant and positive relationship between firm market power and average wages: a one standard deviation(0.05 percentage points) increase in firm market power is associated with 0.62% (= 0.05×0.123 ×100) higher wages on average. In column (3), I measure to what extent the sensitivity of average wage to the change in firm market power is different in finance by including the interaction of finance firm dummy and firm market power. The estimation results show that a one standard deviation increase in firm market power is associated with 2.64% (= 0.05×(0.112 + 0.415)×100) higher average wages in finance, whereas the effect is only 0.56% (= 0.05×0.112×
100) in non-finance industries. The difference in the effect of firm market power on finance wage is significant at the 5% level. Column (4) shows that results also hold when I include finance-by-time fixed effects to control for time-varying differences across financial and non-financial industries.
To make sure that the positive relationship between firm market power and wages is not driven by the facts that more established firms possess higher market power and established firms pay higher wages (Dunne and Roberts, 1990a; Brown and Medoff, 2003), I add the log of firm age as
23Column (2) shows financial firms pay 21.9% higher on average than non-financial firms. Compared with the result
an additional control and report results in column (5).24 While more established firms pay higher wages on average, the coefficients ofM arketP owerEand its interaction with finance firm dummy
are similar the ones reported in column (3).25
In column (6), I replicate the specification as in column (3) but redefineM arketP owerE using
three-digit SIC codes to address the concern of the coarseness of defining product market using two-digit SIC codes. Results are consistent with earlier findings. Specifically, the sensitivity of wages in finance to the change in market power is about 2.4 times (=(0.0543+0.0381)/0.0381) higher than that in non-finance. This finding to some extent mirrors what I observe in Figure 1: while there is a similar increase in market power caused by concentration in finance and non-finance, the increase in finance wage is around 2.6 times higher than the increase in non-finance.
In sum, my results show that a higher firm market power is associated with significant higher wages in finance as compared to non-finance.
1.3.2.2 Other Measures of Wages
1. Median Wage. To make sure that the marginal difference in the treatment of firm mar-ket power for finance and non-finance wages is not solely driven by top earners at high marmar-ket power financial firms being disproportionally benefited, I repeat the specification as in column (5) of Table 1.3 but take the logarithm of median wages as the dependent variable. Column (1) in Table 1.4 shows that a one standard deviation in firm market power is associated with 1.32%(= 0.05× (0.0686 + 0.195)× 100) higher median wages in finance, whereas the effect is only 0.34% (= 0.05×0.0686×100) in non-finance industries. The marginal difference in the treatment of firm market power for finance and non-finance median wages is lower than that for average wages (column (5) of Table 1.3), but it is still statistically and economically significant.
2. Wages Adjusted for Cost of Living. Financial firms, especially the ones with high market
24Firm age is defined as the oldest establishment that the firm owns in the first year the firm is observed in the LBD
(Haltiwanger, Jarmin, and Miranda, 2012).
25One concern of measuring firm market power at national-level is that it may underestimate firms’ labor
power, cluster in regions with high cost of living. This raises a question that whether these firms pay higher wages to compensate for high cost of living. To test this, I adjust worker wages for state-level price index using the methodology provided by the Bureau of Economic Analysis and then aggregate to firm-level by taking the average across adjusted individual wages.26 Then I use
the logarithm of the average wages adjusted for cost of living as the dependent variable and repeat the specification as in column (5) of Table 1.3. Column (2) of Table 1.4 reports the result. The result is qualitatively and quantatively similar to what reported in column (5) of Table 1.3. The consistency alleviates the concern that earlier findings are driven by the heterogeneity in cost of living across regions.
3. Male and Female Wages. In this section, I investigate whether a change in firm market power disproportionally affects average male or female wages in finance. If financial firms are able to discriminate against female workers by disproportionally sharing rents to male workers, the treatment of firm market power for male wages should be significantly higher than that for female wages in finance. To investigate this, I estimate equation (5) using the log of average wages of male or female at a given firm as the dependent variable. Results are reported in column (3) and (4) of Table 1.4. In finance, a one standard deviation increase in firm market power is associated with 1.99% (= 0.05×(0.362 + 0.0354) ×100) increase in male wages and 2% (= 0.05×(0.098 + 0.302)× 100) increase in female wages, and the difference is not statistically significant. Therefore, the main result of this paper is not unique to a specific gender in finance. 1.4 Exploring the Mechanism
This section explores mechanisms that may explain why market power is associated with rel-atively higher wages in finance. In this paper, I argue that market power is associated with two competing effects: labor monopsony effect and rent-sharing effect. In finance, the rent-sharing effect dominates labor monopsony effect and the net effect is relatively stronger. To support this argument, I provide evidence on two non-mutually exclusive mechanisms: 1) financial firms with
26To adjust wages in all sample years, I use state-level price index in 2008, which is the first year the
higher market power extract relatively higher rents; 2) financial firms have to give a higher pro-portion of rents to their workers, especially high-skill ones, due to higher worker wage bargaining power.
1.4.1 Evidence on Higher Rents in Finance
With higher market power, financial firms may be able to make higher rents in several ways. First, it may be relatively easier for financial firms with higher market power to increase the com-plexity of their products, which is positively correlated with the hidden markup in the products (Celerier and Vallee, 2017). Second, the strong belief of “too big to fail” in finance suggests that firms with higher market power are more likely to be supported by the government when they face potential failure, and thus they may be able to borrow at a much lower cost than smaller financial firms who must borrow based on their creditworthiness (e.g., Baker et al., 2009; Ahmed et al, 2015). Lastly, it may be relatively easier for financial firms to improve operational efficiency and achieve economies of scale. For example, financial firms may be able to allocate resources or ap-ply technology more efficiently because their production process is less geographically restricted, and thus they can generate higher revenue from each unit of assets. Under these scenarios, higher market power should be associated with relatively higher profitability in finance as compared to non-finance, and financial firms pay higher because they have more profit to share. To test this mechanism, I estimate the following equation:
ROAf,j,t=αt+γ1MarketPowerEf,j,t−4+γ2FINf+γ3FINf·MarketPowerEf,j,t−4+X
0
f,j,t−4β+f,j,t (1.6)
whereROAf,j,t is the return on assets of firmf operating in industryj in year-quartert. I follow
Grullon et al. (2017) to use ROA as a proxy for profitability because Barber and Lyon (1996) argue that ROA is superior to other measures of profitability in detecting abnormal operating performance. Xf,j,t−4 is a vector of firm-level control variables in 4-quarters lags comprising the
log of average worker education level, the share of male workers, the share of college workers, the log of average working experience and the log of firm age. Standard errors are clustered at firm level.
Compustat through a Census internal LBD-Compustat bridge.27
I next estimate equation (7) using the new sample to test whether a higher firm market power allows financial firms to create relatively higher profitability. Results are reported in Table 1.5. Consistent with my expectation, I find a positive relationship between firm profitability and firm market power in both finance and non-finance industries. This positive correlation is more pro-nounced in finance. Specifically, column (1) shows that a one standard deviation (0.893) increase in firm market power is associated with 0.029 (= 0.893×(0.0087 + 0.0242)) higher ROA within finance, but only 0.0078 higher ROA within non-finance and the difference between finance and non-finance is statistically significant at the 1% level. I add the log of firm age as a control in the specification as in column (2) because firms may have a better understanding of their production functions when they get more established. I continue to find 0.024 higher in ROA within finance, and the difference in the effects of market power on ROA between finance and non-finance is statistically significant at the 5% level.
To further investigate the sources of the additional profitability in finance, I follow Grullon et al. (2017) to decompose ROA into two components: the Lerner Index and the Asset Utilization ratio. Following Aghion et al. (2005), the Lerner Index is defined as operating income after depreciation scaled by total sales. Depreciation is excluded from operating income to take into account the cost of physical capital (Hall and Jorgenson,1967). This index approximates the extent to which prices exceed marginal costs (price-cost margins). The Asset Utilization ratio is defined as the ratio of total sales to total assets, which measures the firms’ efficiency in utilizing assets to generate sales.
27Appendix Table A.1 reports the summary statistics of key variables from the sample. Interestingly, the average
Then I re-estimate equation (6) using the Lerner Index and the Asset Utilization ratio as dependent variables. Table 1.6 reports results. Overall, I find firms with higher market power are associated with higher Lerner Index in non-finance, and the positive relationship is significantly stronger in finance. Meanwhile, I find a positive correlation between market power and Asset Utilization ratio on average. However, the positive effect of market power on the Asset Utilization ratio is not significantly higher in finance as compared to non-finance in all specifications.
In sum, results from this section support the hypothesis that financial firms with higher market power are associated with relatively higher profitability due to higher price-cost margins, and thus financial firms have more rents to share with their workers relative to non-financial firms.
1.4.2 Evidence on Higher Bargaining Power in Finance
Financial firms may have to give a relatively higher share of rents to employees because their employees have relatively higher wage bargaining power. This mechanism should apply primarily to high-skilled workers for the following reasons: first, a high-skilled worker in finance is more likely to be matched to a larger project than in other industry (Celerier and Vallee, 2017). The high scalability makes it crucial that financial workers take sufficient care of their work and get paid more.28 It is plausible to expect financial firms to give a relatively higher share of their rents to high-skilled employees to compensate for the high scalability, and thus wages of high-skilled workers should be more sensitive to the change in market power within finance.
Second, relative to non-finance workers, finance workers are closer to the final products such that their performance are directly linked to employers’ performance. Due to this reason, the costs for rivals to evaluate workers are relatively lower and the probability of workers being poached by rivals is relatively higher in finance. Financial firms may need to share a higher fraction of rents with their workers to retain workers, and thus wages in finance should be more sensitive to the change in market power. Finance high-skill workers have even higher external visibility relative to high-skill workers in non-finance. For example, Institutional Investor conducts an annual poll
28For example, Kaplan and Rauh (2010) estimate that the average partner in U.S. private equity firms oversaw
among financial firms and reports the ranking of top money managers, analyst leaders or other roles from different financial firms.29 Due to relatively higher scalability and external visibility, wages of finance high-skill workers should be even more sensitive to firm market power changes.30
To examine this mechanism, I first re-estimate equation (4) with the log of average wages of high-skilled workers as the dependent variable. As the baseline measure, high-skilled workers are individuals whose earnings are above the 90th percentile of the wage distribution in the firm-year-quarter.31. Figure 2b plots estimation results. Compared to Figure 2a, wage premium at each quartile of firm market power over the first quartile is relatively higher in both finance and non-finance, indicating average wages of high-skilled workers are more sensitive to the change in market power. The steeper slope in finance suggests that the positive relationship between average wages of high-skill workers and firm market power is more pronounced in finance.
I then repeat the specifications as in Table 1.3 using the same sample with the log of average wages of high-skilled workers as the dependent variable to quantify the marginal difference in the effect of firm market power on high-skill workers’ wages in finance. Results are reported in Table 1.7. Column (1) shows that, on average, a one standard deviation increase in firm market power is associated with 1.83% (= 0.05×0.365×100) higher average wages of high-skill workers. Column (2) shows that this positive relationship is significantly stronger in finance. Specifically, a one standard deviation increase in firm market power is associated with 6.37% (= 0.05×(0.34 + 0.933)×100) higher average wages of high-skill workers in finance, whereas the effect is only 1.7% (= 0.05×0.34×100) in non-finance industries. Given the mean of wages of high-skill workers
29See more at ttps://www.institutionalinvestor.com/research.
30People may wonder whether financial firms give a higher share of rents to their workers due to higher unionization
rates relative to non-financial firms. While data limitation does not allow me to provide firm-level evidence, I find unionization rates are substantially lower in finance based on statistics from the Union Membership and Coverage Database constructed using CPS. This database has been widely used by other literature on labor economics, such as Matsa (2010), Benmelech, et al. (2018). For example, 9.6% of workers in private non-farming sector are covered by labor unions in 2000, whereas only 1.8% in finance are covered.
31Although the education level can be a measure of skill level, it may have different meaning across different
in finance is $23050 per quarter within the sample, an increase of 6.37% can be translated into a $1468.3 (= 0.0637×23050) increase in the average quarterly wage of finance high-skill workers. I find similar results in column (3) and (4) where I define firm market power using three-digit SIC. People may question whether financial firms share a higher share of rents to high-skill workers because they have relatively higher managerial power to extract higher rents without improving firm performance. Under this hypothesis, I should observe financial firms with higher market power perform worse than non-financial firms. However, results in section 1.4.1 do not support this prediction because firms with higher market power are associated with relatively higher prof-itability within finance.
1.5 Firm Market Power and Within-firm Inequality
Results from the last section indicate that rents are disproportionally distributed to high-skill workers. Thus, it is plausible to expect that higher market power is associated with higher within-firm inequality. In Table 1.8, I repeat the specifications as in Table 1.3 with the log difference of average top 90th percentile wages and average bottom 10th percentile wages as the dependent variable. Column (1) shows that a one standard deviation increase in market power is associated with 6.66% higher within-firm pay inequality in finance, whereas the effect is only 1.94% in non-finance. The difference between finance and non-finance is significant at the 5% level. Column (2) shows results are robust to defining industries using 3-digit SIC codes.32
Interestingly, the relationship between firm market power and inequality is not unique to a specific gender in both finance and non-finance. Column (3) (column (4)) in Table 1.8 shows the results where the 90th to 10th wage ratio of male (female) workers is the outcome variable. Higher market power is associated with higher inequality within a given gender on average, and the posi-tive relationship is significantly stronger in finance. Even though higher inequality is found among both male and female workers at financial firms with higher market power, the effect is more pro-nounced for inequality among male workers than among female workers in finance. Specifically,
32In unreported results, I found qualitatively similar results when I measure within-firm pay inequality by the
in finance, a one standard deviation increase in firm market power is associated with 9.35% higher pay inequality among male workers, whereas it is associated with 5.63% higher pay inequality among female workers. This result suggests that rents in finance are disproportionally distributed to high-skill male workers.
1.6 Additional Robustness Checks 1.6.1 Local Market Power
One alternative explanation for the difference between finance and non-finance in the sensitive of wage patterns to firm market power measured at national-level is: some non-financial firms, such as restaurants and health care services, compete locally. These firms may be able to extract high rents without a high market share in national markets. Measuring market power within national-level markets may underestimate these firms’ ability in extracting rents, and thus wages paid by these firms are not sensitive to firm market power measured across a national-level market.
To test this explanation, I examine the treatment of firms’ market power in local markets for their local wages and how it is different for finance wages. To construct the sample, I select workers from LEHD following the same rules discussed in Section 1.2.2. I then aggregate worker-firm-commuting zone level data to get wage patterns and workforce compositions at firm-worker-firm-commuting zone-quarter level.33 For a firm mainly operating in industryj(two-digit SIC), its market power in commuting zone (CZ)cis defined as its employment share in industryj-CZc:
MarketPowerLf,j,y = empf,c,j,y
empc,j,y
×100 (1.7)
where empf,c,j,y is the total employment of firm f in CZ c-industry j in year y. empc,j,y is
the total employment in the CZc-industryj in year y. I link this measure in year y to quarterly
33Commuting zones are clusters of U.S. counties that are characterized by strong within-cluster and
measures of firm-CZ workforce composition and wage patterns in the first three quarters of yeary and the last quarter of yeary−1.34
I implement the following specification to estimate the marginal difference in the effect of firm local market power on local wage patterns of financial and non-financial firms:
yf,c,j,t=γ1MarketPowerLf,c,j,t−4+γ2FINf +γ3FINf·MarketPowerLf,c,j,t−4+X
0
f,c,j,t−4β+αt+τc+f,c,j,t
(1.8)
where M arketP owerLf,c,j,t−4 is firm f’s market power in CZ c-industryj in year-quartert −4. F INf is equal to 1 if firmf is in finance. Xf,c,j,t−4 is a vector of firm-CZ workforce composition
variables in 4-quarters lags comprising the log of average worker education level, the share of male workers, the share of college workers, and the log of average working experience. αt represents
year-by-quarter fixed effects. τcrepresents CZ fixed effects. Standard errors are double clustered
at firm and CZ level.
Table 1.9 reports results. Panel A examines average wages as the outcome variable. Column (1) of Panel A shows a one standard deviation (4.81 percentage points) higher in local market power is associated with 1.95% higher average local wages in non-finance, whereas the effect of local market power is 0.16% higher in finance. In column (2) of Panel A, I control for finance-by-CZ-by-time fixed effects to absorb unobservable industry shocks in local markets. The coefficient of interaction ofF INandM arketP owerLshows that the treatment of local market power for firms’
local wages is 1.7% higher in finance than that in non-finance and the difference is significant at 1% level.
Panel B repeat specifications in Panel A, but examine the average wages of high-skilled workers at firm-CZ-level as the outcome variables respectively. I continue to find more pronounced effects of firm market power on wages of high-skilled workers within finance, and the differences between finance and non-finance are significant at 1% level.
In sum, finance average wages and average wages for high-skill workers are more sensitive to
the change in local market power than non-finance ones. This result alleviates the concern that the high sensitivity of finance wages is driven by firm market power defined across national market underestimating the ability of non-financial firms who compete locally to extract rents.
An additional concern of measuring firm market power at national-level is that it may underes-timate firms’ labor monopsony power because job search is largely local (Moretti, 2011; Molloy, et al., 2014) and the lack of labor mobility lower firms’ incentives in sharing rents. The significantly positive relationship between local market power and average wages alleviates concern.
1.6.2 Measuring Market Power using Sales
Using occupational data from 1990, 2000 and 2010 ACS and occupation offshorability score from Autor and Dorn (2013), I find that jobs in finance industry have the highest offshorability on average.35 For this reason, financial firms may be able to extract higher rents by offshoring jobs
and pay higher wages to domestic workers with a smaller increase in their employment share in the domestic market, which is the baseline measure of firm market power. To make sure that my results is not explained by the possibility that firm market power measured using domestic employment captures this feature in finance, I re-define firm market power as the ratio of total sales of firmf to total sales of firms in the sample classified in industryj:
MarketPowerSf,j,y = salesf,y
salesj,y
×100 (1.9)
where salesf,y is total sales of firm f in the year y from the BR.36 salesj,y is the summation of
sales of firms in the sample classified in industryj in yeary, where industry is defined by two- or three-digit SIC codes. S represents this market power measure is constructed using sales data. I then link this measure in the yearyto quarterly measures of firm workforce composition and wage patterns in the first three quarters of yearyand the last quarter of yeary−1.
35See the average offshorability of jobs in each industry in Appendix Table A.4
36The BR reports sales data at year level. To obtain firm-year-level sales, I match the BR with LBD on
I then estimate equation (5) but replace firm market power measured using employment by M arketP owerS. Table 1.10 reports the estimation results.37 Market power used in Panel A is
calculated using two-digit SIC industries while the one used in Panel B is calculated using three-digit SIC industries. Overall, I find results which are consistent with the earlier findings: firms with higher market power measured by firm sales exhibit higher average wages and higher wages of high-skill workers, and these positive linkages are significantly stronger in finance industries. The coefficients of the interaction between finance dummy and market power in Panel A show that, within finance, a one standard deviation (0.041 percentage points) higher in market power measured by sales is associated with additional 13.08% higher average wages and 28% higher average wages of high skill workers in finance.38
1.6.3 Import Competition
Some non-financial industries may face relatively higher import exposure than financial indus-tries, for example manufacturing and wholesale trade which take a large proportion of non-finance firms. Measuring market power using only the domestic contributions to the market may under-state the degree of competition faced by firms in these industries, and this may explain why higher market power is associated with a smaller increase in rents and wags in non-finance relative to finance.
One way to examine this alternative explanation is by adjusting firm market power for import
37It is worth noticing that large firms generally report sales data based on their fiscal calendar such that they may
not have sales data ready by the time Census collect the data. Also, some multiunit firms do not file separate tax forms for each establishment location. For these reasons, sales data for a proportion of large firms are missing (DeSalvo et al., 2016), and I have to limit the sample to a subset of firm-year-quarters from my baseline sample. Appendix Table A.5 reports summary statistics of key variables from this new sample. Within this sample, I find average wages at financial firms on average are 26% higher the ones at non-financial firms between 1990-2008. The average of financial firms market powers calculated using two-digit (three-digit) SIC industries is 0.007 percentage points (0.03 percentage points) which is higher than the average of non-financial firms by 0.004 percentage points (0.008 percentage points). While this sample only includes about 60% of firm-year-quarters from the baseline sample, in unreported results, I find similar industry distributions and statistics of firm-level measures of workforce composition in these two samples.
38Compared to the measure of market power calculated using employment and 2-digit SIC codes, the average of