Nidhi M. Shah. Predictive Modelling to Identify Risk Factors Leading to Opioid Addiction. A Master’s Paper for the M.S. in I.S. degree. November, 2018. 48 pages. Advisor: David Gotz
Prescription Opioid Abuse continues to be a significant and growing problem in the United States. According to the National Institute of Drug Abuse, more than 115 Americans die every day from an opioid overdose. Considering the graveness of the situation, this project aims at briefly studying the current trends and literature pertaining to the opioid epidemic and coming up with preventive measures. This was done by studying prevalent literature and data available on this subject to analyze patterns and trends of opioid addiction to help identify risk factors, using predictive modelling.
Headings:
Predictive Modelling
Risk Analysis
Opioid Addiction
PREDICTIVE MODELLING TO IDENTIFY RISK FACTORS LEADING TO OPIOID ADDICTION
by Nidhi M. Shah
A Master’s paper submitted to the faculty of the School of Information and Library Science of the University of North Carolina at Chapel Hill
in partial fulfillment of the requirements for the degree of Master of Science in
Information Science.
Chapel Hill, North Carolina November 2018
Approved by
Table of Contents
1. Introduction ... 2
1.1 Opioid Abuse ... 2
1.2 The Opioid Epidemic ... 3
1.3 Analyzing Electronic Health Records ... 5
2. Literature Review... 6
2.1 Opioid Abuse – History and Rising Importance ... 6
2.2. Populations and Organizations Involved (and Affected) ... 8
2.3 Data Driven Solutions for the Opioid Epidemic ... 12
2.4 Predictive Analytics on Medical Data ... 14
3. Methods... 16
3.1. Data ... 16
3.2 Data Cleaning and Manipulation ... 17
3.3 Predictive Modelling ... 21
4. Results and Discussion ... 27
5. Conclusion and Future Work ... 38
1. Introduction
Prescription Opioid Abuse continues to be a significant and growing problem in the
United States. According to the National Institute of Drug Abuse, more than 115
Americans die every day from an opioid overdose. The Substance Abuse and Mental
Health Services Administration (SAMHSA) survey, has stated that non-medical use of
prescription drugs is the second most prevalent type of drug abuse, after marijuana. In
October of 2017, President Trump declared a public health emergency to combat the opioid
epidemic. He also directed agency and department heads to use all appropriate emergency
authority to reduce the number of deaths from opioids. 1 President Obama had earmarked $1.1 billion dollars for developing solutions to this issue while he was in office.
Considering the graveness of the situation, this project aims at briefly studying the
current trends and literature pertaining to the opioid epidemic and using data analytics to
identify predictive risk factors for opioid addiction. This will be done by studying
longitudinal electronic health data for patients with and without a history of opiate abuse.
This data will be analyzed using predictive machine learning algorithms to identify risk
factors for opioid addiction.
1.1 Opioid Abuse
Opioids are a class of drugs that include the illegal drug heroin, synthetic opioids
(OxyContin®), hydrocodone (Vicodin®), codeine, morphine, and many others. These
drugs are chemically related and interact with opioid receptors on nerve cells in the body
and brain. Opioid pain relievers are generally safe when taken for a short time and as
prescribed by a doctor, but because they produce euphoria in addition to pain relief, they
can be misused (taken in a different way or in a larger quantity than prescribed or taken
without a doctor’s prescription). 2 Risks of using prescription opioids include dependence
and addiction. The risks of dependence and addiction are higher if you abuse the medicines.
Abuse can include taking too much medicine, taking someone else's medicine, taking it in
a different way than you are supposed to, or taking the medicine to get high (MedlinePlus).3 The misuse of and addiction to opioids—including prescription pain relievers, heroin, and
synthetic opioids such as fentanyl—is a serious national crisis that affects public health as
well as social and economic welfare. 4 Although most people take prescription medications responsibly, an estimated 52 million people have used prescription drugs for nonmedical
reasons at least once in their lifetimes. 5 The Centers for Disease Control and Prevention estimates that the total "economic burden" of prescription opioid misuse alone in the United
States is $78.5 billion a year, including the costs of healthcare, lost productivity, addiction
treatment, and criminal justice involvement. 4
1.2 The Opioid Epidemic
The opioid epidemic has its roots in the explosive growth of prescription
painkillers. Between 1991 and 2011, the number of opioid prescriptions (selling under
brand names like Vicodin, Oxycontin, and Percocet) supplied by American retail
doctors increased, so did their potency. In 2002 one in six users took a pill more powerful
than morphine. By 2012 it was one in three. Many of the victims’ hail from white
middle-class suburbs and rural towns. The Data collected over the years shows that the problem is
worsening with time. 6
Tackling the problem of accidental deaths due to Opioid abuse has become a top
priority amongst many government as well as non-government bodies. Various bodies such
as The U.S. Department for Health and Human Services (HHS), The National Institute on
Drug Abuse (NIDA), The Centers for Disease Control and Prevention; insurance agencies
(Blue Cross Blue Shield)7 as well as retail pharmacies (Walmart)8 throughout the country have deployed resources to monitor the opioid crisis and implement various policies to
overcome this epidemic. Figure 1.0 below, shows the distributions of drugs involved in
overdose deaths in the U.S. and we can clearly see that the death rate due to synthetic
opioids has considerably shot up since 2013.
Fig 1: Drugs Involved in U.S. Overdose Deaths
The research (and consequent findings) carried out by the above-mentioned
organizations has been briefly studied in the following chapters to gain a better
understanding of the current situation in this crisis.
The nation’s opioid epidemic reflects a complex set of circumstances. The pattern
of opioid prescribing—including dose and duration-—and the patient’s risk factors of age,
gender and condition are major determinants of whether a patient becomes dependent. 9
Keeping in mind the research and efforts of various “key” organizations, this project aims
at studying patient data and developing an interactive system that would set up predictors
allowing monitoring of drug prescription as well as use. The literature review to support
the theories, the methodology as well as the predictive algorithm and its features have been
described in detail in the further chapters.
1.3 Analyzing Electronic Health Records
Health data is collected during a patients’ routine interactions with the medical care
system within the patients’ electronic health record (EHR). The EHR specifically contains
medications and diagnosis data, which record longitudinal (over time) history of opiate
prescriptions and opiate dependency diagnoses, along with tons of thousands of other
diagnoses.
This data should hold clues about risk factors associated with the development of
opiate dependency. This project aims to identify leading factors via retrospective analysis
2. Literature Review
This chapter provides an overview of previous research prescription drug abuse and
data-driven preventive measures undertaken to combat it. It introduces the framework for
the research and methodology that summarize the main goals of this project. It is important
to set the context of the literature review work by first providing a brief history of opioid
abuse and its rising importance. It will be followed by:
1. Identifying populations (and organizations) affected by the opioid epidemic;
2. Comments on current preventive measures being undertaken by the concerned
organizations;
3. Case studies of data-driven approaches to fight the opioid epidemic and predictive
analytics on health care data.
2.1 Opioid Abuse – History and Rising Importance
The opioid addiction epidemic is one of America’s foremost health crises. While
the word “epidemic” is often overused, it is an apt description of the crisis brought on by
opioid abuse in America. According to the most recent statistics from the Centers for
Disease Control and Prevention (CDC), opioids (including prescription opioids and heroin)
kill more than 33,000 people annually, which is more than any year on record and more
abuse/overdose is considered a leading cause of shortened life expectancy in the U.S.11
According to the Substance Abuse and Mental Health Services Administration (SAMHSA)
Survey, nonmedical use of prescription drugs is the second most prevalent type of drug
abuse, after marijuana.
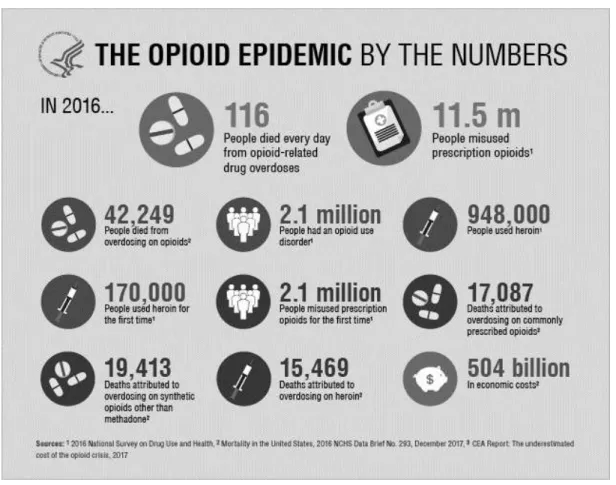
Fig 2: The Opioid Epidemic by the Numbers
src: https://www.hhs.gov/opioids/sites/default/files/inline-images/opioids-by-the-numbers-091918v.png
Since 1999, prescriptions of opioids have almost quadrupled, as have the number
of deaths involving opioids. According to the Centers for Disease Control and Prevention
(CDC), drug overdose deaths have tripled from 1999–2014. In 2014, among 47,055 drug
overdose deaths, 61% involved an opioid. From 2014 to 2015, the death rate from synthetic
the primary contributing factor to overdoses. It could be said that prescribing practices are
fueling opioid misuse which contributes significantly to the overdose epidemic.13
2.2. Populations and Organizations Involved (and Affected)
While it is wide spread in the United States of America, countries across the world
are currently grappling with what is a global opioid crisis.14 Opioids were the most harmful drug type and accounted for 70 % of the negative health impact associated with drug use
disorders worldwide, according to World Drug Report, released by the United Nations
Office on Drugs and Crime (UNDOC).15 In its 2016 report, the International Narcotics Control Board (INCB), based in Vienna, Austria, noted with great concern, the largescale
opioid, prescription drug and heroin abuse problem that continues to affect the United
States, claiming tens of thousands of victims each year. 16
Considering the graveness of the situation, tackling the problem of accidental
deaths due to Opioid abuse has become a top priority amongst many governmental as well
as non-governmental organizations.
The United Nations and many of its subsidiaries are doing everything in their power
to promote education and preventive measures about the rising opioid epidemic. Within
the United States, bodies such as Center for Disease Control and Prevention (CDC), Health
and Human Services (HHS), Department of Veterans, National Institute of Drug Abuse
(NIDS), Substance Abuse and Mental Health Services Administration (SAMSHA) and
various other government bodies (including individual state governments) are allocating
Many health insurance companies such as Blue Cross Blue Shield and retail
pharmacies such as Walmart, CVS are also active participants in the fight against the opioid
epidemic.
Preventive Measures being Undertaken by Involved Organizations
The misuse of prescription opioids and heroin can lead to a wide variety of
problems, including overdose deaths, hospitalizations, and drug diversion arrests. To fully
understand the impact of these problems, prevention practitioners collect data on a variety
of prescription opioid- and heroin-related indicators—to inform their needs assessments,
create epidemiological profiles and/or data tools, and select prevention priorities and target
populations.17 This section, elaborates on the efforts taken by various international agencies; and governmental bodies within the United States to solve the opioid crisis.
The International Narcotics Control Board & other United Nations Bodies
In its 2016 Report, The International Narcotics Control Board approved the Drug
Enforcement Administration’s comprehensive action plan to address opioid addiction and
the allocation by the Government of $27.6 billion for the 2016 fiscal year to support the
implementation of the 2015 National Drug Control Strategy. The Food and Drug
Administration released the Opioids Action Plan in February 2016, in response to the
ongoing crisis of opioid abuse, dependence and overdose in the United States. The plan
includes expanding the use of advisory committees, strengthening requirements for drug
companies to generate post-market data on the long-term impact of using opioids, updating
risk evaluation and mitigation strategy programs, and expanding access to abuse-deterrent
formulations to discourage abuse. As part of the action plan, class-wide safety labelling
United States Government & Other Departments
The President of the United States requested $27.6 billion for the fiscal year 2016
to support efforts under the 2015 National Drug Control Strategy to reduce drug use and
its effects in the country. Most of that amount was allocated to prevention and treatment
efforts. In March 2016, the President requested from Congress an additional $1.1 billion to
bolster efforts to address the prescription opioid and heroin crisis in the country. This
represents further steps to expand access to treatment, prevent opioid overdose deaths,
invest in community policing to address heroin abuse, and increase community prevention
strategies.
Opioid overdose and heroin-related deaths have been the focus of state of the state
addresses in a number of states of the United States. As of March 2016, 49 states had
established prescription drug monitoring programs and 14 states had enacted legislation
requiring physicians to receive training on the proper prescription of opioids.18
On 22 July 2016, the Comprehensive Addiction and Recovery Act 19 came into force. The Act addresses the opioid crisis by, inter alia, authorizing the United States
Department of Justice to award grants to state, local and tribal governments to provide
opioid abuse services, directs the Department of Veteran Affairs 20 to expand its opioid safety initiative, focuses on helping communities develop treatment and overdose
programs and addresses exemptions from criminal and civil liability for those
administering an opioid overdose reversal drug or who contact emergency services in
response to an overdose.
precautions, side effects and links to pharmacies that offer it. The Administration has also
been reviewing options, including making naloxone available over the counter, to make
the drug more accessible for treating opioid overdose in the country. As at May 2016, 39
states allow prescribers to dispense a naloxone prescription to third parties, such as a family
member of drug users.
In 2013, the cost of medical care and substance abuse treatment for opioid addiction
and overdose was an estimated $78.5 billion, according to a report in the journal Medical
Care 21.
Forty-nine states have prescription drug monitoring programs, databases which
enable health care providers to curb "doctor shopping" by patients who obtain opioid
prescriptions from multiple physicians. Missouri's program is not yet statewide but has
enacted legislation to authorize it.
The 21st Century Cures Act 22, passed in 2016, allocated $1 billion over two years
in opioid crisis grants to states, providing funding for expanded treatment and prevention
programs. In April 2017, Health and Human Services Secretary Tom Price announced the
distribution of the first round of $485 million in grants to all 50 states and US territories.23 In August 2017, Attorney General Jeff Sessions announced the launch of an Opioid
Fraud and Abuse Detection Unit 24 within the Department of Justice. The unit's mission is
to prosecute individuals who commit opioid-related health care fraud. The DOJ is also
appointing US attorneys who will specialize in opioid health care fraud cases as part of a
three-year pilot program in 12 jurisdictions nationwide.
State legislatures are also taking action, introducing measures to regulate pain
2.3 Data Driven Solutions for the Opioid Epidemic
Data management and analysis can provide a broad spectrum of integrated
solutions, from helping develop better treatment protocols, to enabling pharmacies to
identify dispensing anomalies, and allowing large hospital systems and public health
agencies to better analyze the possible outcomes of well-intentioned initiatives.25
For any solutions, all individual groups mentioned above, need to work in tandem
by sharing data and creating a flow of information. Fighting this epidemic is a highly
complex challenge that requires a variety of players to collaborate in order to fully
understand and solve the problem.
The research conducted by SAS 25 states that most fundamentally, better data and
analytics can help develop better treatment protocols, both for pain in the first place and
for remediation when patients are becoming dependent on the drugs. Physicians want to
know how their treatments and results compare with those of their peers, as well as what
specific patterns give early warning of addiction or overdose. The CDC has issued
guidelines about reevaluating chronic pain patients after three months, and Schedule 2
drugs (those with high potential for abuse or dependency) cannot be automatically refilled.
But many patients demand opioids and are provided them by the system in unsafe
quantities for long periods of time. Analytics help the physician recognize patient
scenarios, prescribe correctly, and focus on the best overall outcome. Large hospital
systems, licensing boards, and public health agencies need the ability to benchmark
providers by specialty and get a better picture of where and how to educate them. These
organizations are in the best position to aggregate data – PDMP, emergency room,
Analytics can inform treatment guidelines, educational initiatives, and resource allocations,
including treatment centers and community prescription drug take-back programs. These
organizations can also be better positioned to inform and influence policy makers at the
state and national levels. Data and analytics should enable the organizations charged with
leadership and policy to see more of the big picture and accelerate their decisions.
According to the study conducted by Blue Cross Blue Shield (BCBS)26,
twenty-one percent of BCBS commercially-insured members filled at least twenty-one opioid prescription
in 2015. Data also show BCBS members with an opioid use disorder diagnosis spiked 493
percent over a seven-year period. The report analyzes medical claims from BCBS
commercially insured members diagnosed with opioid abuse disorder from 2010 through
2016 (Members diagnosed with cancer or who were undergoing palliative or hospice care
were excluded from this analysis). Specifically, it looks at the degree of prescription opioid
use—in terms of the dose and duration of opioid prescriptions—and how this relates to
opioid dependence.
The Department of Justice is recruiting big data analytics to help combat opioid
fraud and abuse in the healthcare system. 27
The Centre for Disease Control and Prevent believes that improving the nation’s
big data analytics capabilities is critical for success in the ongoing fight against opioid
abuse at the state level as the substance abuse epidemic continues to ravage communities
on a massive scale. 28
While initiatives are being taken at every level be it by the government sector or
analytical solutions for it. Using data to overcome such challenges is becoming more
common these days.
2.4 Predictive Analytics on Medical Data
Healthcare analytics refers to the systematic use of health data and related business
insights developed through applying analytical, e.g. statistical, contextual, quantitative,
predictive, cognitive, and other models, to drive fact-based decision making for planning,
management, measurement, and learning in healthcare 29. At the same time, predictive analytics is believed to be the next revolution both in statistics and medicine around the
world 30.
Predictive Analytics
Predictive analytics involves using empirical methods (statistical and other) to
generate data predictions as well as methods for assessing predictive power 31. The collection of methods in Predictive Analytics known as ‘data mining’ offers
methodological and technical solutions to deal with the analysis of medical data and
construction of prediction models 32. For this instance, predictive analytics can be used to
identify high-risk patients and provide them treatment to reduce opioid addiction.
Predictive Analytics uses a variety of statistical techniques such as modeling, machine
learning, and data mining that analyze current and historical data to make predictions about
the future.
For this project the predictive algorithms used include Logistic Regression and
data (i.e. when the number of covariates is small compared to the sample size), Logistic
Regression is considered a standard approach for binary classification 33. Since its invention 17 years ago, the random forest (RF) prediction algorithm 34, which focuses on prediction rather than explanation, is increasingly becoming a common “standard tool” also
used by scientists without any strong background in statistics or machine learning 35.
Electronic Health Record Systems
Electronic health records (EHRs) systems, such as Epic 36, collect a range of data including demographics, medical history, medication and allergies, immunization status,
laboratory test results, radiology images, vital signs, personal statistics like age and weight,
and billing information 37. Large healthcare systems use this data for research and retrospective analytics. Carolina Data Warehouse for Health 38 is one such organization. Construction of predictive models for disease targets across varying patient cohorts using
EHRs has become increasing common in Healthcare analytics. Opioid Addiction being the
target disease for this project, the EHRs of patients were segregated into 2 sections – EHRs
of patients with a history of opioid addiction and EHRs of patients with no history of opioid
addiction. This segregation was possible by using the ICD-10 system for diagnoses coding.
ICD-10 System
ICD-10 is the 10th revision of the International Statistical Classification of Diseases
and Related Health Problems (ICD), a medical classification list by the World Health
Organization (WHO). It contains codes for diseases, signs and symptoms, abnormal
findings, complaints, social circumstances, and external causes of injury or diseases 39. Patients with and without a past history of opioid addiction were identified using this
3. Methods
The goal of this project was to develop a model that could highlight and predict
factors leading to opioid addiction among patients. The predictive model was be built using
patient diagnosis data, while the patient medication data gave additional insights into
addiction patterns. The following sections expand on the data used for this project and the
predictive modelling algorithms that were applied to achieve a high level of accuracy in
predicting opioid addiction among patients.
3.1. Data
Data Source
In order to assess distribution ad use of opioids among the population in the United
States, limited patient data from the Carolina Data Warehouse for Health (CDW-H) 38 was analyzed. The most identifiable features were omitted from the data set and artificial patient
IDs were used to link variables across a single patient. However, this mapping was
performed by NC TraCS 40 analysts and was not shared with the research team.
To minimize the risk of a breach of confidentiality, the data is stored on NC TraCS
provisioned and maintained secure storage which is a Level III Data Security environment
and has been approved for such use with data from the CDW-H.
Feature Description
The dataset from CDW-H comprised of deidentified patient data from three
into three datasets – patient events, patient medication, and patient demographics. They
have been described in detail below. Each dataset had a common patient id or a deid
(deidentified id) that linked the three datasets together. Additionally, the data came with a
Data Guide that included a summary of the data provision, a data dictionary for each file
provisioned, and entity relationship diagrams (ERD). Considering unique patients from
each of the three cohorts, the datasets contained records for 20,291 unique patients.
Patient Events
This dataset comprised of the deidentified patient ID, date (date on which the
procedure was done or diagnosis was made), codeclass (procedure/diagnosis), and code.
These three features together made up a unique event for any patient.
Patient Medication
This dataset comprised of several columns such as Patient – id, cohort, age; visit_id,
medication is, medication name, medication brand name, generic drug description, drug
strength, dosage formulation etc.
Patient Demographics
This dataset comprised on general demographic information such as patient id, age,
sex, and race without divulging personal identifiable information.
3.2 Data Cleaning and Manipulation
Data cleansing or data cleaning is the process of detecting and correcting (or
removing) corrupt or inaccurate records from a record set, table, or database and refers to
identifying incomplete, incorrect, inaccurate or irrelevant parts of the data and then
replacing, modifying, or deleting the dirty or coarse data. 28 Data cleansing may be
While all three datasets were used for initial data exploration, the datasets used to build the
predictive model were Patients Events and Patient Medication and the data cleaning and
manipulation was done in Python. The general algorithm to clean and manipulate these
datasets has been specified below.
Patient Events:
Step 1: Load data and Create Pandas Dataframe
Firstly, the events.csv files for all cohorts (COPD, DM and HF) were combined
into one pandas dataframe and dropped all duplicate rows since there were many patients
who existed in multiple cohorts.
Step 2: Filter Dataframe
Next, the master dataframe was filtered on codeclass=ICD10CM since we were
only interested in the ICD10 diagnosis codes and not procedure.
Step 3: Feature Reduction
1. Drop unnecessary variables: The date and codeclass variables were dropped from
the dataframe as they would not be informative in building the predictive model.
2. Restructure hierarchy: The code variable was then manipulated to include all
sub-codes for a given code into the parent code. For example: F11.01, F11.09 fell under
F11 and so on. This helped in reducing the number of features. Since this step
generated duplicate values, they were again dropped at this stage.
Step 4: Identify Unique Patients
1. Identified all unique patients in the master dataframe and created a list of the same.
2. Identified patients that were diagnosed with Opioid Addiction (ICD10 code for
Opioid Dependency – F11 39, 41) and created a list of the same. 3. Total number of unique patients diagnosed with opioid addiction:
4. Created a list of unique patients not diagnosed with opioid addiction by subtracting
the list of patients diagnosed with opioid addiction from the list of all unique
patients.
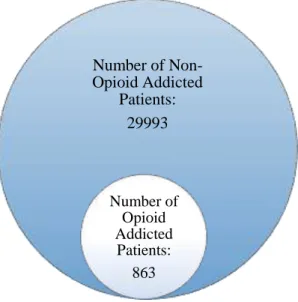
Fig 3: Spread of opioid addicted and non-opioid addicted patients in the master dataset
Step 5: Create Dataframe of Opioid Addicted and Non-Opioid Addicted Patients
Comparatively, only a small subset of patients within the master dataset were
diagnosed with opioid addiction. For a robust predictive model, it is important to have
equal number of entries for the target variable. In this case, opioid addiction being the target
variable, it was important to create a dataframe that had equal number of patients diagnosed
with opioid addiction as well as patients not diagnosed with opioid addiction and include
all instances of these patients from the master dataframe.
Number of Non-Opioid Addicted
Patients: 29993
Number of Opioid Addicted
Step 6: Binary Encode and Group by patient id
Predictive models accept data in certain format. Most models require categorical
variables to be encoded. Since the dataframe contains all categorical variables (all
diagnosis codes are categorical), it was important to binary encode them. After binary
encoding the diagnosis codes and grouping them by patient id, codes that appeared less
than 5 times in the entire dataframe were dropped.
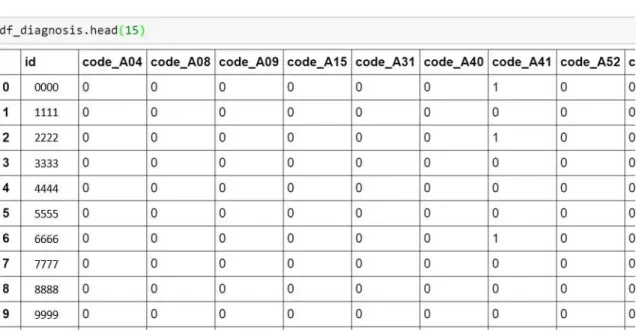
Fig 4: Dataset before binary encoding
Step 7: Explore the dataset and proceed to building the predictive model
The final dataframe consisted of 958 variables - 957 diagnosis codes and the patient id
variable, and 1726 rows.
Fig 6: Equal number of opioid addicted and non-opioid addicted patients.
As we can see in the figure above, the dataset consisted of 863 patients diagnosed with
opioid addiction and 863 patients not diagnosed with opioid addiction.
Finally, the cleaned and transformed dataframe was saved as a csv file and ready to
be used to build the predictive model.
3.3 Predictive Modelling
Predictive modelling uses statistics to predict outcomes 42. Most often the event one wants to predict is in the future, but predictive modelling can be applied to any type of
unknown event, regardless of when it occurred. Nearly any regression model can be used
for prediction purposes. Broadly speaking, there are two classes of predictive models:
parametric and non-parametric. Parametric models make "specific assumptions with regard
to one or more of the population parameters that characterize the underlying
distribution(s)", 43 while non-parametric regressions make fewer assumptions than their
863 863
Clean and Transformed Dataset
parametric counterparts 44. Since we would like to predict opioid addiction (assumption)
using diagnosis and medication data (parameters) for the given patients (population), the
models we will use are parametric in nature.
In predictive modelling most of the time is spent understanding the requirements
and then framing the problem. The next step is to tailor the solution to the needs. Generally,
a framework can be used to build the first cut of models. Python is a useful tool since it has
a large number of open source libraries for predictive analytics and data science, making it
a good choice for building the predictive models for this study. The various libraries used
during data cleaning, and model building are: pandas, numpy, scipy, sklearn, etc.
Building the Model
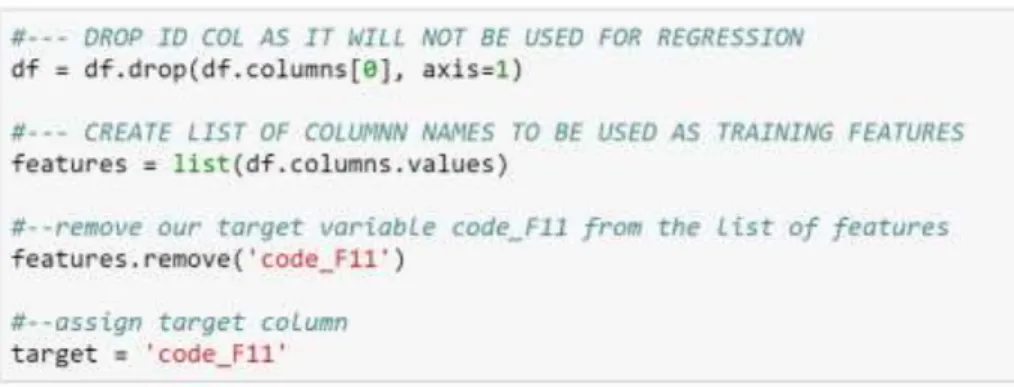
Step 1: Drop Variables not important for prediction
The id feature in our dataframe did not contribute towards the prediction and was
dropped.
Step 2: Create list of features and identify Target Variable
The remaining variables are features that will be used for building the predictive
model. the outcome we wish to predict is opioid addiction (code: F11) 31 making it our target variable.
Step 3: Split the dataframe into train and test
The dataframe was split into train and test. The training set contains the known
target variable – opioid addiction, allowing the model to learn on this data in order to be
generalized to other data later on. The test dataset is used to test our model’s prediction on
this subset.
Fig 7: Dividing the dataset into training and test data
Step 4: Fit the train and test datasets
The dataset was then fit against a logistic regression and random forest model (after
specifying a ten-fold cross validation) respectively to make the prediction. After dropping
the id column, assigning the target variable and splitting the dataset into train and test data,
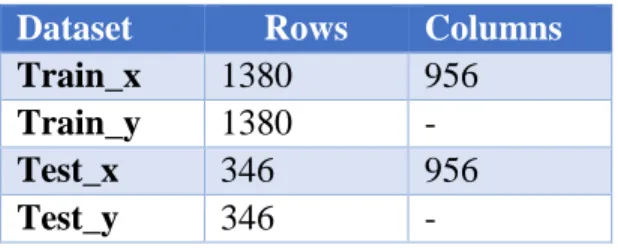
the shape of the train and test sets is shown in Table 1.
Dataset Rows Columns
Train_x 1380 956
Train_y 1380 -
Test_x 346 956
Test_y 346 - Table 1: Train and Test Datasets
At this point, we were ready to run our chosen predictive models. The first model
that was run was the Logistic Regression.
Logistic Regression
Logistic regression is a statistical method for analyzing a dataset in which there are
one or more independent variables (diagnosis codes) that determine an outcome. In logistic
dichotomous, i.e. it only contains binary encoded data (the reason why we binary encoded
our dataset). The goal of logistic regression is to find the best fitting to describe the
relationship between the dependent and the independent variables. 45, 46
To build the logistic regression model, the sklearn library in python was used.
First, the Logistic Regression module was imported and a Logistic Regression classifier
object was created using LogisticRegression() function. Then, the model was fit on the
train set using fit() and prediction was performed on the test set using predict().
Fig 9: Python Code snippet for Logistic Regression Model.
The model was evaluated using success metrics in the form of a confusion matrix,
the accuracies scores, and precision and recall scores. The results for the same have been
discussed in detail in the results and evaluation sections.
Random Forest
Random Forest is an ensemble of unpruned classification or regression trees created
by using bootstrap samples of the training data and random feature selection in tree
induction. Prediction is made by aggregating (majority vote or averaging) the predictions
of the ensemble 47. Thus, given data on predictor variables (inputs, X) and a continuous response variable (output, Y) Random Forest builds a model for: 1. Predicting the value of
the response from the predictors. 2. Understanding the relationship between the predictors
and the response 48. To say it in simple words: Random forest builds multiple decision trees
and merges them together to get a more accurate and stable prediction.
The random forest regression model from skicit-learn imported, instantiated, and
fit (scikit-learn’s name for training) on the training data.
Fig 11: Python Code snippet for Random Forest Model.
Having trained the model on the training dataset, the next step was figuring out how
good the model was. This was done by making predictions on the test dataset. The
predictions were then compared to the known answers. Ten-fold cross validation was used
to measure the root mean squared error for the random forest prediction.
Random Forest is not the best choice for this study since the response variable is
categorical and not continuous. However, a great quality of the random forest algorithm is
that it is very easy to measure the relative importance of each feature on the prediction 49. The Random Forest Model helps understand feature significance i.e. – which
features contribute the most towards the prediction. For this study, it is the feature
significance that is of interest as opposed to the prediction itself. Similar to Logistic
Regression, the Random Forest model was also built using the sklearn library in Python.
Sklearn provides a great tool for this, that measures a features importance by looking at
how much the tree nodes, which use that feature, reduce impurity across all trees in the
forest. It computes this score automatically for each feature after training and scales the
results, so that the sum of all importance is equal to 1.
Fig 13: Python Code snippet for investigating feature importance with Random Forest
4. Results and Discussion
Having built the predictive models, the next step was to look at the results.
Logistic Regression
Logistic Regression describes and estimates the relationship between one
dependent binary variable and independent variables 49. This gave a binary prediction for
opioid addiction. That is, it predicted a yes or no outcome for opioid addiction for a given
patient. The first run of the Logistic Regression model yielded the following results:
Model Accuracy
The logistic regression model was trained on the training data and gave a 97%
accuracy. The test data was used to make the prediction. When the trained model was run
on the test data, it gave an accuracy of 79%. This means that 79% of the predictions made
on the test data were accurate.
Confusion Matrix
A confusion matrix is a table with two rows and two columns that reports the
number of false positives, false negatives, true positives, and true negatives. This allows
more detailed analysis than mere proportion of correct classifications (accuracy).
Table 2: Logistic Regression Confusion Matrix
PredictNo PredictYes Total
Actual No 142 37 179
Actual Yes 31 136 167
Table 2 shows the confusion matrix for the logistic regression model. It shows
that the logistic regression model predicted 142 True Positive values, 37 False Positive
values, 31 False Negative Values and 136 True Negative values. The goal is to build a
model that has minimum False Positive and False Negatives to reduce Type I and Type II
errors respectively.
Classification Report – Precision, Recall, F-1 score
Precision is intuitively the ability of the classifier to not label a sample as positive
if it is negative. Recall is intuitively the ability of the classifier to find all the positive
samples. The F-beta score can be interpreted as a weighted harmonic mean of the precision
and recall, where an beta score reaches its best value at 1 and worst score at 0. The
F-beta score weights the recall more than the precision by a factor of F-beta. F-beta = 1.0 means
recall and precision are equally important. The support is the number of occurrences of
each class in the target variable for the test data.
Table 3: Logistic Regression Classification Report – Precision, Recall, F-1 score
Root Mean Square Error
The root mean squared error for the Logistic Regression Model was 0.44.
Random Forest
An advantage of random forest is that it can be used for both regression and
classification tasks and it is easy to view the relative importance it assigns to the input
features. We will now discuss the results of the random Forest Model. Precision Recall F-1 score Support
0 0.82 0.79 0.81 179
1 0.79 0.81 0.80 167
Root Mean Square Error
Ten-fold cross validation was used to measure the root mean squared error for the
random forest prediction.
Fig 14: Random Forest Model: Cross Validation Iterations and Score
The root mean squared error for the Random Forest Model was 0.36.
Feature Significance
As stated in the model building section, the random forest model was chosen for
the feature significance module it provides. The model allowed plotting a feature
significance graph to understand which of the variables (features) contributed the most
towards the prediction. Fig 15 shows the top 10 predictive features for the model.
Discussion
Using Fig 15 and the ICD 10 coding system 39, 41, we can determine which diagnosis codes contributed the most towards opioid addiction.
Rank Diagnosis Code Description (from the ICD 10 coding system)
1 G89 Acute pain
2 F19 Other psychoactive substance related disorders
3 F14 Cocaine related disorders
4 F18 Inhalant related disorders
5 F17 Nicotine dependence
6 F41 Other anxiety disorders
7 R52 Pain, unspecified
8 M96 Intraoperative and postprocedural complications and
disorders of musculoskeletal system, not elsewhere classified
9 F13 Sedative, hypnotic, or anxiolytics related disorders
10 E78 Disorders of lipoprotein metabolism and other lipidemias
Table 4: Ranked Diagnosis codes and their description.
(Derived from: Feature Significance for Random Forest Model)
From Table 4 we can see that patients diagnosed with Acute Pain were more prone
to opioid addiction. The table also shows that patients diagnosed with other addiction or
dependencies, such as cocaine, nicotine, etc. were also more susceptible to opioid
addiction. While these results are not surprising, they lead one to believe that most cases
of opioid addiction stem from being prescribed opioid medication since Acute Pain is
ranked first in the list of important features. What would the results look like if we were to
run the predictive models solely on patients diagnosed with Acute Pain?
The next section elaborates on the results of the second run of predictive models
Predictive Models for Patients Diagnosed with Acute Pain
Similar to the first run of predictive model building, the second run followed the
same basic steps, except being filtered for patients diagnosed with Acute Pain. There were
total 941 patients in the dataset.
Dataset Rows Columns
Train_x 752 956
Train_y 752 -
Test_x 189 956
Test_y 189 -
Table 5: Train and Test Datasets for Predictive Modelling for patients diagnosed with Acute Pain.
Logistic Regression (for patients diagnosed with Acute Pain)
The results and the success metrics for the Logistic Regression Model for patients
diagnosed with Acute Pain were as follows:
Model Accuracy
The logistic regression model was trained on the training data and gave an accuracy
of 99%. When the trained model was run on the test data, it gave an accuracy of 78%. This
means that 78% of the predictions made on the test data were accurate.
Confusion Matrix
Table 6 shows the confusion matrix for the logistic regression model for patients
diagnosed with Acute Pain. It shows that the logistic regression model predicted 26 True
Positive values, 26 False Positive values, 15 False Negative Values and 122 True Negative
values. Again, the goal is to build a model that has minimum False Positive and False
Table 6: Logistic Regression Confusion Matrix (for Patients diagnosed with Acute Pain)
Classification Report – Precision, Recall, F-1 Score
Table 7 shows the Precision, Recall, and F-1 score for the logistic regression model.
Table 7: Logistic Regression Classification Report – Precision, Recall, F-1 score
Root Mean Squared Error
The root mean squared error for the Logistic Regression Model was 0.47. An
error closer to 0 is generally preferable.
Random Forest for patients diagnosed with Acute Pain
The results and the success metrics for the Random Forest Model for patients
diagnosed with Acute Pain were as follows:
Root Mean Squared Error
The mean squared error for the Random Forest Model for Patients diagnosed with
Acute Pain (Ten-fold cross-validation as before) was 0.4
PredictNo PredictYes Total
Actual No 26 26 52
Actual Yes 15 122 137
Total 41 148 189
Precision Recall F-1 score Support
0 0.63 0.50 0.56 52
1 0.82 0.89 0.86 137
Fig 16: Random Forest Model for patients diagnosed with Acute Pain: Cross Validation Iterations and Score
Feature Significance
Again, the Random Forest Model allowed plotting a feature significance graph to
understand which of the variables (features) contributed the most towards the prediction.
Fig 17 shows the top 10 predictive features for the model.
As before, using Fig 17 and the ICD 10 coding system 39, 41, we can determine
which diagnosis codes contributed the most towards opioid addiction in patients
diagnosed with Acute Pain.
Rank Diagnosis Code
Description (from the ICD 10 coding system)
1 F19 Other psychoactive substance related disorders
2 F17 Nicotine dependence
3 M96 Intraoperative and post procedural complications and disorders of
musculoskeletal system, not elsewhere classified
4 F33 Major depressive disorder, recurrent
5 R52 Pain, unspecified
6 F41 Other anxiety disorders
7 Z01 Encounter for other special examination without complaint, suspected or reported diagnosis
8 M54 Dorsalgia
9 I49 Other cardiac arrhythmias
10 J32 Chronic sinusitis
Table 8: Ranked Diagnosis codes for patients diagnosed with Acute Pain and their description.
(Derived from: Feature Significance for Random Forest Model for Patients diagnosed with Acute Pain)
Comparing Table 7 (ranked diagnosis codes from the Random Forest model) and
Table 8 (ranked diagnosis codes from the Random Forest model for patients diagnosed
with Acute Pain), we can see that while some diagnosis codes appear in both the tables,
many diagnosis codes are dismissed and new diagnosis codes appear in their place when
we filter the dataset on patients diagnosed with Acute Pain. Table 9 describes the difference
All Patients Patients Diagnosed with Acute Pain
Rank DX_Code Description DX_Code Description
1 G89 Acute pain F19 Other psychoactive
substance related disorders 2 F19 Other psychoactive
substance related disorders
F17 Nicotine dependence
3 F14 Cocaine related disorders
M96 Intraoperative and postprocedural
complications and disorders of musculoskeletal system, not elsewhere classified 4 F18 Inhalant related
disorders
F33 Major depressive disorder,
recurrent
5 F17 Nicotine dependence R52 Pain, unspecified 6 F41 Other anxiety disorders F41 Other anxiety disorders 7 R52 Pain, unspecified Z01 Encounter for other
special examination without complaint, suspected or reported diagnosis
8 M96 Intraoperative and postprocedural complications and disorders of
musculoskeletal system, not elsewhere classified
M54 Dorsalgia
9 F13 Sedative, hypnotic, or anxiolytics related disorders
I49 Other cardiac arrhythmias
10 E78 Disorders of lipoprotein metabolism and other lipidemias
J32 Chronic sinusitis
Table 9: Comparison of Table 7 and Table 8 – Ranked Diagnosis Codes generated from Feature
Significance module of the Random Forest models
Table 9 gives a clear distinction of the difference in ranked diagnosis codes once
we filter the dataset for patients diagnosed with Acute Pain. There is clear distinction
between codes that did not get carried forward, the codes that were carried forward and the
from the Random Forest model run on the main dataset (not filtered for patients diagnosed
with Acute Pain) contained diagnosis codes for other dependencies (rr to Table 7). While
some of these dependency diagnosis codes such as F19 (Other psychoactive substance
related disorders) and F17 (Nicotine Dependency) were passed along, diagnosis codes
related to anxiety and other psychological disorders cropped up in the new Table (refer to
Table 8). This leads one to question the influence of psychological disorders on opioid
addiction.
Exploring the Patient Medication Dataset
Based on the results of the predictive models, it was advisable to look at the Patient
Medication Dataset to draw further insights.
Insights from Patient Medication Dataset
The subjects of interest in the Patient Medication dataset were patients who were
prescribed opioids. Thus, the medication dataset was filtered for patients that were
prescribed opioids.
The list of opioids used to filter the dataset was:
• Fentanyl
• Methadone
• Morphine
• Oxycodone
• Hydrocodone
• Demerol
• Percocet
• Oxycodone
• Oxycontin
• Vicodin
• Heroin
• Duragesic
• Roxicodone
• Darvocet
This list was derived from the National Institute on Drug Abuse 51. It is
important to understand that many of these drugs share the same parent drug and could
just be different brand names for the same generic drug.
Within the dataset, the opioids found were:
• Fentanyl
• Methadone
• Morphine
• Oxycodone
• Hydrocodone
• Oxycodone
• Oxycontin
• Vicodin
While it was difficult to gleam information and draw insights from initial
exploration of the Patient Medication dataset, it would prove to be useful to study this
dataset further and include those variables in building the predictive model. The drugs
patients are prescribed along with the duration they have been on said drug could
5. Conclusion and Future Work
Prescription opioid abuse is inherently dangerous and may lead users down a path
towards serious, illicit drug abuse and addiction problems. Efforts to curb the prescription
opioid abuse problem are challenged by numerous factors that all relate to the way that
these medications are perceived in the public sphere. Despite their legal status, opioid
medications have a very high potential for abuse and addiction and are being
overprescribed at alarming rates 52.
Fortunately, people are beginning to realize the brevity of the situation and
necessary steps are being taken address this issue. Educating people, both professional and
consumers, of the underlying causes of this epidemic, will make them better equipped to
address the major public health concerns arising from opioid abuse.
Analyzing data related to patients diagnosed with opioid addiction has led to
identifying risk factors that lead to opioid addiction. The predictive model built is based
solely on past patient diagnosis history. However, there are numerous other factors that can
contribute towards addiction. It would be useful to study the patient medication history to
gain further insights and narrow down the risk factors. Past research has shown that patient
demographics (age, gender, race, socio-economic status) could also contribute towards
addiction. Adding these variables to the predictive model could yield better results and give
This project is another such attempt at providing a solution to the opioid epidemic.
Prevention is always better than cure and addressing the risk factors leading to opioid
Bibliography
[1] Neuman, S. (2018, January 17). Opioid Crisis Blamed for Sharp Increase in
Accidental Deaths in U.S. Retrieved from:
https://www.wabe.org/opioid-crisis-blamed-for-sharp-increase-in-accidental-deaths-in-u-s/
[2] Opioids, National Institute on Drug Abuse. Retrieved from:
https://www.drugabuse.gov/drugs-abuse/opioids
[3] MedlinePlus, US National Library of Medicine. Retrieved from:
https://medlineplus.gov/opioidabusearndaddiction.html
[4] Opioid Overdose Crisis, National Institute on Drug Abuse. Retrieved from:
https://www.drugabuse.gov/drugs-abuse/opioids/opioid-overdose-crisis
[5] The Economist (2017, March 6). America’s opioid epidemic is worsening,
Economic Times. Retrieved from:
https://www.economist.com/blogs/graphicdetail/2017/03/daily-chart-3
[6] Marr, B. (2017, January 16). How Big Data Helps to Tackle the No 1 Cause of
Accidental Death In the U.S. Retrieved from:
https://www.forbes.com/sites/bernardmarr/2017/01/16/how-big-data-helps-to-tackle-the-no-1-cause-of-accidental-death-in-the-u-s/#53384b6339ca
[7] Baig, E. C. (2018, January 17). Walmart takes on opioid crisis, offering free
https://www.usatoday.com/story/money/2018/01/17/walmart-takes-opioid-crisis-offering-free-solution-safely-dispose-unused-meds/1039548001/
[8] Blue Cross Blue Shield (2017, June 29). America’s Opioid Epidemic and Its
Effect on The Nation’s Commercially-Insured Population. Retrieved from:
https://www.bcbs.com/the-health-of-america/reports/americas-opioid-epidemic-and-its-effect-on-the-nations-commercially-insured
[9] Rudd RA, Seth P, David F, Scholl L. (December 16, 2016). Increases in Drug and
Opioid-Involved Overdose Deaths — United States, 2010–2015. Centers for
Disease Control and Prevention, Morbidity and Mortality Weekly Report.
Retrieved from: https://www.cdc.gov/mmwr/preview/mmwrhtml/mm6450a3.html
[10]Stein, R. (December 8, 2016). Life Expectancy in U.S. Drops for First Time in
Decades, Report Finds. North Carolina Public Radio. Retrieved from:
http://www.npr.org/sections/health-shots/2016/12/08/504667607/life-expectancy-in-u-s-drops-for-first-time-in-decades-report-finds.
[11]Centers for Disease Control and Prevention, Opioid Overdose. (n. d.). Drug
overdose deaths in the United States continue to increase in 2015. Retrieved from:
https://www.cdc.gov/drugoverdose/epidemic/
[12](August 28, 2017). Preventing Opioid Misuse and Overdose: Data Sources and
Tools to Inform Assessment and Planning efforts. Substance Abuse and Mental
Health Services Administration’s Center for the Application of Prevention
[13]Centers for Disease Control and Prevention, Opioid Overdose. (n. d.). Drug
overdose deaths in the United States continue to increase in 2015. Retrieved from:
https://www.cdc.gov/drugoverdose/epidemic/
[14] (June 22, 2017). World Drug Report 2017 – Interactive Map. United Nations
Office on Drugs and Crime (UNDOC). Retrieved from:
https://www.unodc.org/wdr2017/en/interactive-map.html
[15](June 22, 2017). World Drug Report 2017. United Nations Office on Drugs and
Crime (UNDOC). Retrieved from: http://www.unodc.org/wdr2017/
[16] (March, 2017). International Narcotics Board Report – 2016. United Nations –
Vienna, Austria. Retrieved from:
http://www.incb.org/documents/Publications/AnnualReports/AR2016/English/AR
2016_E_ebook.pdf
[17]National Institute on Drug Abuse. Retrieved from:
https://www.drugabuse.gov/drugs-abuse/opioids
[18]Califf R. M., (2016). FDA Opioid Action Plan and Incorporating the Broader
Public Health Impact into the Formal Risk-Benefit Assessment for Opioids ,
Meeting of the Committee on Pain Management and Regulatory Strategies to
Address Prescription Opioid Abuse Keck Center, Washington, DC. Retrieved
from: https://www.fda.gov/downloads/NewsEvents/Speeches/UCM510139.pdf
[19](July 22, 2016). Comprehensive Addiction and Recovery Act (CARA) - Public
Law 114–198. Retrieved from:
[20](2017). Opioid Safety Initiative – Department of Veteran Affairs. Retrieved from:
https://www.va.gov/PAINMANAGEMENT/Opioid_Safety_Initiative_OSI.asp
[21]Florence C.S., Zhou C., Lou F., Xu L. (October, 2016). The Economic Burden of
Prescription Opioid Overdose, Abuse, and Dependence in the United Sates, 2013.
Retrieved from: https://www.ncbi.nlm.nih.gov/pubmed/27623005
[22](December, 13 2016). 21st Century Cures Act – Public Law 114 – 255, 114th
Congress. Retrieved from:
https://www.congress.gov/114/plaws/publ255/PLAW-114publ255.pdf
[23](April 19, 2017). Trump Administration awards grants to states to combat opioid
crisis. HHS Press Office. Retrieved from:
https://www.hhs.gov/about/news/2017/04/19/trump-administration-awards-grants-states-combat-opioid-crisis.html
[24](August 2, 2017). Attorney General Sessions Announces Opioid Fraud and Abuse
Detection Unit. Department of Justice, Office of Public Affairs. Retrieved from:
https://www.justice.gov/opa/pr/attorney-general-sessions-announces-opioid-fraud-and-abuse-detection-unit
[25]Dunham, J. & Kearney, S. Jr. (June, 2016). Data and Analytics to Combat the
Opioid Epidemic. Research Brief, International Institute for Analytics – SAS.
Retrieved from:
[26](June 29, 2017). America’s Opioid Epidemic and its Effects on the Nation’s
Commercially-Insured Population. Health of America Report, Blue Health
Intelligence – Blue Cross Blue Shield.
[27]Bresnick, J. (August 7, 2017). DOJ Leverages Big Data Analytics to Combat
Opioid Fraud, Abuse. HeathITAnalytics. Retrieved from:
https://healthitanalytics.com/news/doj-leverages-big-data-analytics-to-combat-opioid-fraud-abuse
[28]Bresnick, J. (September 6, 2017). CDC Awards $28.6M for Big Data Analytics to
Track Opioid Abuse. HeathITAnalytics. Retrieved from:
https://healthitanalytics.com/news/cdc-awards-28.6m-for-big-data-analytics-to-track-opioid-abuse
[29]Cortada, J. W., Gordon, D., & Lenihan, B. (2012). The value of analytics in
healthcare: from insights to outcomes. IBM Global Business Services, Life
Sciences and Healthcare, Executive Report.
[30]Marr, B. (2015). How big data is changing healthcare. Retrieved from:
http://www.forbes.com/sites/bernardmarr/2015/04/21/how-big-data-is-changing-healthcare
[31] Winters-Miner, L. A. (2014). Seven ways predictive analytics can improve
healthcare. Elsevier Connect. Retrieved from:
https://www.elsevier.com/connect/seven-ways-predictive-analytics-can-improve-healthcare.e/print/
[32] Shmueli, G., & Koppius, O. R. (2011). Predictive analytics in information
[33] Shmueli G. (2010). To explain or to predict? Statistical Science. 225:289–310.
[34] Breiman L. (2001). Random forests. Machine Learning. 45(1):5–32.
[35] Couronné, R., Probst, P., Boulesteix, A. (July 2018). Random forest versus
logistic regression: a large-scale benchmark experiment. BMC Bioinformatics
201819:270 https://doi.org/10.1186/s12859-018-2264-5
[36] Epic. Source: https://www.epic.com/
[37]Habib JL (2010). "EHRs, meaningful use, and a model EMR". Drug Benefit
Trends. 22 (4): 99–101.
[38]Carolina Data Warehouse for Health. (UNC – CDWH). Source:
https://tracs.unc.edu/index.php/services/informatics-and-data-science/cdw-h
[39](2017). National Clinical Coding Standards ICD-10 5th Edition. NHS Digital
Clinical Classification Services. April 2017. p. 200.
[40]North Carolina Translational and Clinical Sciences Institute. Source:
https://tracs.unc.edu/
[41](July, 2018) International Classification of Diseases, Tenth Revision, Clinical
Modification (ICD-10-CM). CDC/National Center for Health Statistics.
Retrieved from:
ftp://ftp.cdc.gov/pub/Health_Statistics/NCHS/Publications/ICD10CM/2019/icd1
0cm_tabular_2019.pdf
[42]Geisser, S. (September 2016). Predictive Inference: An Introduction. New York:
Chapman & Hall. ISBN 0-412-03471-9.
[43]Sheskin, D. (April 27, 2011). Handbook of Parametric and Nonparametric
[44]Marascuilo, L. (December 1977). Nonparametric and distribution-free methods
for the social sciences. Brooks/Cole Publishing Co. ISBN 0818502029.
[45]Cox, DR (1958). "The regression analysis of binary sequences (with
discussion)". J Roy Stat Soc B. 20 (2): 215–242. JSTOR 2983890.
[46]Swaminathan, S. (March 15, 2018). Logistic Regression — Detailed Overview.
Towards Data Science. Retrieved from:
https://towardsdatascience.com/logistic-regression-detailed-overview-46c4da4303bc
[47]Svetnik, V., Liaw, A., Tong, C., Culberson, J.C., Sheridan, R., Feuston, B.
Random Forest: A Classification and Regression Tool for Compound
Classification and QSAR Modeling. Journal of Chemical Information and
Computer Sciences 2003 43 (6), 1947-1958. DOI: 10.1021/ci034160g
[48]Cutler, A. (September, 2010). Random Forests for Regression and Classification.
Utah State University. Ovronnaz, Switzerland.
[49]Sandri, M. & Zuccolotto, P. (2006). Variable Selection Using Random Forests.
Data Analysis, Classification and the Forward Search. 263-270.
10.1007/3-540-35978-8_30.
[50] (June 2018). Drug Facts: What are Common Prescription opioids? National
Institute on Drug Abuse. Retrieved from:
https://www.drugabuse.gov/publications/drugfacts/prescription-opioids
[51]Brande, L. Prescription Opioid Addiction: What is causing the Epidemic?
Drugabuse.com – An American Addiction Centers Resource. Retrieved from: