Association Between Medical Financial Burden and Subsequent Health Care Utilization
By
Siyuan Peter Sheng
A Master’s Paper submitted to the faculty of the University of North Carolina at Chapel Hill in
partial fulfillment of the requirements for the degree of Master of Public Health in the Public
Health Leadership Program
Chapel Hill
2018
_____________________________
Advisor
_____________________________ Date
_____________________________
Second Reader
Acknowledgments
I would like to thank Dr. Cindy Feltner and Dr. Seth Berkowitz for their guidance on this paper. I
would also like to thank Dr. Sally Stearns for teaching me the statistical methods needed to
perform this analysis and Dr. Dan Jonas for teaching me how to conduct a systematic review.
Lastly, I would like to thank Dr. Sue Tolleson-Rinehart for advancing my interest in the US
Table of Contents Page
Abstract...1
Introduction...2
Methods...3
Results ...6
Discussion...8
References...11
Tables...14
Abstract
Introduction: Medical financial burden has been linked to unfavorable lifestyle changes,
diminished access to care, poor psychological well-being, and greater morbidity and mortality.
The association between medical financial burden and subsequent health care utilization is still
unclear but has implications for affected patients and the health care system.
Methods: Among adults in the Medical Expenditure Panel Survey Panel 19, the associations
between medical financial burden in 2014 and emergency department visits, hospitalizations,
medical office visits, and prescription drug usage in 2015, were assessed. Analyses accounted for
complex survey design and incorporated regression models to adjust for baseline demographic
and clinical characteristics as well as previous year utilization.
Results: Based on a sample of 9,561 participants, an estimated 23.5% (95% CI 21.8% to 25.4%)
of US adults experienced medical financial burden, which occurred more frequently among those
with lower education and income levels, psychological distress, and higher numbers of chronic
medical conditions. After adjusting for baseline characteristics and previous year utilization,
significantly higher proportions of adults with medical financial burden, compared to the
proportion of those without, visited the emergency department (17.2% vs 13.6%, p=0.002) and
were hospitalized (9.8% vs 6.9%, p<0.001). Those with medical financial burden also filled more
prescription medications (17.51 vs 16.18, p=0.048) but had similar numbers of medical office
visits (7.21 vs 7.24, p=0.930), compared to those without the issue.
Conclusion: Medical financial burden is associated with increased subsequent health care
utilization, which may exert additional financial strain on affected patients and stress capacity
constraints in the emergency department system. Further research is needed to better understand
Introduction
Medical financial burden has been described as a “side effect” of health care in the
United States (US).1 This complex issue is defined on national surveys as problems paying
medical bills or having medical debt being paid off over time.2–4 Problems paying medical bills
was reported by 15.7% of US adults 18 to 64 years old in 2016. Having health insurance was
only partially protective since 12.7% and 19.4% of those with private and public insurance,
respectively, still experienced this problem.3 When also considering medical debt, in addition to
problems paying medical bills, the percentage affected increased to 37%.4 Patients with a range
of health conditions, from asthma to cardiovascular disease, experience medical financial
burden.5,6 Cancer patients are especially vulnerable due to high out-of-pocket costs.7
To cope with medical financial burden, patients often adopt unfavorable lifestyle changes
and reduce health-seeking behavior. For example, cancer patients who required copayment
assistance reduced spending not only on leisure activities, such as going to the movies or
restaurants, but also on basic living necessities, such as food and clothing.8 Problems paying
medical bills have been linked to the decision to delay or forgo needed medical care or
prescription drugs.9,10 Certain characteristics, such as being uninsured or having low education
and income levels, already place patients at risk for not receiving adequate medical care or
medications, and the development of medical financial burden can contribute to diminished
access to health care in a synergistic manner.11,12
Medical financial burden can also adversely affect patients’ mental and physical
well-being and result in worse health outcomes. Afflicted patients reported lower quality of life and
higher prevalence of depression than patients without medical financial burden.13 For rheumatoid
Among patients who suffered a myocardial infarction, cost-related delays in medical care and
prescription medications have been linked to increased likelihood of all-cause hospitalizations at
1 year.15 Worst of all, cancer patients who filed for bankruptcy experienced higher rates of
mortality.16
The association between medical financial burden and subsequent health care utilization
is still unclear. A reduction in health-seeking behavior would hypothetically decrease utilization
but diminished well-being and worsened health outcomes may increase future need for health
care. Such an association may indicate that medical financial burden not only affects individual
patients but also has implications for the entire health care system regarding cost and capacity.
The objective of this study is to provide a comprehensive comparison of health care utilization
between patients with and without medical financial burden. This analysis uses nationally
representative data to evaluate differences in emergency department (ED) visits, hospitalizations,
medical office visits, and prescription medication usage.
Methods
The Medical Expenditure Panel Survey (MEPS) uses complex survey design to provide
nationally representative data. Participants in each panel are followed for two years. The sample
for this analysis was derived from MEPS Panel 19, which consisted of participants from 2014
and 2015. While MEPS data can be analyzed in a cross-sectional manner, this analysis was
structured in a longitudinal fashion to establish medical financial burden as the exposure and
health care utilization as the outcome. Variables related to medical financial burden were
extracted from 2014 survey results while those related to health care utilization were obtained
All participants aged 18 years and over in 2014 were eligible for inclusion. Those with
missing data on the variables of interest were excluded in order to form a complete case analysis
sample. Two groups were created based on whether the participant reported medical financial
burden. Participants were categorized as having medical financial burden if they responded “yes”
to either of the following MEPS questions: “In the past 12 months did anyone in the family have
problems paying or were unable to pay any medical bills?” and “Does anyone in your family
currently have any medical bills that are being paid off over time?”2 Terms such as “family” and
“problem” were not defined in these questions and were left to the interpretation of individual
respondents.
The primary outcome of interest was having at least one ED visit. Secondary outcomes
were having at least one hospitalization and the total numbers of ED visits, hospitalizations,
medical office visits, and prescription medications filled, which included both the initial
purchase as well as refills. ED visits and hospitalizations were considered primarily as
dichotomous variables (at least one event or none) since they are both significant events in terms
of cost and health care resources consumed, and any increase in utilization would be
consequential. As a sensitivity analysis, the counts of ED visits and hospitalizations were also
examined. Medical office visits and prescription medications filled were analyzed only as count
variables since they are both already accessed by the majority of US adults, so the degree of
utilization would be more meaningful.
The following covariates were considered in this analysis: age, sex, marital status, race
and ethnicity, education level, income-to-poverty ratio, insurance coverage, having a usual
source of care, psychological distress, the number of chronic medical conditions, and health care
considered in previous studies of medical financial burden and health care utilization.11,12,17
Marital status was categorized as married or not married, which included widowed, divorced,
separated, or never married. Insurance coverage was categorized as private, Medicaid, Medicare,
multiple insurances, or uninsured. Psychological distress was defined as having a score of at least
13 out of 24 on the Kessler Psychological Distress Scale (K6), which is a validated measure of
nonspecific psychological distress used in previous studies on medical financial burden.11,13,18
The number of chronic medical conditions was categorized as 0, 1, 2, or 3 or more. Specific
conditions used to derive this value were hypertension, hyperlipidemia, coronary artery disease,
chronic obstructive pulmonary disease, diabetes, stroke, cancer, asthma, and arthritis. Only
previous year utilization corresponding to the outcome utilization variable was considered in
each individual analysis. For example, in the analysis of ED visits in 2015, previous year
utilization was based on ED visits in 2014.
All analyses incorporated MEPS sampling weights and adjustments for primary sampling
unit and strata in order to generate nationally representative estimates and effect measures.
Adjusted Wald tests and Pearson chi-squared tests were conducted to evaluate differences in
baseline characteristics and health care utilization between those with and without medical
financial burden. Logistic regression models were constructed to determine odds ratios of having
at least one ED visit and of having at least one hospitalization between those with and without
medical financial burden, controlling for demographic, socioeconomic, and clinical
characteristics as well as health care utilization in the previous year. Similarly, generalized linear
models using the negative binomial distribution and logarithmic link were created to calculate
the incidence rate ratios of ED visits, hospitalizations, medical office visits, and prescription
modeling is suitable since the counts of these utilization variables have highly-skewed
distributions; similar strategies have been used by other studies of health care utilization based
on MEPS data.19–21 Since previous year utilization had similar highly-skewed distributions, a
cubic root transformation was applied to improve model stability. Based on these regression
models, predictions for probabilities of having at least one ED visit and of having at least one
hospitalization as well as numbers of ED visits, hospitalizations, medical office visits, and
prescription medications filled were generated for adults with and without medical financial
burden. A p-value of 0.05 was used to assess for statistical significance. All analyses were
performed using Stata 15.0. (StataCorp Inc., College Station, TX)
Results
MEPS Panel 19 consisted of 10,064 participants aged 18 years and over who participated
in interviews and filled out the Self-Administered Questionnaire. The complete case analysis
sample contained 9,561 (95.0%) of those participants. The weighted mean age was 47.48 years,
51.8% were female, and 64.1% were non-Hispanic White. (Table 1) Furthermore, 86.5% had at
least a high school degree or general equivalency diploma (GED), 90.8% had health insurance,
and 57.4% had at least one chronic medical condition. Based on this sample, medical financial
burden affected an estimated 23.5% (95% CI 21.8% to 25.4%) of US adults. Those with medical
financial burden, compared to those without the issue, had a lower mean income-to-poverty ratio
(3.43 vs 4.49, p<0.001). Higher proportions of US adults with medical financial burden,
compared to the proportion of those without the issue, had lower education levels (less than high
school 14.6% vs 13.1%, high school or GED 66.4% vs 54.4%, college 19.0% vs 32.5%,
13.0% vs 14.9%, one 21.9% vs 20.9%, zero 38.1% vs 43.9%, p<0.001), and psychological
distress (7.9% vs 3.0%, p<0.001).
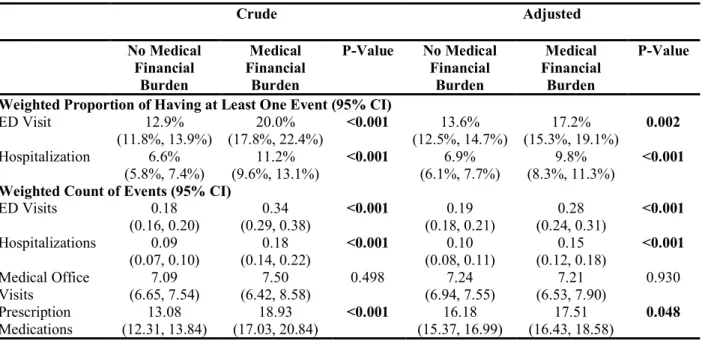
Higher proportions of US adults reporting medical financial burden had at least one ED
visit (20.0% vs 12.9%, p<0.001) and at least one hospitalization (11.2% vs 6.6%, p<0.001) in the
following year, compared to the proportion of those without the issue. (Table 2) Similarly, those
with medical financial burden filled more prescription medications (18.93 vs 13.08, p<0.001).
However, both groups had similar numbers of medical office visits (7.50 vs 7.09, p=0.498).
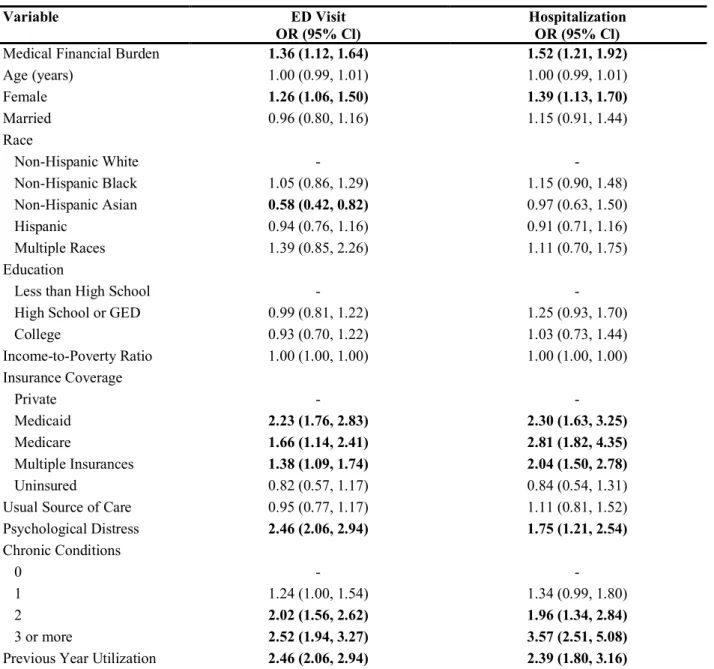
After adjusting for baseline characteristics and previous year utilization, US adults with
medical financial burden, compared to those without the issue, had significantly higher odds of
having at least one ED visit (OR=1.36; 95% CI 1.12 to 1.64) and of having at least one
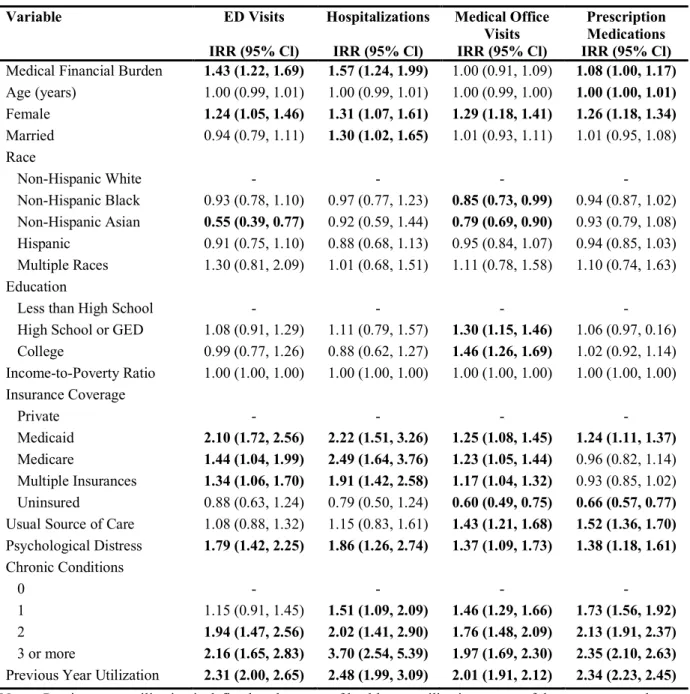
hospitalization (OR=1.52; 95% CI 1.21 to 1.92) in the next year. (Table 3) Similarly, sensitivity
analyses showed that medical financial burden was associated with higher counts of ED visits
(IRR=1.43; 95% CI 1.22 to 1.69) and hospitalizations (IRR=1.57; 95% CI 1.24 to 1.99). (Table
4) Medical financial burden also was associated with higher counts of prescription medications
filled (IRR=1.08; 95% CI 1.00 to 1.17) but not with the count of medical office visits (IRR=1.00;
95% CI 0.91 to 1.09).
Based on these models, 17.2% of US adults with medical financial burden and 13.6% of
those without this issue are predicted to have at least one ED visit in the following year,
controlling for baseline characteristics and previous year utilization (p<0.001). (Table 2) At least
one hospitalization is predicted for 9.8% of US adults with medical financial burden and 6.9% of
those without this issue (p<0.001). The predicted numbers of medical office visits are 7.21 and
predicted numbers of prescription medications filled are 17.51 and 16.18 for those with and
without medical financial burden, respectively (p=0.048).
Discussion
This analysis using nationally representative data demonstrates that medical financial
burden is associated with significantly higher health care utilization, specifically regarding ED
visits, hospitalizations, and prescription medications. In addition, medical financial burden is
more common among US adults with lower education or income levels, psychological distress,
and greater numbers of chronic medical conditions.
Previous studies have shown that medical financial burden is associated with diminished
physical and mental well-being and worse health outcomes.13–16 Those conditions may be the
link between medical financial burden and the increased health care utilization observed in these
results. Much of the increased utilization may be unplanned by patients. ED visits, by nature, are
unplanned while hospitalizations can be either planned (i.e., admission after scheduled deliveries
or surgeries) or unplanned (i.e., direct admission from outpatient providers).22 The ED is a
considerable source of unplanned admissions, accounting for 81.8% in 2009, and more recent
data from the National Inpatient Sample showed that half of all hospitalized patients were
admitted from the ED in 2015.22,23
After patients have an ED visit or a hospital stay, they often require prescription
medications and outpatient follow-up. Therefore, increased ED utilization and hospitalizations
may directly contribute to increased prescription medication usage and medical office visits. This
explanation reconciles these results with those of previous studies showing that patients with
Such coping behavior would only affect planned health care utilization but this intentional
reduction in planned utilization may be negated by an increase in unplanned utilization. For
example, patients with medical financial burden may elect to forgo routine management of
chronic diseases, which results in those conditions becoming uncontrolled and requiring
additional unplanned medical care in the form of ED visits or urgent medical office visits. Since
the question in MEPS inquiring about medical office visits did not differentiate between urgent
and routine visits, this proposition may explain why those with and without medical financial
burden were observed to have similar numbers of medical office visits.
The significantly higher ED utilization among US adults with medical financial burden is
concerning due to the substantial financial costs to patients and the capacity strain on an
overcrowded ED system. A previous analysis based on MEPS data revealed that the average ED
charges to insurers and patients for the ten most common reasons leading to the visit are all
above $1,000.24 The out-of-pocket portion of this substantial cost may exacerbate the medical
financial burden among patients who already experience it and may trap these patients in a
vicious cycle from which escape would be difficult. Furthermore, overcrowding in the ED has
been a recognized problem since the Institute of Medicine published its landmark report on the
issue in 2006.25 The Agency for Healthcare Research and Quality detected a 14.8% rise in the
number of ED visits from 2006 to 2014, which outpaced the US population growth of 6.9%.26
Further data from the National Hospital Ambulatory Medical Care Survey found that the percent
of patients waiting more than 2 hours in the ED before being seen was 60.7% in 2011 and 58.2%
in 2015, indicating that overcrowding in the ED continues to be a problem.27,28 These lengthy
stay, longer length of stay, and higher inpatient mortality for patients admitted from the ED on
days when the overcrowding occurred.29
This study has several limitations. The sample was derived from MEPS Panel 19, which
had response rates of only 54.7% in 2014 and 48.5% in 2015.30 Applying MEPS weights reduces
possible selection bias from low response rates but characteristics not considered in the creation
of MEPS weights may still exert bias. Similarly, the analysis was adjusted for baseline
characteristics and previous year utilization to control for known confounders but unknown
confounders may still exist. Like all databases, MEPS is susceptible to data entry errors but any
possible errors would likely be random and non-differential between respondents with and
without medical financial burden.
Further research is needed to better understand why medical financial burden is
associated with increased subsequent health care utilization. The duration and degree of medical
financial burden may affect health care utilization and should be considered. Longer term studies
would determine if the increase in health care utilization persists over time. Studies of health care
utilization should also consider the reasons for each utilization event, which would allow
researchers to distinguish between necessary and preventable utilization.
In conclusion, this analysis establishes a link between medical financial burden and
increased subsequent health care utilization. Recognition of this association, combined with
current literature on the poor health outcomes among patients with medication financial burden,
lends support for the implementation of strategies to reduced medical financial burden among
patients in the US health care system.
References
1. Ubel PA, Abernethy AP, Zafar SY. Full Disclosure - Out-of-Pocket Costs as Side Effects. N Engl J Med.
2013;369(16):1484-1486. doi:10.1056/NEJMp1306826
2. Agency for Healthcare Research and Quality. MEPS HC-181 2015 Full Year Consolidated Data File.; 2017.
https://meps.ahrq.gov/data_stats/download_data/pufs/h181/h181doc.pdf.
3. Cohen RA, Zammitti EP. Problems Paying Medical Bills Among Persons Under Age 65: Early Release of
Estimates From the National Health Interview Survey, 2011-June 2016.; 2016.
https://www.cdc.gov/nchs/data/nhis/earlyrelease/probs_paying_medical_bills_jan_2011_jun_2016.pdf.
4. Collins SR, Gunja MZ, Doty MM, Beutel S. How the Affordable Care Act Has Improved Americans’ Ability
to Buy Health Insurance on Their Own.; 2017.
http://www.commonwealthfund.org/~/media/files/publications/issue-brief/2017/feb/pdf_collins_biennial_survey_2016_exhibits.pdf.
5. Kodjebacheva GD, Sabo T, Parker S. Influences of asthma on reported health indicators and access to health
care among children. Ann Allergy, Asthma Immunol. 2016;116(2):126-133. doi:10.1016/j.anai.2015.12.002
6. Osborn CY, Kripalani S, Goggins KM, Wallston KA. Financial Strain is Associated with Medication
Nonadherence and Worse Self-rated Health among Cardiovascular Patients. J Health Care Poor
Underserved. 2017;28(1):499-513. doi:10.1353/hpu.2017.0036
7. Sloan C, Zafar SY. Ask Early and Ask Often. N C Med J. 2018;79(1):39-42. doi:10.18043/ncm.79.1.39
8. Zafar SY, Peppercorn JM, Schrag D, et al. The Financial Toxicity of Cancer Treatment: A Pilot Study
Assessing Out-of-Pocket Expenses and the Insured Cancer Patient’s Experience. Oncologist.
2013;18(4):381-390. doi:10.1634/theoncologist.2012-0279
9. Herman PM, Rissi JJ, Walsh ME. Health Insurance Status, Medical Debt, and Their Impact on Access to
Care in Arizona. Am J Public Health. 2011;101(8):1437-1443. doi:10.2105/AJPH.2010.300080
10. May JH, Cunningham PJ. Tough Trade-Offs: Medical Bills, Family Finances and Access to Care.; 2004.
11. Baughman KR, Burke RC, Hewit MS, Sudano JJ, Meeker J, Hull SK. Associations between Difficulty
Paying Medical Bills and Forgone Medical and Prescription Drug Care. Popul Health Manag.
Behavior: A 2-Year Panel Study. Heal Educ Behav. 2017. doi:10.1177/1090198117739671
13. Kale HP, Carroll N V. Self-reported financial burden of cancer care and its effect on physical and mental
health-related quality of life among US cancer survivors. Cancer. 2016;122(8):1283-1289.
doi:10.1002/cncr.29808
14. Wolfe F, Michaud K. Out-of-pocket expenses and their burden in patients with rheumatoid arthritis.
Arthritis Care Res. 2009;61(11):1563-1570. doi:10.1002/art.24724
15. Rahimi AR, Spertus JA, Reid KJ, Bernheim SM, Krumholz HM. Financial Barriers to Health Care and
Outcomes After Acute Myocardial Infarction. JAMA. 2007;297(10):1063. doi:10.1001/jama.297.10.1063
16. Ramsey SD, Bansal A, Fedorenko CR, et al. Financial insolvency as a risk factor for early mortality among
patients with cancer. J Clin Oncol. 2016;34(9):980-986. doi:10.1200/JCO.2015.64.6620
17. Andersen RM. Revisiting the Behavioral Model and Access to Medical Care: Does it Matter? J Health Soc
Behav. 1995;36(1):1-10.
18. Dismuke CE, Egede LE. Association of serious psychological distress with health services expenditures and
utilization in a national sample of US adults. Gen Hosp Psychiatry. 2011;33(4):311-317.
doi:10.1016/j.genhosppsych.2011.03.014
19. Lekoubou A, Bishu KG, Ovbiagele B. Nationwide healthcare utilization among children with epilepsy in the
United States: 2003–2014. Epilepsy Res. 2018;141:90-94. doi:10.1016/j.eplepsyres.2018.02.012
20. Mahmoudi E, Zazove P, Meade M, McKee MM. Association Between Hearing Aid Use and Health Care
Use and Cost Among Older Adults With Hearing Loss. JAMA Otolaryngol Neck Surg.
2018;144(6):498-505. doi:10.1001/jamaoto.2018.0273
21. Singh J, Valero-Elizondo J, Salami JA, et al. Favorable Modifiable Cardiovascular Risk Profile is
Associated with Lower Healthcare Costs Among Cancer Patients: The 2012-2013 Medical Expenditure
Panel Survey. J Am Heart Assoc. 2018;7(9):1-10. doi:10.1161/JAHA.117.007874
22. Kocher KE, Dimick JB, Nallamothu BK. Changes in the Source of Unscheduled Hospitalizations in the
United States. Med Care. 2013;51(8):689-698. doi:10.1097/MLR.0b013e3182992c7b
23. Agency for Healthcare Research and Quality. HCUP Weighted Summary Statistics Report: NIS 2015 Core
File.; 2017. https://www.hcup-us.ahrq.gov/db/nation/nis/nissummstats.jsp.
Top Ten Diagnoses in the Emergency Department. PLoS One. 2013;8(2):1-6.
doi:10.1371/journal.pone.0055491
25. Institute of Medicine. Hospital-Based Emergency Care: At the Breaking Point.; 2006.
26. Moore BJ, Stocks C, Owens PL. Trends in Emergency Department Visits, 2006–2014.; 2017.
https://www.hcup-us.ahrq.gov/reports/statbriefs/sb227-Emergency-Department-Visit-Trends.pdf.
27. National Center for Health Statistics. National Hospital Ambulatory Medical Care Survey : 2011 Emergency
Department Summary Tables.; 2012.
https://www.cdc.gov/nchs/data/ahcd/nhamcs_emergency/2011_ed_web_tables.pdf.
28. Rui P, Kang K. National Hospital Ambulatory Medical Care Survey: 2015 Emergency Department
Summary Tables.; 2015. http://www.cdc.gov/nchs/ahcd/ahcd_survey_instruments.htm#nhamcs.
29. Sun BC, Hsia RY, Weiss RE, et al. Effect of emergency department crowding on outcomes of admitted
patients. Ann Emerg Med. 2013;61(6):605-611.e6. doi:10.1016/j.annemergmed.2012.10.026
30. Agency for Healthcare Research and Quality. Medical Expenditure Panel Survey Household Component
Response Rates. https://meps.ahrq.gov/survey_comp/hc_response_rate.jsp. Published 2017. Accessed June
Tables
Table 1. Characteristics of US adults aged 18 years and over, by presence of medical financial burden, based on MEPS Panel 19 from 2014-2015
Variable Overall
(weighted mean or proportion) (95% CI)
n = 9,561
No Medical Financial Burden (weighted mean or proportion) (95% CI)
n = 7,315
Medical Financial Burden (weighted mean or proportion) (95% CI)
n = 2,246
P-Value
Age (years) 47.48 (46.82, 48.13) 48.13 (47.39, 48.86) 45.35 (44.34, 46.36) <0.001
Female 51.8% (50.9%, 52.8%) 51.1% (50.1%, 52.2%) 54.2% (52.5%, 55.8%) 0.002
Married 54.1% (52.4%, 55.7%) 53.8% (52.0%, 55.6%) 55.1% (51.9%, 58.2%) 0.465
Race <0.001
Non-Hispanic White 64.1% (61.5%, 66.7%) 64.0% (61.2%, 66.7%) 64.7% (60.5%, 68.7%) Non-Hispanic Black 11.7% (10.4%, 13.1%) 11.1% (9.8%, 12.6%) 13.6% (11.5%, 16.1%) Non-Hispanic Asian 5.7% (4.6%, 6.9%) 6.6% (5.4%, 8.1%) 2.7% (1.8%, 4.2%) Hispanic 15.4% (13.5%, 17.5%) 15.3% (13.4%, 17.4%) 15.9% (12.9%, 19.3%) Multiple Races 3.1% (2.5%, 3.9%) 3.1% (2.3%, 4.0%) 3.1% (2.3%, 4.4%)
Education <0.001
Less than High School 13.5% (12.5%, 14.5%) 13.1% (12.1%, 14.3%) 14.6% (12.8%, 16.5%) High School or GED 57.2% (55.6%, 58.8%) 54.4% (52.7%, 56.1%) 66.4% (63.5%, 69.3%) College 29.3% (27.7%, 31.0%) 32.5% (30.7%, 34.4%) 19.0% (16.6%, 21.7%)
Income-to-Poverty Ratio 4.24 (4.08, 4.39) 4.49 (4.30, 4.67) 3.43 (3.22, 3.64) <0.001
Insurance Coverage 0.100
Private 56.7% (54.6%, 58.8%) 57.1% (54.8%, 59.4%) 55.5% (51.9%, 59.1%) Medicaid 10.1% (9.1%, 11.3%) 9.8% (8.6%, 11.0%) 11.3% (9.6%, 13.2%) Medicare 6.3% (5.5%, 7.0%) 6.3% (5.5%, 7.3%) 6.0% (4.7%, 7.6%) Multiple Insurances 17.7% (16.4%, 19.1%) 18.2% (16.7%, 19.7%) 16.3% (13.8%, 19.2%) Uninsured 9.2% (8.3%, 10.2%) 8.7% (7.7%, 9.8%) 10.9% (9.3%, 12.9%)
Usual Source of Care 77.9% (76.4%, 79.4%) 78.1% (76.5%, 79.6%) 77.4% (74.6%, 80.0%) 0.600 Psychological Distress 4.1% (3.6%, 4.7%) 3.0% (2.5%, 3.5%) 7.9% (6.4%, 9.7%) <0.001
Chronic Conditions <0.001
0 42.6% (41.0%, 44.2%) 43.9% (42.1%, 45.7%) 38.1% (35.5%, 40.8%) 1 21.2% (20.1%, 22.2%) 20.9% (19.7%, 22.2%) 21.9% (19.8%, 24.2%) 2 14.5% (13.4%, 15.5%) 14.9% (13.7%, 16.2%) 13.0% (11.4%, 14.9%) 3 or more 21.8% (20.5%, 23.2%) 20.3% (18.8%, 21.8%) 26.9% (24.4%, 29.6%) Previous Year Utilization
ED Visit (≥1) 14.3% (13.4%, 15.1%) 12.1% (11.1%, 13.2%) 21.2% (19.1%, 23.4%) <0.001
Hospitalization (≥1) 7.3% (6.7%, 8.0%) 6.0% (5.3%, 6.8%) 11.7% (10.1%, 13.5%) <0.001
ED Visits (count) 0.21 (0.20, 0.22) 0.17 (0.15, 0.19) 0.33 (0.29, 0.37) <0.001
Hospitalizations (count) 0.10 (0.09, 0.11) 0.08 (0.07, 0.09) 0.17 (0.13, 0.20) <0.001
Medical Office Visits
(count) 6.84 (6.46, 7.22) 6.68 (6.22, 7.15) 7.34 (6.49, 8.20) 0.210 Prescription Medications
(count)
Table 2. Crude and adjusted comparisons of health care utilization among US adults aged 18 years and over, by presence of medical financial burden, based on MEPS Panel 19 from 2014-2015
Crude Adjusted
No Medical Financial
Burden
Medical Financial
Burden
P-Value No Medical Financial
Burden
Medical Financial
Burden
P-Value
Weighted Proportion of Having at Least One Event (95% CI)
ED Visit 12.9%
(11.8%, 13.9%) (17.8%, 22.4%) 20.0% <0.001 (12.5%, 14.7%) 13.6% (15.3%, 19.1%) 17.2% 0.002 Hospitalization 6.6%
(5.8%, 7.4%) (9.6%, 13.1%) 11.2% <0.001 (6.1%, 7.7%) 6.9% (8.3%, 11.3%) 9.8% <0.001
Weighted Count of Events (95% CI)
ED Visits 0.18
(0.16, 0.20) (0.29, 0.38) 0.34 <0.001 (0.18, 0.21) 0.19 (0.24, 0.31) 0.28 <0.001 Hospitalizations 0.09
(0.07, 0.10) (0.14, 0.22) 0.18 <0.001 (0.08, 0.11) 0.10 (0.12, 0.18) 0.15 <0.001 Medical Office
Visits (6.65, 7.54) 7.09 (6.42, 8.58) 7.50 0.498 (6.94, 7.55) 7.24 (6.53, 7.90) 7.21 0.930 Prescription
Medications
13.08 (12.31, 13.84)
18.93 (17.03, 20.84)
<0.001 16.18 (15.37, 16.99)
17.51 (16.43, 18.58)
0.048
Table 3. Odds ratios of having at least one health care utilization event for US adults aged 18 years and over based on MEPS Panel 19 from 2014-2015
Variable ED Visit
OR (95% Cl) Hospitalization OR (95% Cl)
Medical Financial Burden 1.36 (1.12, 1.64) 1.52 (1.21, 1.92)
Age (years) 1.00 (0.99, 1.01) 1.00 (0.99, 1.01)
Female 1.26 (1.06, 1.50) 1.39 (1.13, 1.70)
Married 0.96 (0.80, 1.16) 1.15 (0.91, 1.44)
Race
Non-Hispanic White - -
Non-Hispanic Black 1.05 (0.86, 1.29) 1.15 (0.90, 1.48)
Non-Hispanic Asian 0.58 (0.42, 0.82) 0.97 (0.63, 1.50)
Hispanic 0.94 (0.76, 1.16) 0.91 (0.71, 1.16)
Multiple Races 1.39 (0.85, 2.26) 1.11 (0.70, 1.75)
Education
Less than High School - -
High School or GED 0.99 (0.81, 1.22) 1.25 (0.93, 1.70)
College 0.93 (0.70, 1.22) 1.03 (0.73, 1.44)
Income-to-Poverty Ratio 1.00 (1.00, 1.00) 1.00 (1.00, 1.00) Insurance Coverage
Private - -
Medicaid 2.23 (1.76, 2.83) 2.30 (1.63, 3.25)
Medicare 1.66 (1.14, 2.41) 2.81 (1.82, 4.35)
Multiple Insurances 1.38 (1.09, 1.74) 2.04 (1.50, 2.78)
Uninsured 0.82 (0.57, 1.17) 0.84 (0.54, 1.31)
Usual Source of Care 0.95 (0.77, 1.17) 1.11 (0.81, 1.52)
Psychological Distress 2.46 (2.06, 2.94) 1.75 (1.21, 2.54)
Chronic Conditions
0 - -
1 1.24 (1.00, 1.54) 1.34 (0.99, 1.80)
2 2.02 (1.56, 2.62) 1.96 (1.34, 2.84)
3 or more 2.52 (1.94, 3.27) 3.57 (2.51, 5.08)
Previous Year Utilization 2.46 (2.06, 2.94) 2.39 (1.80, 3.16)
Table 4. Incidence rate ratios of the count of health care utilization events for US adults aged 18 years and over based on MEPS Panel 19 from 2014-2015
Variable ED Visits
IRR (95% Cl)
Hospitalizations
IRR (95% Cl)
Medical Office Visits IRR (95% Cl)
Prescription Medications IRR (95% Cl)
Medical Financial Burden 1.43 (1.22, 1.69) 1.57 (1.24, 1.99) 1.00 (0.91, 1.09) 1.08 (1.00, 1.17)
Age (years) 1.00 (0.99, 1.01) 1.00 (0.99, 1.01) 1.00 (0.99, 1.00) 1.00 (1.00, 1.01)
Female 1.24 (1.05, 1.46) 1.31 (1.07, 1.61) 1.29 (1.18, 1.41) 1.26 (1.18, 1.34)
Married 0.94 (0.79, 1.11) 1.30 (1.02, 1.65) 1.01 (0.93, 1.11) 1.01 (0.95, 1.08) Race
Non-Hispanic White - - - -
Non-Hispanic Black 0.93 (0.78, 1.10) 0.97 (0.77, 1.23) 0.85 (0.73, 0.99) 0.94 (0.87, 1.02) Non-Hispanic Asian 0.55 (0.39, 0.77) 0.92 (0.59, 1.44) 0.79 (0.69, 0.90) 0.93 (0.79, 1.08) Hispanic 0.91 (0.75, 1.10) 0.88 (0.68, 1.13) 0.95 (0.84, 1.07) 0.94 (0.85, 1.03) Multiple Races 1.30 (0.81, 2.09) 1.01 (0.68, 1.51) 1.11 (0.78, 1.58) 1.10 (0.74, 1.63) Education
Less than High School - - - -
High School or GED 1.08 (0.91, 1.29) 1.11 (0.79, 1.57) 1.30 (1.15, 1.46) 1.06 (0.97, 0.16) College 0.99 (0.77, 1.26) 0.88 (0.62, 1.27) 1.46 (1.26, 1.69) 1.02 (0.92, 1.14) Income-to-Poverty Ratio 1.00 (1.00, 1.00) 1.00 (1.00, 1.00) 1.00 (1.00, 1.00) 1.00 (1.00, 1.00) Insurance Coverage
Private - - - -
Medicaid 2.10 (1.72, 2.56) 2.22 (1.51, 3.26) 1.25 (1.08, 1.45) 1.24 (1.11, 1.37)
Medicare 1.44 (1.04, 1.99) 2.49 (1.64, 3.76) 1.23 (1.05, 1.44) 0.96 (0.82, 1.14) Multiple Insurances 1.34 (1.06, 1.70) 1.91 (1.42, 2.58) 1.17 (1.04, 1.32) 0.93 (0.85, 1.02) Uninsured 0.88 (0.63, 1.24) 0.79 (0.50, 1.24) 0.60 (0.49, 0.75) 0.66 (0.57, 0.77)
Usual Source of Care 1.08 (0.88, 1.32) 1.15 (0.83, 1.61) 1.43 (1.21, 1.68) 1.52 (1.36, 1.70)
Psychological Distress 1.79 (1.42, 2.25) 1.86 (1.26, 2.74) 1.37 (1.09, 1.73) 1.38 (1.18, 1.61)
Chronic Conditions
0 - - - -
1 1.15 (0.91, 1.45) 1.51 (1.09, 2.09) 1.46 (1.29, 1.66) 1.73 (1.56, 1.92)
2 1.94 (1.47, 2.56) 2.02 (1.41, 2.90) 1.76 (1.48, 2.09) 2.13 (1.91, 2.37)
3 or more 2.16 (1.65, 2.83) 3.70 (2.54, 5.39) 1.97 (1.69, 2.30) 2.35 (2.10, 2.63)
Previous Year Utilization 2.31 (2.00, 2.65) 2.48 (1.99, 3.09) 2.01 (1.91, 2.12) 2.34 (2.23, 2.45)
Appendix. Limited Systematic Review: Association Between Medical Financial Burden and
Subsequent Prescription Drug Nonadherence
Abstract
Background: Medical financial burden can affect any patient, regardless of health insurance
status, and is associated with poor health outcomes. One factor mediating this association may be
prescription drug nonadherence, which has been linked to adverse patient outcomes. This
systematic review aims to assess the relationship between medical financial burden and
prescription drug nonadherence.
Methods: Pubmed and Scopus were searched for studies examining differences in prescription
drug nonadherence between patients with and without medical financial burden. Studies based in
the United States from the last 15 years were included. Risk of bias was assessed for each study,
and relevant outcome measures were extracted.
Results: Four studies met full eligibility criteria, and all were cross-sectional studies based on
state or national data. All studies showed that medical financial burden was associated with
increased prescription medication nonadherence. Studies measuring the exposure as problems
paying medical bills in the past 12 months had higher odds ratios than those measuring the
exposure as currently paying off medical bills or debt.
Discussion: The results of this systematic review suggest that patients affected by medical
financial burden also have increased prescription medication nonadherence. Future research is
needed to definitively establish this association. In the meantime, health care costs should be
discussed with patients to prevent prescription medication nonadherence and associated adverse
Introduction
According to estimates from the National Health Interview Survey, problems paying
medical bills affected 43.8 million or 16.2% of the population under age 65 in the United States
(US) in 2016.1 Having health insurance was only partially protective against this issue, which
was reported by 12.6% of those with private insurance, 21.1% of those with public insurance,
and 28.5% of the uninsured. Higher prevalence of this problem existed among African
Americans, those with income below 200% of federal poverty level, and those with annual
out-of-pocket medical expenses greater than $2,000. The majority of the research on medical
financial burden has been conducted among cancer patients who are especially vulnerable due to
high costs of treatment. Previous studies showed that cancer patients who had sought copayment
assistance were more likely to cut back on food and clothing and that mortality rate was higher
among cancer patients who had declared bankruptcy.2,3 The relationship between medical
financial burden and poor health outcomes is likely complex and multifaceted. Prescription drug
nonadherence may be one mediating factor, since it has previously been linked to adverse patient
outcomes, such as hospital admissions.4 A systematic review was published in 2017 that focused
on the effects of financial hardship in cancer patients.5 However, no systematic review has yet
examined specifically the association between medical financial burden and prescription
medicine nonadherence in the general population (i.e., not limited to patients with a specific
condition such as cancer). The objective of this systematic review was to answer the following
question: Are there differences in prescription drug nonadherence rates among those affected by
Methods
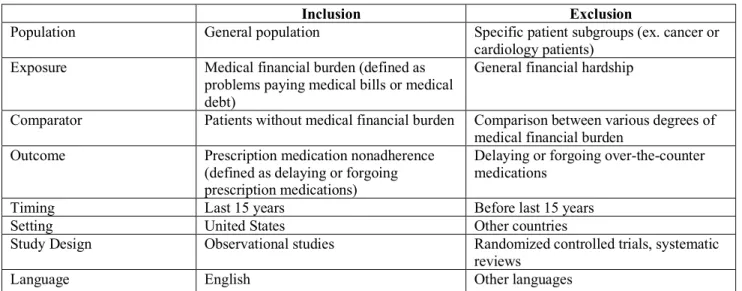
Observational studies of the general population were eligible for inclusion while those
focused on specific patient groups, such as cancer or cardiology patients, were excluded to
enhance external validity. No restrictions were placed on age to maximize the number of studies
that would meet eligibility criteria, since a low number of studies was expected. The exposure
examined by studies was specifically medical financial burden, defined as problems paying
medical bills and/or medical debt, and not general financial hardship. An example of a standard
question often used on national and state surveys to detect this particular problem is the
following: “In the past 12 months, did you or anyone in the family have problems paying or were
unable to pay any medical bills?”1 Eligible studies had to compare patients with and without
medical financial burden. The outcome was prescription drug nonadherence, defined as delaying
or forgoing prescription medications. Only studies based in the US were considered since health
behavior is influenced by cultural context. Furthermore, this review was restricted to only
English-language articles from the past 15 years. Table 1 summarizes the eligibility criteria.
Studies were identified through searching Pubmed Present) and Scopus
(2003-Present). The Pubmed search strategy was created using the Medical Subject Heading (MeSH)
term “medication adherence” and its associated keywords as well as keywords relating to
medical bills and medical debt. An adapted version of this search strategy was used in Scopus.
Supplemental Table 1 lists the full search algorithms for both databases. Reference lists of
studies included in this review were also hand searched for relevant articles. Searches were
performed on April 17, 2018.
All articles identified by database searches were screened for inclusion in this systematic
full text screening. Data extraction was also performed by the same reviewer and included the
following items: author, publication year, study design, data source, time period, sample size,
exposure ascertainment, outcome ascertainment, outcome measures, and covariates controlled
for in the analyses. Effect measures, such as odds ratio, were preferred to separate statistical
measures by group, so the former was extracted when provided.
Risk of bias was assessed at the study level based on a modified version of the National
Heart, Lung, and Blood Institute’s Quality Assessment Tool for Observational Cohort and
Cross-Sectional Studies.6 Only criteria pertaining to cross-sectional studies were used since all studies
eventually meeting eligibility for inclusion in this systematic review were cross-sectional.
Studies were rated as good if completely fulfilling the criteria, fair if partially fulfilling the
criteria, or poor if not fulfilling the criteria. Since different studies adjusted for different
covariates, additional analyses, such as summary measures or measures of consistency between
studies, were not performed.
Results
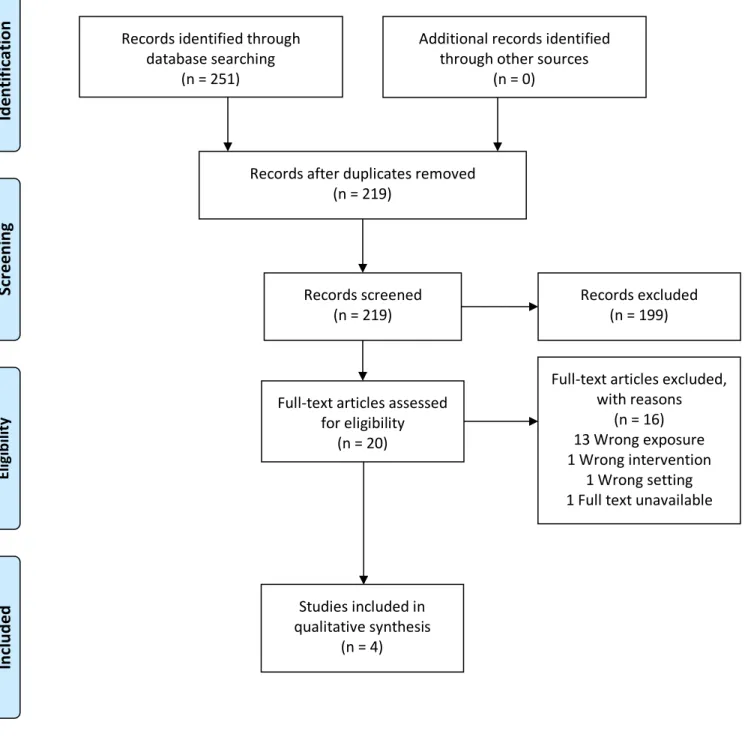
Literature Search Results
Searches in Pubmed and Scopus yielded 219 unique titles and abstracts. After review of
all titles and abstracts against the criteria outlined in Table 1, the full-texts of 20 abstracts
marked as potentially relevant were reviewed again using the same criteria. The most common
reason for studies being discarded during full text screening was that medical financial burden
was treated as an outcome rather than as an exposure. A total of 4 studies remained and were
included in this systematic review.7–10 No additional studies were identified through hand
Characteristics of Included Studies
All four studies in this systematic review were cross-sectional and based on existing
datasets or survey results. One study was based on nationally-representative data while the rest
were based on data at the state level.10 The most recent data used by studies was from 2010.7,8
Two studies measured the exposure as problems paying medical bills in the past 12 months, one
study measured it as only current medical debt, and one study considered the exposure as both.
Table 2 summarizes study characteristics for all included studies.
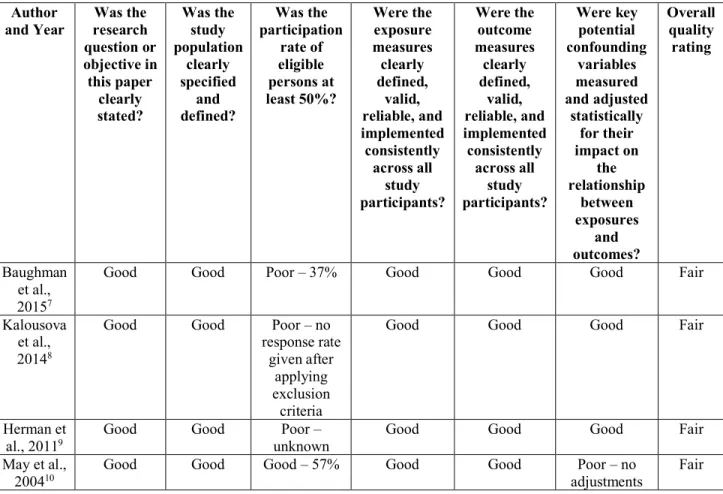
Overall quality was rated as fair for all studies. (Table 3) The most common criteria rated
as poor was whether participation rate of eligible persons was at least 50%. Three studies were
rated as poor in this aspect because they either had low response rates or did not report it.
Confounding variables were measured and adjusted for in all but one study.10 All studies
received good ratings for clearly defining the research question, study population, and exposure
and outcome measures.
Outcomes of Included Studies
Results of all studies showed that medical financial burden was associated with increased
prescription medication nonadherence (Table 2). When the exposure was measured as problems
paying medical bills in the past 12 months, it was associated with six to seven times the odds of
prescription medication nonadherence, adjusting for potential confounding variables.7,9,10
Meanwhile, when the exposure was measured as currently paying off medical bills or debt, it
was associated with three to four times the adjusted odds of prescription medication
Discussion
All four included studies were cross-sectional and based on state or national data. Across
all studies, there was a consistent association found between medical financial burden and
increased prescription medication nonadherence, even in studies that adjusted for baseline patient
demographic and clinical characteristics. This association was stronger in studies that measured
the exposure as problems paying medical bills in the past 12 months than in studies that
measured the exposure as currently paying off medical bills or debt. Although causation cannot
be established by cross-sectional studies, the results of those included in this systematic review
likely reflect patients delaying or forgoing prescribed medications in order to cope with medical
financial burden. This coping behavior has been noted to be associated with general financial
hardship among cancer survivors by a previous systematic review.5
This systematic review is limited by the low number of studies meeting eligibility
criteria. Furthermore, the studies are at risk for selection bias given the low response rates. The
low number of included studies and the heterogeneity among studies, especially relating to the
covariates used in adjusting the outcome, prevented summary measures from being calculated.
Further research should be performed to better understand the association between
medical financial burden and prescription drug nonadherence. Cohort studies would establish the
temporal relationship between medical financial burden as the exposure and prescription drug
nonadherence as the outcome. Studies should also consider baseline prescription drug adherence
and adjust for it in the analysis. If future results continue to support this association, new
strategies to improve prescription drug adherence may improve health outcomes of patients with
References
1. Cohen RA, Zammitti EP. Problems Paying Medical Bills Among Persons Under Age 65: Early Release of
Estimates From the National Health Interview Survey, 2011-June 2016.; 2016.
https://www.cdc.gov/nchs/data/nhis/earlyrelease/probs_paying_medical_bills_jan_2011_jun_2016.pdf.
2. Zafar SY, Peppercorn JM, Schrag D, et al. The Financial Toxicity of Cancer Treatment: A Pilot Study
Assessing Out-of-Pocket Expenses and the Insured Cancer Patient’s Experience. Oncologist.
2013;18(4):381-390. doi:10.1634/theoncologist.2012-0279
3. Ramsey SD, Bansal A, Fedorenko CR, et al. Financial insolvency as a risk factor for early mortality among
patients with cancer. J Clin Oncol. 2016;34(9):980-986. doi:10.1200/JCO.2015.64.6620
4. Mongkhon P, Ashcroft DM, Scholfield CN, Kongkaew C. Hospital admissions associated with medication
non-adherence: a systematic review of prospective observational studies. BMJ Qual Saf. 2018.
doi:10.1136/bmjqs-2017-007453
5. Altice CK, Banegas MP, Tucker-Seeley RD, Yabroff KR. Financial hardships experienced by cancer
survivors: A systematic review. J Natl Cancer Inst. 2017;109(2):1-17. doi:10.1093/jnci/djw205
6. National Heart, Lung and BI. Study Quality Assessment Tools.
https://www.nhlbi.nih.gov/health-topics/study-quality-assessment-tools. Accessed June 22, 2018.
7. Baughman KR, Burke RC, Hewit MS, Sudano JJ, Meeker J, Hull SK. Associations between Difficulty
Paying Medical Bills and Forgone Medical and Prescription Drug Care. Popul Health Manag.
2015;18(5):358-366. doi:10.1089/pop.2014.0128
8. Kalousova L, Burgard SA. Tough Choices in Tough Times: Debt and Medication Nonadherence. Heal Educ
Behav. 2014;41(2):155-163. doi:10.1177/1090198113493093
9. Herman PM, Rissi JJ, Walsh ME. Health Insurance Status, Medical Debt, and Their Impact on Access to
Care in Arizona. Am J Public Health. 2011;101(8):1437-1443. doi:10.2105/AJPH.2010.300080
10. May JH, Cunningham PJ. Tough Trade-Offs: Medical Bills, Family Finances and Access to Care.; 2004.
11. Moher D, Liberati A, Tetzlaff J, et al. Preferred reporting items for systematic reviews and meta-analyses:
Table 1: Eligibility Criteria
Inclusion Exclusion
Population General population Specific patient subgroups (ex. cancer or cardiology patients)
Exposure Medical financial burden (defined as problems paying medical bills or medical debt)
General financial hardship
Comparator Patients without medical financial burden Comparison between various degrees of medical financial burden
Outcome Prescription medication nonadherence (defined as delaying or forgoing prescription medications)
Delaying or forgoing over-the-counter medications
Timing Last 15 years Before last 15 years
Setting United States Other countries
Study Design Observational studies Randomized controlled trials, systematic reviews
Language English Other languages
Table 2. Study Characteristics and Results
Author
and Year Source Data Sample Size Period Time Covariates Used to Adjust Outcome Exposure Results
Baughman et al., 20157 Ohio Family Health Survey
7,501 2010 Age, sex, race/ethnicity, marital status, LGB status, household size, education, employment, income, home
ownership, transportation, geographic region, health insurance, usual source of care,
physical health, mental health
Problems paying medical bills in the last 12
months
OR 6.75 (95% CI 5.68, 8.02) Kalousova et al., 20148 Michigan Recession and Recovery Dataset
434 2009-2010
Age, sex, race/ethnicity, marital status, education, income, net worth, health insurance, physical health,
mental health
Current medical debt
OR 3.84 (95% CI 1.70, 8.70)
Herman et
al., 20119 Arizona Health Survey
4,200 2008 Age, sex, race/ethnicity, marital status, income, health insurance, usual source of care,
physical health, mental health
Problems paying medical bills in the last 12
months
OR 6.16 (95% CI 3.87, 9.81)
Currently paying off medical bills
OR 3.68 (95% CI 2.31, 5.87)
May et al.,
200410 Community Tracking Study Household
Survey
46,600 2003 None Problems
paying medical bills in the last 12
months
OR 6.34 (calculated based on 13.9% exposed;
Table 3. Risk of Bias Assessment
Author
and Year research Was the question or objective in this paper clearly stated? Was the study population clearly specified and defined? Was the participation rate of eligible persons at least 50%? Were the exposure measures clearly defined, valid, reliable, and implemented consistently across all study participants? Were the outcome measures clearly defined, valid, reliable, and implemented consistently across all study participants? Were key potential confounding variables measured and adjusted statistically for their impact on the relationship between exposures and outcomes? Overall quality rating Baughman et al., 20157
Good Good Poor – 37% Good Good Good Fair
Kalousova et al., 20148
Good Good Poor – no
response rate given after
applying exclusion criteria
Good Good Good Fair
Herman et
al., 20119 Good Good unknown Poor – Good Good Good Fair
May et al.,
Figure 1. Article Flow Diagram11
Records identified through database searching
(n = 251)
Sc
re
en
in
g
In
cl
ud
ed
El
ig
ib
ili
ty
Id
en
tif
ic
ati
on Additional records identified
through other sources (n = 0)
Records after duplicates removed (n = 219)
Records screened
(n = 219) Records excluded (n = 199)
Full-text articles assessed for eligibility
(n = 20)
Full-text articles excluded, with reasons
(n = 16) 13 Wrong exposure 1 Wrong intervention
1 Wrong setting 1 Full text unavailable
Studies included in qualitative synthesis
Supplemental Table 1. Database Search Strategy
Database Search Algorithm
Pubmed ((medical OR healthcare) AND (debt OR indebtedness OR bills OR bankruptcy)) AND "Medication Adherence"[Mesh] OR (medication adherence) OR (medication nonadherence) OR (medication non-adherence) OR (medication compliance) OR (medication noncompliance) OR (medication non-compliance) OR (medication access) OR (medicine adherence) OR (medicine nonadherence) OR (medicine non-adherence) OR (medicine compliance) OR (medicine noncompliance) OR (medicine non-compliance) OR (medicine access) OR (drug adherence) OR (drug nonadherence) OR (drug non-adherence) OR (drug compliance) OR (drug noncompliance) OR (drug non-compliance) OR (drug access) OR (medications adherence) OR (medications nonadherence) OR (medications non-adherence) OR (medications compliance) OR (medications noncompliance) OR (medications non-compliance) OR (medications access) OR (medicines adherence) OR (medicines nonadherence) OR (medicines non-adherence) OR (medicines compliance) OR (medicines noncompliance) OR
(medicines non-compliance) OR (medicines access) OR (drugs adherence) OR (drugs nonadherence) OR (drugs non-adherence) OR (drugs compliance) OR (drugs
noncompliance) OR (drugs non-compliance) OR (drugs access)