Anne Bauers. Interaction Techniques for Large Digital Images: A Comparative Study. A Master's paper for the M.S. in I.S. degree. April, 2003. 59 pages. Advisor: Bradley M. Hemminger
Digital images are examined on computer screens in a variety of contexts, including radiology, cartography, art, and satellite imaging. Frequently these digital images are larger than computer screens, and computer software programs use different paradigms for allowing users to zoom in and out of the image and to navigate around it. With recent advances in CPU and Internet connection speed, users may view large images that are not stored locally at a rapid rate. However, there has been no systematic investigation of what image-viewing paradigms are most effective for viewing images at these faster speeds.
This paper reports on a study designed to research the types of methods that best allow users to access and view large images at both fast and slow speeds. Five different viewing techniques are described and examined. The researchers found that techniques that enable both intuitive and systematic searching tend to perform best at a fast speed, while techniques that minimize the number of interactions with the image are most effective at a slow speed. Additionally, based on an informal survey, users prefer by a large margin the Point-Zoom technique, which allows them to interact freely with the image and move around it easily.
Headings:
User Interface Design -- Usability Human Computer Interaction
Digital Images
INTERACTION TECHNIQUES FOR LARGE DIGITAL IMAGES:
A COMPARATIVE STUDY
by Anne Bauers
A Master's paper submitted to the faculty of the School of Information and Library Science of the University of North Carolina at Chapel Hill
in partial fulfillment of the requirements for the degree of Master of Science in
Information Science.
Chapel Hill, North Carolina April, 2003
Approved by:
Table of Contents
Introduction ... 3
Study Justification... 6
Methods... 9
Research Design... 9
Materials... 11
Scroll bar ... 14
Mag lens ... 15
Point-Zoom... 15
Cursor Zoom ... 15
Section Zoom ... 16
Dependent Variables ... 17
Efficiency ... 19
Attitude... 20
Pilot Experiment... 22
Participants ... 22
Procedures ... 22
Results ... 24
Efficiency of Techniques ... 24
Individual Techniques ... 29
Scrollbar ... 29
Cursor zoom ... 31
Point-Zoom... 34
Section Zoom ... 37
Mag Lens... 40
Attitudes toward Techniques... 44
Point-Zoom... 45
Cursor Zoom ... 46
Mag Lens... 46
Scroll Bar... 47
Section Zoom ... 47
Analysis... 49
Discussion ... 53
References ... 55
Table of Figures
Figure 1. Zoom Levels.. ... 13
Figure 2. Zoom levels by technique, as ratio of screen/image... 14
Figure 3. Section Zoom Boundary Overlaps... 17
Figure 4. Distribution of Targets within Images ... 18
Figure 5. Average target-finding time per image in the training set ... 20
Figure 6. Raw data results ... 25
Figure 7. Statistically significant technique correlations ... 26
Figure 8. Average Time across Images for all Participants by Technique ... 28
Figure 9. Mag lens magnification area vs. area covered by the lens... 42
Figure 10. Participant Technique Preference Summary... 44
Introduction
People today may have a variety of reasons to view large digital images on a computer screen. For example, radiologists perform diagnoses using computer video screens. Scholars and students view art images and/or photographs digitally, especially if they are unable to visit the site where the actual pieces are stored. Cartographers may wish to view maps digitally for many of the same reasons. NASA, military and other government agencies study satellite and similar types of images that are acquired digitally.
At the same time, the speed at which users may view these large digital images is increasing, even when viewers must access them over the Internet instead of a local network. With recent advances in CPU and Internet connection speed, users may view large images that are not stored locally at quite a rapid rate. However, many large-image viewing paradigms in current use are the same as those employed when viewing large images was a necessarily slow process. These methods may not be the most effective ones for viewing large images at current speeds. In the current environment, many users are able to view images rapidly, while some users must continue to view images over slow connections. Examinations of image viewing should consider viewing paradigms for both rapid and slow image viewing.
other words, the image is larger than the screen. Since users may view such images for a variety of reasons and in many different contexts, we considered the types of large-image viewing tasks users might find particularly challenging, or for which users would need to interact with the image in a number of different ways in order to successfully complete the task. One such task is that of finding a detail within a large image, as a radiologist must do when examining a mammogram for features indicative of breast cancer, or as a cartographer might do when examining a small detail within a large map. Consideration of this task poses several questions. Which methods are most effective for finding targets within images? Does using the methods at different speeds influence their effectiveness? Which methods encourage efficiency (finding the correct target quickly)? This study addresses these questions.
Another important component to this area of inquiry is investigating users’ perceptions about different image viewing techniques. For example, users may prefer to use viewing methods that are slightly slower, but more intuitive, when performing the task described above. Often preference does not equal performance. Which target-finding tools are most favored subjectively, and how does this correlate with performance? The techniques that viewers use to find details in images may also influence the type of viewing method that they prefer. Familiarity with existing paradigms of searching and viewing information electronically may also bias users towards particular methods.
techniques to be tested, subject selection, and data collection and management
Study Justification
Interest in viewing large digital images for a variety of purposes has long been apparent, and continues to grow. Several decades ago, researchers began to consider digital image interpretation in the context of image display (McKeown & Denlinger, 1982). Today, digital image viewing and interpretation plays a vital role in a number of fields. Digital images are examined by radiologists in a variety of contexts, such as mammography (Hermann, Obenauer, Funke & Grabbe, 2002; Fischer et. al., 2002; Heyden et. al., 1998), routine chest examinations (Andricole, 2002), and surgery (Eadie, Herd, & Stallard, 2000). They are also pervasive in dentistry (Farr, 2000). Digital libraries and museums collect and preserve large collections of digital images and digital maps (Hastings, 2000; Kenney & Rieger, 2000; Armitage & Enser, 1997). The United States military also uses digital images for decision making as well as combat and reconnaissance training (Ackerman, 2001; Howard, 1991).
storage efficiency and retrieval speed (Kennedy & Rieger, 2000; Gough, 1999). These other studies tend to focus on searching for specific images within a set instead of finding features in images. No studies have been performed that test specific techniques for detection of features.
Despite the relative lack of research in the specific area of digital image viewing techniques, a number of applications exist for viewing digital photographs, images, and maps. Online map providers such as Mapquest (www.mapquest.com), as well as the National Imagery and Mapping Agency (NIMA, www.nima.mil) and the United States Geological Survey (USGS, www.usgs.gov) provide map viewing and navigating capabilities to site visitors. A number of digital libraries, such as the Smithsonian Institution (http://www.smithsonian.org/) and the Museum of Modern Art (MoMA, http://www.moma.org/), provide access to digital photographs, digitized paintings and
other art objects, and digitized maps. There are also many standalone applications designed for viewing digital image data. Specialized systems, such as the Senographe DMR (GE Medical Systems, Milwaukee, WI), are used for detection tasks by
radiologists; software packages such as ArcView GIS (Environmental Systems Research Institute, Inc.) support digital viewing of feature (raster) data or image data. Berinstein (1998) reviews five image-viewing software packages with zooming capabilities, VuePrint, VidFun, NavImage, GraphX, and E-Z Viewer, which are frequently used by libraries.
(Mapquest, NIMA, USGS), clicking within an image to magnify a small portion of that image (NavImage), or clicking within the image to magnify the entire image with the clicked point at the center (ArcView GIS). Prominent image navigation paradigms include: the use of scroll bars (ArcView GIS, Mapquest, most Microsoft Office applications), moving a “magnification area” over the image in the manner of a
magnifying glass (NavImage), and clicking on arrows or using the keyboard arrows to move over an image (NIMA).
Methods
Research Design
Our goals for this study were to measure the speed at which participants are able to find small image targets within large images using different viewing techniques and to address their attitudes toward the different viewing techniques. These goals presented several challenges that we addressed in the research design. First, the task of finding a small target within a large image is naturally variable, meaning that the amount of time that it takes to find the target varies widely based upon where the study participant first looks for it. The research design needed to include enough instances of task completion by each user to control for this variability. Second, it was important that we ensure that we were testing the effectiveness of the techniques themselves, and not simply a
participant’s ability to complete the task, independent of the technique.
To explore our research questions while addressing these difficulties, we used a fixed experimental design where each participant completed the task using a single viewing technique, also know as an ANOVA with single factor independent samples. Although in many computer-human interaction studies researchers prefer to have each participant complete the experimental task with each technique being tested, we chose to restrict each user to a single technique because:
• We were concerned that if participants use multiple techniques to complete the
study, simply because they had become more proficient at task completion. This could have compromised the integrity of our results.
• Participants need to use the technique a number of times before they become
proficient at it. Since we wanted to separate the question of each technique’s effectiveness from a participant’s proficiency in completing the task as much as possible, we required participants to complete a lengthy training session to accomplish this goal. If participants were required to complete the study using multiple techniques, they would need to complete this lengthy training session for each technique, which would have required a prohibitive amount of time.
• Similarly, to compensate for the high amount of variability in the amount of time
it takes each participant to find targets, we included many repetitions of the task in the study design. Requiring participants to complete the task a high number of times for each technique in the study was unrealistic.
Materials
We tested five different image viewing techniques in the study. Each technique included several required capabilities:
• Each technique allowed the participant to view both the image and the visual
target at all times. The visual target was always a portion of the image being viewed. It was always presented at full resolution, so that if participants were viewing the image at full resolution they would be able to see the target at an identical scale.
• Each technique allowed the participant to view the entire image at one time. The
technique reduced the picture size so that it would fit in its entirety on the screen. This reduced the level of detail at which participants could view the image but allowed them to view all parts of it at once.
• Each technique allowed the participant to view all parts of the image at full
resolution. Participants could view one small part of the image on the computer screen at one time, and could navigate to other parts of the image. Although they could view only small portions of the image, they saw these sections in detail.
• Each technique allowed the participant to choose a portion of the image as the
Full Image Area Containing
Target
ZL1 ZL2
ZL3 ZL4 / Target
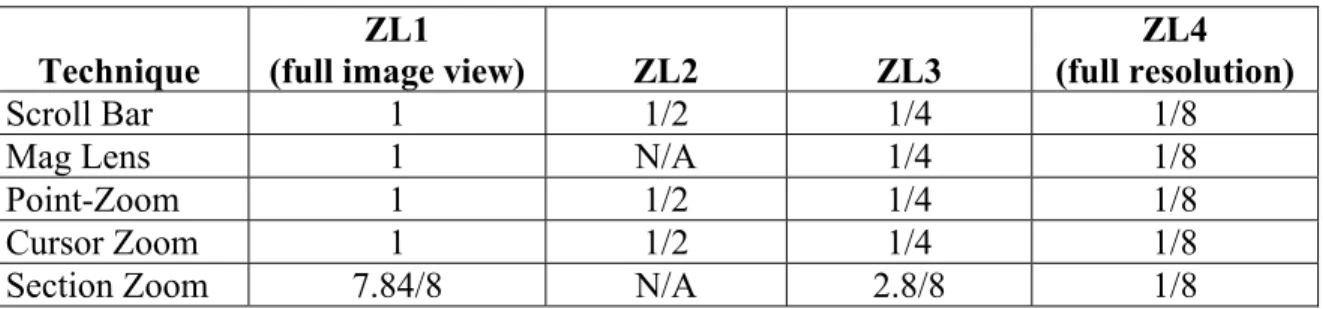
Three of the techniques, which rely on a panning motion to view the entire picture, enable participants to use all four levels of zoom. Two of the techniques, which allow users to navigate directly to a location to zoom into it, and for which an additional level of zoom would be a performance hindrance instead of a performance booster, use only three of the zoom levels. Figure 2 summarizes the zoom levels used by each technique, expressed as ratios of the screen to the entire image. (A full explanation of each technique is below.)
Technique
ZL1
(full image view) ZL2 ZL3
ZL4 (full resolution)
Scroll Bar 1 1/2 1/4 1/8
Mag Lens 1 N/A 1/4 1/8
Point-Zoom 1 1/2 1/4 1/8
Cursor Zoom 1 1/2 1/4 1/8
Section Zoom 7.84/8 N/A 2.8/8 1/8
Figure 2. Zoom levels by technique, as ratio of screen/image
Although the Section Zoom technique uses ratios that do not match exactly to those used by the other techniques, the numbers are close enough for us to use the same terminology to describe the zoom levels of the section zoom as we use with the other methods. This simplifies our descriptions of zooming across techniques.
Based on these design criteria and our research on existing and potentially useful image viewing techniques, we developed five viewing tools. The techniques were implemented as Java 2.0 programs, running on a Dell 8200 computer with 1 Gbyte of memory, and a 20” color CRT monitor.
Scroll bar
screen. When the participant is zoomed in at a level other than ZL1, she may pan around the picture by manipulating horizontal and vertical scroll bars at the right and bottom edges of the screen.
Mag lens
The mag lens technique acts as a magnifying glass and allows three levels of zoom. The participant may view the entire image at ZL1 at all times. To view a portion of the image at ZL3, the participant clicks once on the image. This brings up a square area displayed at a greater magnification. The participant may move the magnified square area (the “mag lens”) over the image to view all parts of the image at ZL3. The participant may click a second time to view the area within the mag lens at full
resolution, ZL4. Clicking a third time will turn off the mag lens.
Point-Zoom
The point-zoom technique allows the participant to zoom in and out of the image by clicking the right and left mouse buttons. Left clicking magnifies the image; the participant will be zoomed into the image with the point that was clicked at the center of the screen. Right clicking zooms out of the image in the same manner. The point-zoom technique allows four zoom levels. To navigate around the image when zoomed in, the participant may move the mouse while holding down the left mouse button to cause the image to pan in correspondence with the mouse’s motion.
Cursor Zoom
The cursor zoom technique works similarly to the point-zoom technique, but uses the keyboard for manipulation instead of the mouse. To zoom into the image, the
of the image (either the standalone keys or the number pad keys may be used). The technique always zooms into and out of the image at the point that is at the center of the screen. The participant may use the arrow keys to move around the image in either a vertical or horizontal direction (again, either the standalone arrow keys or those on the number keypad may be used). The cursor zoom allows four levels of zoom.
Section Zoom
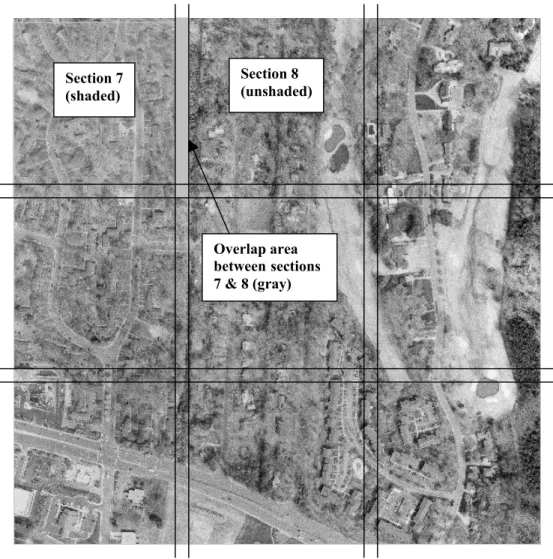
This technique divides each image into sections, which may be directly accessed by pressing keys on the keyboard that spatially coincide with the location of the section on the screen. In our experiment the screen area was divided into 9 squares, which were mapped to the 1-9 buttons on the keyboard’s numeric keypad. The upper left-hand section of the image would be selected and displayed at ZL3 by hitting key 7, the upper center by key 8, the upper right by key 9, and so forth. Once zoomed in one level, the participant may zoom in to ZL4 to see a portion of the image at full resolution. Thus, this technique allows the participant to view the in a total of eighty-one separate sections. To zoom out of any section, the participant presses the Insert key, using either the number keypad (corresponding to the number 0), or the standalone key.
An overlap of the sections does occur at the section boundaries, as illustrated in Figure 3. This allows participants to access targets that may occur in between
Section 8 (unshaded)
Overlap area between sections 7 & 8 (gray) Section 7
(shaded)
Figure 3. Section Zoom Boundary Overlaps
We tested two versions of each of these five techniques. The first version operated at a fast speed, simulating speed if users were accessing the technique on their local machines or over a local area network. The second version operated with a built-in delay, simulating how fast the images sections could be displayed on the screen if users were accessing the technique over a slow Internet connection. Thus, we tested a total of ten image viewing tools.
Dependent Variables
North Carolina. These photographs are 5000 x 5000 pixels in size and were produced by the United States Geological Survey. Since participants were asked to find small details within the images knowledge of Orange County did not assist participants in task
completion.
The targets are subparts of the full digital photograph and are170 x 170 pixels in size. Targets were chosen from all parts of the images, so that results from participants who began each search in a particular location would not be affected. Figure 4 illustrates the distribution of targets within the images, for the 160 images in the training and test sets.
Distribution of Targets within Images
0 1000 2000 3000 4000 5000
0 1000 2000 3000 4000 5000
Figure 4. Distribution of Targets within Images
ZL4 in the upper right corner of the screen. Targets were presented to participants in the same way they appeared in the image; in other words, they were never rotated or changed in any way.
Efficiency
To measure the efficiency, or speed, with which participants were able to identify the correct targets within the images, we recorded the amount of time it took participants to find each target. The image viewing tools recorded this time automatically, in
milliseconds and seconds. This allowed us to determine which methods were faster for target identification on average.
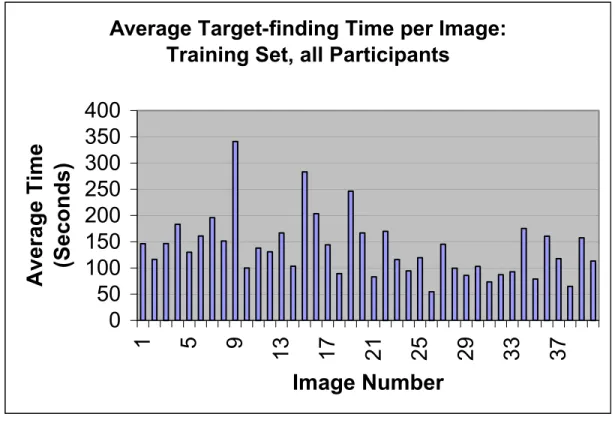
Participants completed this target-finding task in two sections: a training section and a test section. In the training section of the task, the experimenter demonstrated the technique that the participant would be using and offered the participant an opportunity to use it. The experimenter explained how the technique works and offered hints as to how to use it effectively. There were five demonstration images. Next, the participants completed a training set of forty images so that they could become proficient at using the technique and finding the targets as quickly as possible. (For a discussion of the
importance of gaining proficiency, see Research Design, above). Proficiency is indicated when participants are no longer improving at the task; our informal analysis indicates that this occurs around image 27. Figure 5, below, illustrates that the average time all
point.
Average Target-finding Time per Image:
Training Set, all Participants
0
50
100
150
200
250
300
350
400
1
5
9
13
17
21
25
29
33
37
Image Number
Average Time
(Seconds)
Figure 5. Average target-finding time per image in the training set across all participants
Once participants had become proficient at completing the task, they completed the test portion of the experiment. Each participant completed four sets of thirty images each, for a total of 120 test task instances. This high number of task instances was necessary to control the high amount of variability in task completion times, discussed above in Research Design.
Attitude
• In what ways was the interaction technique you tested successful (in helping
you locate known targets on an image larger than the size of your electronic display)?
• In what ways was the interaction technique you tested difficult to use, or made
your task more difficult than necessary?
• What do you think would be the ideal interaction technique for the task you
were asked to do?
• Do you have any suggestions for improving this experiment?
Since each participant only completed the study using a single viewing technique, the main experimental structure did not allow for a comparison by participants of the different methods. To address this deficiency, the experimenter demonstrated all five techniques, using the fast speed versions, to each participant after the post-experiment questionnaire was complete. Participants were also encouraged to test the different interactions themselves. Based on the demonstration and tests, participants were asked to rank the techniques from best to worst (meaning techniques participants would most like to use to those they would least like to use) and to describe their comparative advantages.
In addition to the measures described above, the experimenter gathered qualitative data about each participant during the test sessions. This qualitative data focused on the techniques that the participant used to find the targets, and any comments (that may be volunteered or in response to experimenter questions) that the participant had about using the technique. This qualitative data was useful in elucidating the quantitative data
Pilot Experiment
To ensure we had developed the image viewing techniques effectively and chosen appropriate targets within the images, we ran a pilot experiment. Three observers
participated in the pilot. They each viewed about 60 images using each of the five fast versions of the techniques to ensure that appropriate targets had been selected and to identify problems with the techniques themselves. They then viewed about 10 images using each of the five slow versions of the techniques. Feedback from the pilot observers was used to refine the techniques and to eliminate target choices that, on average, were extremely simple or extremely difficult to locate. Once the experiment began, the techniques and targets were fixed.
Participants
We recruited forty participants for the study, as explained in Research Design, above. All ages over 18 were accepted; we strove for good representation of both genders. Participants were required to have good vision; corrected vision is acceptable. Participant recruitment was informal, voluntary, and centered on the UNC campus. Most of the participants were graduate students in the School of Information and Library Science.
Procedures
breaking a set into two sessions. Sometimes, however, this was not possible. The exception to this rule is the forty-image training set; since this data was used for training purposes and not for formal analysis, it did not need to be completed contiguously. Ideally, sessions were more than one hour, but less than one week, apart. In 8 cases there was a longer time in between sessions.
Each participant was randomly assigned one of the ten viewing techniques, which they used for the entire study. At the beginning of the first session, the participant
completed an IRB Consent form. Then the experimenter explained the purpose and format of the study, and demonstrated the image viewing tool with the five-image demonstration set. Next, the participant completed the training set, followed by the four test sets in a randomized order. Image sets were counterbalanced across observers. At the beginning of each new session, the participant was asked to complete a five-image retraining set to re-familiarize herself with the tool before beginning the next image set. If time between sessions exceeded one week, participants were required to complete a 10-image retraining set. When participants had completed all of the 10-image sets, they
Results
Efficiency of Techniques
To understand the data generated by the study, we utilized several techniques. We explored the accuracy data using an Analysis of Variance (ANOVA) – single factor independent samples design. This study design allowed us to perform a standard logistic regression to evaluate the techniques based on completed search timings. We used the SAS system to perform the data analysis, using the Genmod procedure.
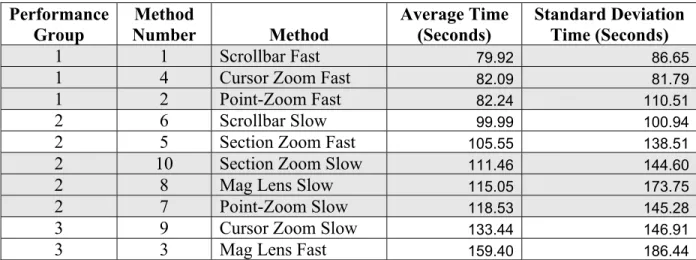
Performance
Group Number Method Method Average Time (Seconds) Standard Deviation Time (Seconds)
1 1 Scrollbar Fast 79.92 86.65
1 4 Cursor Zoom Fast 82.09 81.79
1 2 Point-Zoom Fast 82.24 110.51
2 6 Scrollbar Slow 99.99 100.94
2 5 Section Zoom Fast 105.55 138.51
2 10 Section Zoom Slow 111.46 144.60
2 8 Mag Lens Slow 115.05 173.75
2 7 Point-Zoom Slow 118.53 145.28
3 9 Cursor Zoom Slow 133.44 146.91
3 3 Mag Lens Fast 159.40 186.44
Figure 6. Raw data results
Performance Group 1.
Significant Correlations between Methods
0.9785 0.6969 0.677 0.6645 0.6455 0.4319 0.4284 0.3715 0.2106 0.1146 0.0919 0.0852 0.0416 0.0312 0.0135 0.0098 0.0089 0.0045 0.0042 0.0011 0.0007 0.0003 0.0003
0
0.2
0.4
0.6
0.8
1
2 vs 4 1 vs 4 1 vs 2 7 vs 8 8 vs 105 vs 6 5 vs 10 7 vs 105 vs 8 6 vs 105 vs 7 7 vs 9 6 vs 8 8 vs 9 6 vs 7 3 vs 9 9 vs 102 vs 6 4 vs 6 1 vs 6 5 vs 9 2 vs 5 4 vs 5
Techniques Compared
Pr>ChiSq
Figure 7. Statistically significant technique correlations
We grouped the five middle performers, Scrollbar Slow, Section Zoom Fast, Section Zoom Slow, Mag Lens Slow, and Point-Zoom Slow, into Performance Group 2. Several of these methods were very closely correlated to one another; Point-Zoom Slow (7) and Mag Lens Slow (8) were correlated with a Pr>Chi Squared value of 0.6645 and the Fast and Slow Section Zoom (5 and 10, respectively) techniques were correlated with a value of 0.6455. These correlations were almost as strong as those between the
slowest performers in the study, the Cursor Zoom Slow (9) and the Mag Lens Fast (3). The Point-Zoom Slow technique had a somewhat high correlation to the Cursor Zoom Slow (0.0852) but because the Point-Zoom Slow was so closely correlated to the Mag Lens Slow we placed it in Performance Group 2.
The Cursor Zoom Slow and the Mag Lens Slow techniques were correlated to one another with a Pr>Chi Squared value of 0.0312. Although this was not a strong
correlation, we grouped the techniques together because they performed significantly worse than the other methods.
Two groups of techniques were very highly correlated. The techniques in Performance Group 1, the fast versions of the Scrollbar, Cursor Zoom, and Point-Zoom techniques, were very highly correlated. So were the slow versions of the Section Zoom, Mag Lens, and Point-Zoom techniques. To illustrate these high statistical correlations, we have shaded these groups to differentiate them in Figure 6.
Appendix A includes the full statistical chi-square comparison by method, including those methods that were not statistically significantly related. Figure 8
Average Time across Images for all
Participants by Technique
0
20
40
60
80
100
120
140
160
180
Scrollb
ar Fas
t
Cursor
Zoom Fast
Point-Zoom Fast
Scrollb
ar Slow
Section Zoom Fast
Section Zoom Slow
M
ag Len
s Slow
Point-Zoom S
low
Cursor
Zoom Slow
M
ag Len
s Fast
Time in Seconds
Figure 8. Average Time across Images for all Participants by Technique
Individual Techniques
This section examines the target-finding techniques used by participants for each method. We explore what techniques the method seems to encourage, and how effective these techniques were, both in the slow version and in the fast version. We will look at data gathered by the experimenter and data that participants provided in the post-experiment survey.
Scrollbar
Participants using the scrollbar technique had the lowest average time per image for both the fast and slow tools, along with some of the smallest standard deviations from average time. The experimenter notes help to explain what strategies the tool enabled participants to use to complete the task so successfully. Participants tended to use a combination target-finding strategy that allowed them to take advantage of the
technique’s utility in navigating to particular areas of the photo, as well as its facility in systematic searching. Many participants would examine the entire image at the ZL1 to choose a location in which to begin scanning. Then they would zoom into a higher resolution level (generally ZL3 or ZL4) and begin systematically scanning the picture for the target, beginning the search in the area they had chosen when looking at the entire image. Using this technique, they were able to closely examine the area of the photo where they suspected the target was located. They could freely pan around this area by clicking on the horizontal and vertical scrollbars and dragging them.
If they did not find the target in a particular area, they could use a more
target. If they did not find it, they would click in the empty section of the scrollbar track to move the scrollbar (and therefore the photo) a controlled amount. In this way
participants were able to ensure that they covered all areas of the photo while scanning. This combination of facilities that assist participants in both intuitive searching and brute-force scanning made the scrollbar technique successful. As one participant commented in answer to the question of how the technique was successful, “It became easier to not search the same areas twice… I began searching in a pattern if the small image was not easily apparent.”
As noted above, participants were more efficient completing the task with the slow version of the scrollbar technique than all of the other slow methods, as well as two of the fast methods (section zoom and mag lens). The method seemed to help
participants compensate very effectively for the delay. Participants using the slower technique tended to adopt an approach that maximized zooming and minimized panning. They would choose a section of the picture, zoom into it (to ZL2 or ZL3), and search for the target within it. If the target was not found in this area, they would zoom back out and choose another area to examine. This technique allowed participants to focus on clicking to pan as well as zoom, which is much faster than dragging to pan when a delay is present. Instead of scanning the entire picture, participants clicked to the areas that were most likely to contain the target first. If participants were not successful in finding the target using this technique, they could scan the entire photo by zooming into the ZL4 and using clicks, instead of the slower pans, to scan the entire photo.
look at part of the image at full resolution, they would simply select an area for target confirmation, and examine it closely. If the choice did not match the target they would cancel the choice. One participant noted that this “allowed several modes of zooming in and let one easily scan in quadrants.”
Both the fast and slow versions of the technique did garner some complaints from the participants. Four of the six participants commented that they did not like being placed in the center of the image when they zoomed in. One participant noted, “The zoom feature was fairly inaccurate in placement.” Another described it as
“disconcerting.” Two people commented that they would have preferred to be zoomed into a corner instead of the center of the image. Participants also noted that they did not like holding down the scroll bar to see the parts of the image located beneath the target and crosshairs box. One commented, “It’s a pain that you have to hold that thing [the scroll bar] down if you want to see everything too…” Two scrollbar participants speculated on ideal search techniques. One commented that she would like “a zoom in/out controlled by cursor placement… and possibly a smooth, faster way of scrolling… What I think I would like best would be a keypad technique with general placement around the picture so parts could be jumped to quickly.” She ranked the section zoom method one and the point-zoom method two. Another explained that she would prefer “more precise controls – not limited to scroll bars. Bird’s eye view – move cursor over picture, where it zooms for you.” She ranked the mag lens method one.
Cursor zoom
low. However, the slow version of the cursor zoom was the second to last performer in average target identification time, with high standard deviations. An examination of the way participants used this technique to find targets may provide insight into why this was the case.
Like the scrollbar, the cursor zoom enabled participants to employ a combination of systematic and intuitive searching techniques. Generally, they would choose an area from ZL1 where they felt the target was most likely to be located. They would zoom into ZL2 and examine the area for the target using a panning movement. Panning with the cursor zoom technique entails using the arrow keys to move around the image. Some participants began the task using slow, measured clicking of the arrow keys to pan around, examining the image after each click. This method is very systematic but quite slow. One participant using the slow cursor zoom method chose to hold down the arrow keys to move the image more rapidly in an attempt to compensate for the delay. She lost control of the image several times and it scrolled completely off the screen. All
participants, after experimenting with these different panning techniques, settled on a rapid-fire clicking of the arrow keys to pan the image. This seemed to be the most effective panning motion for both the fast and slow versions of the technique. Participants used this motion at ZL2, ZL3, and ZL4.
initially-selected area. Participants who were able to identify targets ZL1 or ZL2 generally were faster than participants who routinely scanned the image at ZL3 or ZL4.
Participants were generally able to find targets the first time they panned over the image at a zoom level low enough for them to identify the target (as described above, usually ZL2 or ZL3), indicating that systematic searching with the cursor zoom is very effective. One participant noted that she liked that “movement [of the image] was easy to judge…when I pushed on an arrow I had a good idea of where I’d end up.” Another commented that the panning motion “feels pretty natural.” One commented, “Movement in blocks was bothersome, though I got used to it.” All of the participants with both versions of the technique avoided ZL4. One person noted, “Zooming in three times…I have to move the image little by little…it becomes very annoying.” Two of the six participants “browsed” at ZL4 by selecting targets to see if they were correct or not.
By default the cursor zoom technique moves the picture in the same direction of the clicked arrow (for example, if you click the UP arrow the image moves up) but participants can reverse the cursor direction, so clicking the UP arrow moves the image down, in the same manner as a scrollbar. Four of the six participants chose to reverse the cursor direction; one participant did not reverse the cursor direction but commented, “The ways the arrows moved the picture felt counter-intuitive.”
One cursor zoom participant noted that she “would have liked to be able to choose an area to zoom in on without centering the area first.” Two cursor zoom participants provided their ideas about an ideal technique; both of them framed their ideas as
improvements of the cursor zoom. One participant explained, “This [technique] was fine – could be improved by adding a smooth scroll.” The other participant expressed a related idea: “It would be nice to have a way – like in Photoshop – to make both short and long ‘nudges’ when moving/searching across an area.”
Point-Zoom
The fast version of the point-zoom technique performed virtually the same as the fast cursor zoom technique, while the slow version was the third worst performer, performing about as well as the slow mag lens and section zoom techniques. The point-zoom technique enables many of the searching techniques used by participants with the scrollbar and the cursor zoom, while providing several utilities that helped participants overcome the technique delay. As with the other methods, participants using the point-zoom tried to avoid ZL4, finding panning at this level to be prohibitively slow.
clicking on the picture and dragging it across the screen at a medium speed, sometimes speeding up or slowing down the panning motion, depending on how closely they wished to examine a particular area.
Two of the participants would begin searching with a more intuitive approach, choosing the most likely area for the target to zoom into first, and then proceed to a full-image scan at the ZL1 or ZL2. One participant mentioned that she felt scanning for the target was faster than trying to deduce where it was and searching for it in a particular location. While both of these participants employed scanning heavily they did avoid the parts of the images where they felt the target was less likely to be located. One
participant said she liked the technique because “it helped me focus on the parts of the image that I thought were important and disregard the rest of the image.”
The third participant using the fast version of the point-zoom employed more zooming than panning techniques to find targets. She would zoom in to ZL2 or ZL3 where she thought the target might be, and if she did not find it, she would zoom back out and choose a different location. This technique was not at all systematic; although she found a number of targets very quickly, she took such a long time on other targets that the standard deviation for her target-finding times was quite high. Her average time was also significantly lower than that of the first two participants.
three participants minimized dragging to pan by carefully examining the entire picture at ZL1 before choosing an area to zoom into using ZL2. They performed the same actions when choosing to zoom in to ZL3. If they could not find the image using zooming techniques, they would pan around the image at ZL3 instead of ZL4. One of these participants commented that she liked the targeted panning that the technique allows: “I was able to drag and circulate around an area.” The least successful of the three
participants did spend a good deal of time panning at ZL3 and ZL4. He compensated for the slowness of the technique by clicking on the image at one edge of the screen and dragging the cursor to the other edge of the screen, thereby examining the image in chunks, instead of using the constant panning motion that participants with the faster technique employed. The point-zoom technique’s ability to accommodate direct
zooming, enabling a focus on zooming instead of panning, as well as its flexibility in the ways participants could pan with it, helps to explain why the slow version of this
technique helped participants compensate for the delay more than the slow version of the cursor zoom.
so that they could restart the search process with the image already centered. Two participants would have liked to be able to select targets using the mouse instead of the keyboard; one of these suggested using a three-button mouse.
One participant mentioned that she would be interested in a technique that used the keyboard instead of the mouse to move the image because “my eyes are faster than my hand;” she thought a keyboard technique might enable faster scanning. However, when she saw the cursor zoom and section zoom techniques she commented that they had “too many buttons.” No other participants speculated about techniques that may have helped them performed the task in a better way. This indicates that they all found the technique to be easy and intuitive to use.
Section Zoom
The section zoom fast and slow methods performed about as well as one another; they were ranked as the fifth and sixth fastest methods respectively. This technique was very good for systematic searching but had several major disadvantages that prohibited it from performing as well as the point-zoom, cursor zoom, and scrollbar fast methods. Participants using the fast and slow versions of the section zoom technique employed a systematic method for searching for targets. They would choose one of the nine sections to zoom into, from ZL1 to ZL3. While two of the fast participants tended to start in the same quadrant every time, the rest of the participants examined the picture to determine the section most likely to contain the target. They would zoom into the chosen section, and then zoom into each section within it. Only one of the participants tended to find most of the targets at the first level of zoom. Unlike with the other techniques,
quadrant zoom only uses three levels of zoom instead of four, and because since this method doesn’t allow for panning, participants were not concerned with incurring the penalty for panning at the lowest level.
Virtually all of the participants commented on the technique’s usefulness for systematic scanning; one commented, “It was quite easy to be methodical.” Another participant explained it was “fairly easy to systematically zoom in on targets. Once I developed a kind of methodology for finding targets, I was able to zoom in and out quickly using the keyboard.” Reliance on a scanning system could be a disadvantage at times. Participants using the fast version of the section zoom tended to scan through the picture very quickly. All three of them noted that at different times they would become so involved with the rapid systematic search that they would miss a target or forget where they had already looked. Interacting with the method placed a mental burden on the participants, causing them to lose focus on the detection task at times. One participant noted, “One problem I have is that I start with my system and then I get distracted and start somewhere else, and then I forget where I’ve gone and where I’ve been.” Another said about the section zoom, “Although methodical, if you lost your train of thought you found yourself guessing as to whether or not you had been in that particular quadrant.” They all struggled to make sure they slowed themselves down when scanning at the lowest level of zoom, so that they could keep track of where they had been and be sure they had not missed the target.
it took them to find a target. Like the participants using the fast section zoom, they found they had better results finding targets when they approached the task more systematically and less intuitively. This was the second-fastest of the slow methods; because it is a method that does not require any panning, it was not plagued by the penalty panning incurs in the slow point-zoom and cursor zoom methods.
All six of the participants using the section zoom complained that sometimes at ZL4 targets were split between two quadrants or located in a corner of a quadrant instead of the center. They wanted to have finer control of where they were zooming. One participant expressed this when he said the technique gave him “not enough control over exactly where I would want to zoom.” Participants noted that finding targets such as a road or a utility pole in a string of power lines was very challenging because the quadrant zoom does not enable linear searching or tracking features in arbitrary directions; they were much more successful with discrete targets.
Four participants also noted that they did not find the crosshair tool useful; since they were navigating around the image with the keyboard instead of the mouse it did not provide them with any information and was sometimes in the way.
All of the section zoom participants had ideas about an ideal interaction technique; they all requested finer control over zooming. Two participants explicitly mentioned that they would like to use a scrolling technique; one said, “A combination of section and scroll techniques might work well so you could get to a high level of zoom quickly and then scroll to see those areas that were not fully captured in that particular section.” Two other participants requested finer zoom control with the mouse. One said he would like “using the mouse to either select or click and drag an area for zooming in.” One participant requested a “notation of where I had already searched” so she would not lose track of the quadrants she had visited.
Mag Lens
The slow version of the mag lens technique performed fairly well; it was faster on average than the point-zoom and cursor zoom slow techniques. However, the fast mag lens was the worst performing technique in the test set. While the mag lens technique can be particularly useful for spot-checking for targets, its lack of support for systematic searching may have placed it at the bottom of the list of target-finding techniques.
average times per image, using both versions of the technique, were very adept at picking out targets using this method.
If selective magnification was not successful participants would move to a full scan of the image. Full scanning involved moving the magnification lens, at either ZL3 or ZL4, over the entire image in a lawnmower motion. Five of the participants avoided scanning with ZL4 if possible, only moving to that zoom level after a full scan with ZL3 did not produce a result. As one participant explained, “If you use the highest level of zoom [ZL4], it is easier to see objects but harder to scan, because you lose the context of where you are looking.”
In comparison to participants using other techniques, mag lens participants spent a lot of time examining the full image. This is likely related to the fact that they had access to the full image even when they were utilizing the two zoom levels. Unlike users of the section zoom technique, participants seemed to struggle with the two levels of zoom. Although no participants explicitly requested an extra level of zoom, one participant explained, “Though two levels of zoom were necessary for locating the targets, scanning on the highest level [ZL4] was nearly impossible, but it was difficult to recognize the objects on the other level [ZL3].”
Figure 9. Mag lens magnification area vs. area covered by the lens
which portions they had not yet viewed in the lens, and found the physical sensation caused by panning a small object over a large object was nauseating.
Participants using the slow version of the mag lens technique also had difficulties performing full-image scans, but they were on average more successful. Two of the participants complained about the delay in the slow version. One commented, “The motion of the image as the cursor moved was jerky and there seemed to be a delay so that it was hard to tell how quickly and how far to move the mouse in relation to where I wanted to zoom in on the image.” However, this slight slowness seemed to help participants to control the mouse better than participants with the fast mag lens. This may have improved their ability to be systematic in the scanning process, leading to better average times overall.
Two participants mentioned that they never use the crosshair tool; since the full image is always visible, they do not find it helpful. One participant would have liked for the magnifying lens itself to have an outline so that it could be more easily distinguished from the rest of the image. Another participant wanted to move between the two
explained, “If I was able to use the keyboard to control the cursor, I [would] feel more comfortable and I also feel this technique [would be] more flexible.”
Attitudes toward Techniques
Since each study participant only had the opportunity to use a single technique throughout the study, we were unable to complete a comprehensive evaluation of
participant attitudes towards the techniques. However, we did give them the opportunity to see all five fast versions of the techniques after they had completed the study.
Participants were shown the five techniques and then asked to rank them from the technique they would most like to use (1) to the one they would least like to use (5). They were also asked to note the pros and cons of each method.
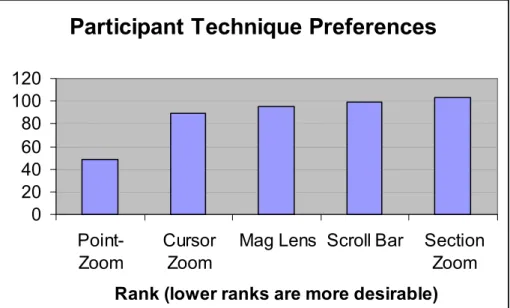
To assess which techniques participants would most like to use, we totaled their rankings across all participants. Lower rankings correspond to techniques participants would like to use more. Figure 10, below, summarizes the cumulative rankings of the five techniques.
Method Rank
Point-Zoom 49
Cursor Zoom 89
Mag Lens 95
Scroll Bar 99
Section Zoom 103 Figure 10. Participant Technique Preference Summary
following behind. Figure 11 illustrates these rankings in graph format, to illustrate the difference between the rank of the Point-Zoom and the other methods.
Participant Technique Preferences
0 20 40 60 80 100 120
Point-Zoom
Cursor Zoom
Mag Lens Scroll Bar Section Zoom
Rank (lower ranks are more desirable)
Figure 11. Participant Technique Preference Graph
In many cases, participants’ rankings of the methods echoed their comments made during the experiment or on the other sections of the survey. They chose methods that they believed would give them the features they wished their method had, such as more precise zooming controls or a better understanding of the context in which they were searching. Specific participant comments on the methods are discussed below.
Point-Zoom
“intuitive.” One participant commented that the technique “mimic[ed] Net searching.” However, two participants felt the technique would cause them to lose their orientation within the image, and one participant described searching with the point-zoom as “hit or miss.”
The three participants who used the fast version of the technique all ranked it first; two of them noted that it gave them “more control” than the other methods. One
participant who used the slow version ranked it first, another ranked it second and the third placed it at three.
Cursor Zoom
Participants ranked the cursor zoom second to the Point-Zoom. They commented that, like the Point-Zoom, it gave them “more control” while completing the task, but that it was “harder to scan” with it than with the Point-Zoom. Participants found the Cursor Zoom useful for “systematic” and “controlled” searching. However, one participant described the panning motion as “less smooth” and several participants noted that they felt using the keyboard buttons was overly complicated. One participant explained that there were “too many buttons;” another commented there was “too much to do” to make the technique work.
Two of the participants who used the fast version of the Cursor Zoom technique ranked the method first. The other four participants ranked the Cursor Zoom in the bottom three techniques.
Mag Lens
commented that they found the motion of the lens to be “smooth” and liked that “you don’t lose context in the image” because the entire image is always visible. They also described it as easy to use; two participants commented that the technique might feel “familiar” to many users. However, a number of participants noted that the Mag Lens might be “hard on the eyes.” One participant noted that it might make her “dizzy,” and another said, “This one just plain is a pain.” Only one Mag Lens Slow participant ranked the technique first; another slow participant ranked it second. All other Mag Lens
participants ranked the technique in the bottom three.
Scroll Bar
The Scroll Bar was ranked fourth in the survey, although it was one of the top three fast performers and was the most efficient slow performer. Two participants felt the technique gave them “more control” and one noted that it is “fluid and fast.”
However, several others complained that it didn’t provide enough mobility or flexibility. Several participants described it positively as “familiar,” indicating that users might be comfortable with it. However, two other participants described it as “old-fashioned.”
The participants who used the Scroll Bar did not tend to rank it highly. One fast participant ranked it first; one slow participant ranked it second; and the rest ranked it in the bottom three techniques. Those that did not rank it high complained that it was “not flexible.”
Section Zoom
The Section Zoom ranked as the technique participants would least like to use. Most participants felt the technique would cause them to lose the context of the
participants noted the technique did not provide them enough control. A few participants felt the keyboard system was too hard and contained “too many clicks.” However, a few participants were very enthusiastic about the technique. One participant liked the ability to “dissect the picture.” Another commented that it may be “hard to get lost” within the image. Several participants thought the technique was fast.
Analysis
The results of this study can be summarized as an attempt to address three questions. What image viewing techniques were most efficient at completing the task in the fast versions? Which were most efficient in the slow versions? And which
techniques did study participants prefer to use to complete the task?
Participants using three techniques, the Scroll Bar, Cursor Zoom, and Point-Zoom, were able to perform the target-finding task in the fastest average times. Since the average times for these methods were statistically correlated, we can infer that they performed as well as one another. These three techniques shared some common
The Scroll Bar and Cursor Zoom techniques, which use defined horizontal and vertical motions for navigation, include strong utilities for systematic searching.
The two other fast techniques, Mag Lens and Section Zoom, lack this powerful combination of systematic and intuitive searching capabilities. The Mag Lens allows users to navigate freely around the image, enabling intuitive searching, but systematic searching with this technique is very difficult. The loss of context caused by the lens itself also impacts its efficiency. The Section Zoom enables very systematic searching and allows users to navigate to specific areas of the image, but it does not support flexible panning around the image; this inhibits intuitive searching. The technique’s inability to center targets that may be at the edge of a section – or in between two sections – also impacts its efficiency, as does the mental burden it places on users.
Point-Zoom technique’s click-and-drag panning motion is also slower than the Scroll Bar’s movement. The Section Zoom, like the Scroll Bar, allows the user to navigate around the image in fairly large, discrete chunks. It seems the advantages of its zoom style are able to overcome the challenges this technique presents when a delay is present.
As study participants used their specific techniques to complete the target finding task, and when they completed the post-experiment survey, they commented on the types of techniques they would like to use to complete the task. Features that participants sought included control over zooming. They wanted to be able to easily navigate to a specific point they had identified. Participants also wanted the ability to maintain an understanding of the context of where they were in the image, even when examining a particular area at a higher zoom level. They also looked for control of the image itself; in general, participants wanted to interact more directly with the image. For example, many participants wanted to click on the image directly to zoom or pan.
Participants seemed to prioritize these considerations when ranking the methods in the post-experiment survey. Techniques that give users greater control over the target-finding process by providing more flexibility in zooming and panning, as well as those that give users more direct interaction with the image, were ranked higher. The Point-Zoom technique, which was overwhelmingly preferred, is the best example of a technique that allows users to navigate directly to an area of an image. The Cursor Zoom, which was ranked second by participants, also allows users to navigate directly over the full range of the image. However, it does not enable the same type of direct zooming, and the panning motion must be horizontal or vertical. The Mag Lens
by participants. This may be because it allows users to zoom into the image without losing the context of the entire image, and because it enables free panning over the image. (Since participants had only a brief exposure to the technique, they may not have had the opportunity to experience its shortcomings.) The techniques that detach
Discussion
This study demonstrates that not all zooming and panning methods for large digital image navigation performed equally. Techniques that enable both intuitive and systematic searching are more efficient than other methods at completing the task of locating a discrete target within an image. Users tend to prefer flexible techniques that give them greater control of the task. The implications of this study for designers of image viewing systems are important. When choosing a zooming and panning paradigm, designers must consider the speed with which users will be connected to their system, the number of times users will access the system, and user preferences for system interaction.
References
Ackerman, R. (2001). Commercial imagery aids Afghanistan operations. Signal, 56(4), 16-19.
Andrichole, K.P. (2002). Productivity and cost assessment of computed radiography, digital radiography, and screen-film for outpatient chest examinations. Journal of Digital Imaging, 15(3), 161-9.
Armitage, L. H., Enser, P. G. B. (1997). Analysis of user need in image archives. Journal of Information Science, 23(4), 287-99.
Bernstein, P. (1998). ‘Now that I’ve got it, what do I do with it?’ No-nonsense image utilities for non-techies. Online, 22(1), 86-90.
Eadie, C., Herd, A., Stallard, S. (2000). An investigation into digital imaging in assessing cosmetic outcome after breast surgery. Journal of Audiovisual Media in Medicine, 23(1), 12-16.
Farr, C. (2000). Digital Dentistry in the 21st Century. Dentistry Today, 19(6), 96-101. Fischer, U., Baum, F., Obenauer, S., Luftner-Nagel, S., Von Heyden, D., Vosshenrich, R., Grabbe, E. (2002). Comparative study in patients with microcalcifications: full-field digital mammography vs screen-film mammography. European Radiology, 12(11), 2679-83.
Gough, V. (1999). Large Image Manipulation Project: Designing a new library for processing of large images using a minimal amount of memory. Linux Journal, January 1999.
Hastings, S. K. (2000). Digital image managers: a museum/university collaboration. First Monday, 5(6).
Heyden, J. E., Carpendale, M. S. T., Inkpen, K., & Atkins, M. S. (1998). Visual presentation of magnetic resonance images. Proceedings of the conference on Visualization ’98, October 1998, 423-426.
Howard, P. (1991). Coast Guard studies “digital imaging” systems. Sea Power, 34(8), 48.
Kenney, A. R., Rieger, O. Y. (2000). Preserving digital assets: Cornell’s Digital Image Collection Project. First Monday, 5(6).
Mapquest. http://www.mapquest.com Cited December, 2002.
Mckeown, D., & Denlinger, J. (1982). Graphical tools for interactive image
interpretation. Proceedings of the 9th annual conference on Computer Graphics and Interactive Techniques, July 1982.
Museum of Modern Art (MoMA). http://www.moma.org Cited December 2002.
National Imagery and Mapping Agency (NIMA). http://www.nima.mil/ Cited December 2002.
Smithsonian Institute. http://www.smithsonian.org Cited December 2002.
United States Geological Survey (USGS) http://www.usgs.gov/ Cited December 2002. Watanabe, M., Nakayama, O., & Kishi, N. (1996). A bird’s-eye map display for car
Appendix A: Statistical Correlation of Individual Image-Viewing
Techniques
Key to Technique Codes: 1: Scrollbar Fast
2: Point & Zoom Fast 3: Mag Lens Fast 4: Cursor Zoom Fast 5: Section Zoom Fast 6: Scrollbar Slow 7: Point & Zoom Slow 8: Mag Lens Slow 9: Cursor Zoom Slow 10: Section Zoom Slow
Compared Chi- Compared Chi-
Techniques Square Pr > ChiSq Techniques Square Pr > ChiSq
1 vs 2 0.17 0.677 4 vs 5 13.33 0.0003
1 vs 3 100.58 <.0001 4 vs 6 8.21 0.0042
1 vs 4 0.15 0.6969 4 vs 7 28.48 <.0001
1 vs 5 16.33 <.0001 4 vs 8 24.04 <.0001
1 vs 6 10.59 0.0011 4 vs 9 49.82 <.0001
1 vs 7 32.79 <.0001 4 vs 10 19.74 <.0001
1 vs 8 28.01 <.0001 5 vs 6 0.62 0.4319
1 vs 9 55.47 <.0001 5 vs 7 2.84 0.0919
1 vs 10 23.36 <.0001 5 vs 8 1.57 0.2106
2 vs 3 92.4 <.0001 5 vs 9 11.61 0.0007
2 vs 4 0 0.9785 5 vs 10 0.63 0.4284
2 vs 5 13.14 0.0003 6 vs 7 6.11 0.0135
2 vs 6 8.06 0.0045 6 vs 8 4.15 0.0416
2 vs 7 28.19 <.0001 6 vs 9 17.58 <.0001
2 vs 8 23.78 <.0001 6 vs 10 2.49 0.1146
2 vs 9 49.44 <.0001 7 vs 8 0.19 0.6645
2 vs 10 19.5 <.0001 7 vs 9 2.96 0.0852
3 vs 4 92.92 <.0001 7 vs 10 0.8 0.3715
3 vs 5 35.86 <.0001 8 vs 9 4.64 0.0312
3 vs 6 45.89 <.0001 8 vs 10 0.21 0.6455
3 vs 7 18.51 <.0001 9 vs 10 6.84 0.0089
3 vs 8 22.43 <.0001
3 vs 9 6.66 0.0098