Wayne Stone. WEBSITE LOG ANALYSIS: Case Study of USA Cycling’s Website. A Master’s Paper for the M.S. in L.S. Degree. November, 2002. 78 pages. Advisor: Gregory B. Newby.
Numerous articles on the reasons for web log analysis exist. Much of the web-log analysis literature deals with how to collect data, technical aspects, and how to select the appropriate software for collecting the data; it will be the aim of this paper to create a user profile for USA Cycling’s website by using WebTrends software to analyze web-log files. After the user profile has been developed, it will be shown that the web-log
analysis of USA Cycling’s website can be used to make daily and long term decisions about the its functionality. In addition, this paper will cover the basic issues of web-log analysis as well as exploring the practical application for USA Cycling. To accomplish these tasks, USA Cycling’s web-logs were analyzed from August 1999 to April 2002 using WebTrends log analyzing software and key questions were developed based on observations and sent to USA Cycling for clarification.
Headings:
WEBSITE LOG ANALYSIS:
CASE STUDY OF USA CYCLING’S WEBSITE
By
Wayne Lawrence Stone
A Master’s Paper submitted to the faculty of the School of Information and Library Science of the University of North Carolina at Chapel Hill
in partial fulfillment of the requirements for the degree of Master of Science in
Library Science.
Chapel Hill, North Carolina November, 2002
Approved by:
ACKNOWLEDGMENTS
The following people were instrumental in the completion of this project.
Jennifer Winn SILS Professor Greg Newby Nikki Warren “Siggy” Kelly Walker
USA Cycling
Danny Smith USA Cycling Summer Intern
TABLE OF CONTENTS
ACKNOWLEDGEMENTS iii
LIST OF TABLE vii
LIST OF GRAPHS viii
INTRODUCTION 9
Background: USA Cycling and Its Purpose 11
USA Cycling’s Information Services 12
USA Cycling Website 12
Web Logs at USA Cycling 13
LITERATURE REVIEW 13
Questions for the paper and research 14
Measuring and Characterizing web traffic 15
Web Background 16
Origins 16
The Next Step: ARPANET, TCP/IP, 1980s and Beyond 16 State of the Web: Web Trends and Traffic 17 Semantic Components of the Web-URI, HTML,
and HTTP 18
Terms and Concepts 19
Web Traffic and Server Log Analysis 20
How- website log analysis? 21
Problems with Web Log Analysis 21
Web Traffic Measurement 22
Motivation for measurement-the whom 22
Content creators 23
Web-hosting companies 23
Network operators 24
Web/networking researchers 24
Measurement Techniques 25
Server logging 25
Proxy logging 26
Client logging 26
Packet monitoring 27
Proxy/Server logs 29
Common Log Format (CLF) 29
Extended Common Log Format (ECLF) 29
Preprocessing Measurement Data 30
Drawing Inferences from Measurement Data 31
Limitations of HTTP header information 31
Ambiguous client/server identity 31
Inferring user actions 32
Detecting resource modifications 32
METHODOLOGY 33
WebTrends Report 33
USA Cycling Contacted 37
WebTrends Data Compiled 37
Data Analyzed 38
WEBTRENDS 38
Pros 38
Cons 39
FINDINGS 39
Average User's Time 40
Authenticated Users 41
IP Identification of Top 20 Non-authenticated Users 42
Most Requested Web Pages 43
User’s Time Spent 44
Least Requested Web Pages 45
Top Exit Pages 46
Top Entry Pages 47
Number of Pdfs Download 48
Average Number of User Sessions per Hour 50
Average User Session by Day 51
Hits Failed 52
Origins of User's Sessions 53
Cached Hits 54
Bandwidth (kBytes Transferred) 55
Top Referring Websites 56
Top Search Engines Used 57
Web Browser Usage 58
Most Popular Types of Platforms Used 59
CONCLUSION 61
Recommendations 62
BIBLIOGRAPHY 63
APPENDICES 65
APPENDIX A: Screen Shots of USA Cycling’s Website 65
USA Cycling’s Homepage 65
Mountain Biking 66
Road Cycling 67
Cyclocross 68
Track 69
APPENDIX B: Measurement Case Studies 70
SILS server log study-1995-1996 70
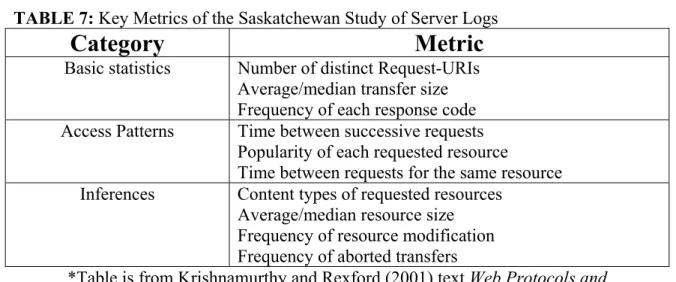
Saskatchewan server log study 70
British Columbia 71
APPENDIX C: Authenticated Users’ Rank 72
APPENDIX D: Un-Authenticated Users’ Rank 73
APPENDIX E: USA Cycling and Select User’s Server Info 74
APPENDIX F: Correspondence with USA Cycling 76
APPENDIX G: Questionnaire 77
LIST OF TABLES
Table 1: Common Log Format 29
Table 2: Extended Common Log Format 30
Table 3: Authenticated Users Overall Usage 41 Table 4: USAC’s website visitors identified by IP address and relative Activity 42 Table 5: Least Requested Web Pages Ranked First and Second 46 Table 6: Number of Pdfs Download from USA Cycling Website 49 Table 7: Key Metrics of the Saskatchewan Study of Server Logs 70 Table 8: Authenticated User’s Rank from August 1999 to April 2002 72 Table 9: Un-Authenticated Users of the USA Cycling Website
LIST OF GRAPHS
Graph 1: Average User's Time Spent on USA Cycling.Org Website in Minutes 40 Graph 2: Most Requested Web Pages on the USA Cycling.Org
Website from August 1999 to April 2002 43
Graph 3: User’s Time Spent on a Most Popular Web Page in Seconds 45 Graph 4: Top Exit Pages Identified based on User's Session 47 Graph 5: Top Entry Pages in Terms of User Sessions for the
USA Cycling.Org Website 48
Graph 6: Average Number of User Sessions per Hour for the USA
Cycling.Org Website from August 1999 through April 2002 51 Graph 7: Average User Session by Day for the USA Cycling
Website from August 1999 to April 2002 52
Graph 8: Hits Failed on USA Cycling's Website 52
Graph 9: Origins of User's Sessions for the USA Cycling Website 54
Graph 10:Cached Hits as Percent 55
Graph 11: Bandwidth (kBytes Transferred) from August 1999
through April 2002 for the USA Cycling.Org Website 56 Graph 12: Top Referring Websites to the USA Cycling.Org
Website based on User Sessions from August 1999 to April 2002 57 Graph 13: Top Search Engines Used to Access USA Cycling’s
Website from August 1999 to April 2002 58
Graph 14: Web Browser Usage for USA Cycling.Org
as a Percent from August 1999 to April 2002 59
Graph 15: Types of Platforms Used to Access USA Cycling.Org
INTRODUCTION
Sports information is an integral part of the American way of life. There are numerous websites that are dedicated to sports information and not only mainstream sports. In an effort to promote the sport of cycling both recreationally and competitively, USA Cycling (USAC) the governing body of competitive cycling, maintains a website that provides related information concerning competitive cycling events and news plus links to recreational websites.
In the recent past, flyers and magazines mailed to USAC members were the main method of disseminating cycling competition and news information. But as the Internet developed, so has the need to make cycling information available over the web. Cycling information has “come of age” as the Internet has developed over the past ten years. By distributing competitive cycling information over the web, it can be accessed by members and non-USAC members. Essentially, the information is more quickly distributed and reaches a larger target audience than was possible before using flyers and magazines. Suppose a non-USAC member searches the web for road cycling, they will likely see USA Cycling’s website as one of their hits and possibly click on it.
nonprofit organization whose goal is to promote local, regional, national and international competitive cycling. USA Cycling has a website that provides information about
competitive cycling on all levels. A discussion of cycling is not the intent of this paper; it is the intent of this paper to look at USA Cycling’s web statistics and compare web usage statistics and generate a general user profile and draw conclusions about the state of their website and how information is disseminated.
USA Cycling’s website is information gateway for competitive cycling. Every USA Cycling event is permitted and information about those races can be found on USA Cycling’s website. There are races that are not permitted and do not appear on USA Cycling’s website. Any statistics or information pertaining to those races will not be covered in this paper. Before the advent of USA Cycling’s website, races were promoted by using flyers and magazines. This type of advertising is not as far reaching as the web because it potentially did not reach non-USAC members. Now, when race promoters are granted a permit, their race will be entered into USA Cycling’s event database, which is searchable by event type or date. Thus race promoters can reach a larger audience than before and hopefully attract more racers to an event.
example, mountain bike events might be made up of the following events: cross country, downhill, mountain-cross and/or dual slalom. A mountain biking race does not have to include all these events, but it might. In addition to race information, USA Cycling’s website serves as an outlet for racing news and results throughout the US and the world. There are links to race information around the world. During big cycling events like the Tour de France, there are daily updates and results and links to other websites for race news and information. USA Cycling’s website is the main source for US racing news and it focuses and spotlights US racers in international events. There are several cycling websites that provide daily updates and reports about all types of cycling, but they typically are centered around the European cycling community.
Background: USA Cycling (USAC) and Its Purpose
USA Cycling’s Information Services
“USA Cycling is the official cycling organization recognized by the United States Olympic Committee (USOC) and is responsible for identifying, training and selecting cyclists to represent the United States in international competitions. USA Cycling, doing business as the USCF, NORBA and USPRO, controls nearly two-dozen major events each year and issues permits for up to 3,000 more.” On USA Cycling’s website there is information about the five major racing discipline they manage. The five disciplines include road, mountain bike, cyclocross, bmx, and track racing. “The major activities of USA Cycling ensure the ongoing development and safe participation in the sport of cycling.”
USA Cycling Website
to access a variety of links that contain information about the Under 23 team, career information and athlete bios.
Web Logs at USA Cycling
No raw web-logs were analyzed for this paper. WebTrends data from August 1999 to April 2002 was reviewed and selected data was compiled into spreadsheet format and analyzed.
LITERATURE REVIEW
Yu and Apps (2000) define validity as the extent to which the measurement measures what it intends to measure. They insist for log files to be valid, the following conditions must exist:
There has to be a defined range of data for the study-some type of time frame, the selection and implementation of the appropriate logging program must be used, a suitable analysis package must be employed, there must be an integration of the data into a formal analysis package, the variables in the analysis package should be defined, assessments of the validity of the measurements should be taken into account, and the use descriptive and inferential stats must be used to describe the data.
Questions for the paper and research
What are the main reasons a web user visits USA Cycling? What layers of information are they looking for and how easy is it for them to find this information? The study sports information and website analysis is much like the study of why people visit websites in general. The difference being that (most) USA Cycling website users are seeking information pertaining to competitive cycling. Therefore, USA Cycling must maintain a functional website that supplies the sought after information. There are two main questions with subset questions that seem to arise when websites and sports intersect.
1. What do USA Cycling users want to know?
a. How do they go about gathering the information?
b. What information is important to them? Events? Forms? News about racers?
2. How does the USA Cycling’s website function as an information provider? a. Is the website usable?
b. What do the server logs indicate about visitors to the website?
c. Do cycling enthusists seek information in other formats? Magazines? Newsletters? Television?
It is the intent of this literature review to introduce the reader to the basics of web log analysis. It will be the goal of the author to determine the following questions about the USA Cycling’s website by analyzing historical WebTrends data for the website. By compiling the historical data, it is the author’s intent to generate an USA Cycling user profile. The following information will be compiled to create a user profile and answer the subsequent questions:
• Average user's time spent on USA Cycling’s website, • Most and least requested web pages on the USA Cycling, • User’s time spent on the most popular pages,
• Top exit pages identified based on user's session,
• Average number of user sessions per hour for the USA Cycling, • Hits failed on USA Cycling's website,
• Origins of user's sessions for the USA Cycling website, • Cached hits as percent,
• Bandwidth (kBytes transferred),
• Top referring websites to the USA Cycling.Org website, • Top search engines used to access USA Cycling’s website, • Web browser usage for USA Cycling, and
• Types of platforms used to access USA Cycling’s website.
Measuring and Characterizing web traffic
The rise of the electronic environment over the past 30 years has given rise to new user study techniques that include web log files analysis. Yu and Apps (2000) indicate, “log file data represent a major thrust of evidence in an area where hard data has been in short supply.”
Web proxies and servers create logs as a routine part of part of performing HTTP transactions. Measurements can also be collected passively by monitoring links in the network or actively generating requests to targeted servers. Since early days of the web, researchers and protocol designers have analyzed measurement data to characterize web traffic and evaluate techniques for improving web performance. Web performance depends on how user access patterns interact with the underlying protocols and software components. Measurement and analysis of Web traffic have also played a crucial role in the development of benchmarks for comparing different proxy and server
packet monitoring and active measurement. Before we examine the meat of web traffic measurements, a brief overview of the web’s origins is in order.
Web Background
Krishnamurthy and Rexford (2001) indicate that Tim Berners-Lee first proposed the web in 1989, his vision was that the web would be a universe of information
accessible via networked computers. The web has become an intuitive graphical interface that allows users to look through a compilation of web pages by clicking on links free from format or location worries. The web allows users to search for information, send/receive electronic mail (email) and conduct business transactions. Essentially, the web is a networked application that links users via computers around the world.
Origins
Krishnamurthy and Rexford (2001) state that Vannevar Bush’s proposal in 1945 for Memex marks the beginning point for the web. Bush suggested that a mechanical retrieval device, memex, could store information (books, records, and communications) and this information could be retrieved quickly and efficiently. The memex essentially enlarged one’s memory. Bush was worried about the speed at which information was being produced (through publications) would outpace the speed at which human could access the information.
The Next Step: ARPANET, TCP/IP, 1980s and Beyond
Bush’s article set the stage for large scale indexing of text and multimedia
mid 1960s, ARPANET was conceived as a way for researchers to share information with each other via supercomputer connectivity. The United States Department of Defense was interested and by the late 1960s there were efforts to standardize the information network communication protocols. During the 1970s, the scientific community used ARPANET to exchange information, connect to remote machines, email, and copying files between machines. By the end of the 1970s, many universities and research organizations around the world could communicate through ARPANET. TCP/IP protocols were finalized in 1980. Berners-Lee was influenced by hypertext and wanted to link information on the CERN, the European Laboratory for Particle Physics near Geneva. In 1989, Berner-Lee’s proposal was called “Enquiry Within” and was written a decade earlier. Several other systems that searched and accessed information over the Internet already existed such as FTP, Gopher, Archie, WAIS (Wide Area Information Servers). FTP allows users to retrieve and store files on servers and is password protected. In the 1970s and 1980s, it was the main means of distributing software and large documents over the Internet. By 1990, FTP was responsible for over half the Internet traffic.
State of the Web: Web Trends and Traffic
responsible for 75% of the traffic on the Internet. Initially, the web was to provide public access to information, but this quickly changed. Many companies and entrepreneurs used the web to directly market customers and some companies use the web as an internal information network (salary/benefits/policies) for employees to access.
Web usage in the United States of America has increased 811% from 18 million in 1995 to 164 million in 2002 according to Nielsen Net Ratings. Many factors have contributed to the increase, including, but not limited to more personal computers in the home and work place and a shift from paper to electronic communications and
commerce. In some instances, the web has replaced traditional methods of information gathering. According to a survey conducted by ESPN.com (an all sports media network), men ages 18-34 spend more time surfing the net (12.2 hours) than watching television (12.1 hours) and the number one reason is to seek sports information.
The rise of the web and specific information seeking behaviors triggered researchers to begin investigating web/information-seeking behaviors of people. Currently, there are two main methods in which to study web usage, usability test and web server logs. When used together, they can provide insight to the “hows” and “whys” of web usage. Independently, they function well, but do not provide the whole picture. Meyer (2000) has suggested that server logs provide much information in the way of data, but little about analysis.
Semantic Components of the Web-URI, HTML, and HTTP
identifies a “web resource”. A URI is a universal naming mechanism for web resources. The URI points to a “black box” were the request methods are recognized and a response is produced. A URI is a formatted string like http://www.unc.edu/~stonw/raceteam.htm. An URI typically consists of the following three parts: HTT, the protocol for
communicating with the server; www.unc.edu, the name of the server and
~stonw/raceteam.htm, the resource at the server. Hypertext Markup Language (HTML) provides a standard representation for documents in ASCII format and HTML was derived from the generalized Standard Generalized Mark-up Language (SGML). HTML applications allow authors to format text, reference images, and embed hypertext links with a document. Hypertext Transfer Protocol (HTTP) is a “standard, well-defined” communication method for web components denote Krishnamurthy and Rexford (2001). They contend that HTTP is the most common way information is transferred on the web and defines the format and meaning of the messages that are exchanged between web components. HTTP defines the syntax of the code and how each line should be
understood. HTTP is a request-response protocol; the client sends a request message and the server replies with a response message.
Terms and Concepts
There are several terms that are standard within the world of the web. This section will be used to designate a general definition for each of the following terms that appear in Web Protocols and Practice: HTTP/1.1, Networking Protocols, Caching, and Traffic Measurement:
• Content: the exchange of HTTP messages provides web users with access to resources,
• Underlying Network: the Internet provides the backbone for communications between web components,
• Standardization: helps ensure that web components can communicate with each other,
• Web traffic and performance: software and network efficiency impacts users perception of web transfers; analysis yields information that help improve efficiency and
• Web applications: web caching and multimedia are two factors that affect web performance and user experience (2001).
Web Traffic and Server Log Analysis
Krishnamurthy and Rexford (2001) maintain that there are three main steps in web traffic measurement-monitoring web traffic from a location, generating web traffic measurement in some format, and processing the records for analysis. Zhang indicates the following issues that need to be answered before undertaking a web server analysis: What established the need for the analysis? What are the objectives and information requirements? What are the evaluative data sources and design sampling procedures?
And finally, what is the analysis and how to apply the results? Yeadon (2001), a web coordinator in Great Britain, states that web tracking services and software enable the collection of information about a website and create virtual “footprints” of visitors to the website. It is through the virtual “footprint” that web log analysis tries to understand characteristics about users. Hochheiser and Shneiderman (2001) suggest that
understanding user’s visit patterns is “essential for effective design” of websites that include on-line communities, government services, digital libraries, and electronic commerce. Yu and Apps (2000) essentially agree with Zhang and state that to
inferential statistics. When these have been completed, a more in-depth picture of users can be established and design or redesign of a particular website can take place.
How- website log analysis?
Yeadon (2001) points out that website statistics provide information about usage over time, popularity of certain pages, guide design and uncover navigation problems. These are the most pertinent to web design teams and webmasters wanting to maximize a visitors experience on a website. Yeadon (2001) suggests that following information can be collected from web pages and server logs: Basic-page based counters that display the number of hits on a page; these provide the least information; Intermediate-third party services that gather and report on site usage; the collection agencies logo has to be on page and may distract from visitors experience; and Advanced-computer software packages that collect and analyze server produced log files-Web Trends or Analog.
Problems with Web Log Analysis
Yu and Apps (2000) insist the following problems are inherent with log files and can cause confusion when trying to interpret user behavior:
1. Web caching,
2. Application of ambiguous usage measurements, 3. Log files can get large and unwieldy,
4. Lack the flexibility and adjustability of human eyes during observations-not knowing where the user looks,
5. Duplicates information from users repeated log –ins,
6. Tells what user does, but does not tell why-other contextual information must be collected, and
7. Several other variables including-frequency of use, breadth of use, time of use, use of functions and features can limit the yield of web server log analysis.
yield a lot data, but not offer any type of full depth analysis of the visitor. They
recommend combining server logs with usability testing. Web caching can skew results significantly, Nicholas (2000) and Meyer (2000) suggest that that 32% to 55% of web pages are cached by the browser and are not recorded in the server web logs. Zawitz (1998) notes, “server logs and their measures were designed originally to measure and managed server traffic and not to analyze the use/effectiveness of websites.” The key word is analyze and its interpretation is up for debate. Another noted problem is the time of the day when web server logs are analyzed. Certain times of the day would yield much higher or lower web usage. In addition, time of the year can have significant impacts of log server analysis. A university library’s web page would probably receive more use during the academic year versus use patterns in the summer months. To adjust for this, most studies have used a one to two year time period to analyze web server logs. Randomizing the time interval sample over a one to two year time interval seems
appropriate and looks to give suitable results. In addition, they add that “hits” do not necessarily reflect user’s interest. In fact, to reach a desired page, one might have to navigate through many “pre-pages” before arriving at the desired web page.
Web Traffic Measurement
Motivation for measurement-the whom
the same time as the user interacts with the system. Yeadon (2001) adds the following reasons why website statistics can be useful:
1. Give you indications of usage over time,
2. Help with server hardware upgrade choices (if needed),
3. Can demonstrate the need to keep jobs in shrinking budget times, 4. Indicate what pages are hot and those that are used less,
a. Hint for hot/quick links,
b. What links to put on home page,
5. By knowing browser type, the webmaster can make site the most accessible and appealing to the audience,
6. Interpret visitors navigation methods (positive and negative)-what seems to be a “logical” route to a particular piece of information-might be an arduous slog for the visitor, and
7. Can indicate what times would be good for server maintenance when traffic is low.
Content creators
Krishnamurthy and Rexford (2001) contend that web content creators can use web traffic measurements to know how long visitors visit a website and how many pages visitors download. In addition, they suggest that if visitors leave after visiting one or two pages the website might need reorganization or more interesting material. High latency, “the time between the initiation of an action and the first indication of a response” or low throughput might cause the web designer to redesign the website for telephone modem visitors.
Web-hosting companies
comparing web server software and benchmarking server performance. Measuring traffic could inform web-hosting companies whether or not surrogate servers could handle request.
Network operators
Krishnamurthy and Rexford (2001) declare that companies with local area networks might benefit by installing a caching proxy and measuring what percentage of requests can be handle by the shared cache. An Internet Service Provider (ISP) could do much the same by monitoring web traffic and estimating the amount of bandwidth that could be saved by using cache proxy in a local network. “Measurement of web traffic can help the network provider identify the most popular websites among its users and to track the latency in transferring content to these sites.” Popular web sites that have poor connections might necessitate the allocation of more resources for that site. Since the web is responsible for most traffic on the Internet, web traffic measurements are useful in the testing of network equipment like routers and assessing the load on Domain Name System (DNS) servers.
Web/networking researchers
The research community for evaluating the performance of web protocols has used web traffic measurements and software components state Krishnamurthy and
cache validation, and prefetching are web-caching techniques that were developed by measuring and studying web traffic patterns.
Measurement Techniques
Krishnamurthy and Rexford (2001) declare web browsers, proxies, and servers can generate logs as part of handling requests. Also, hints of web traffic can be monitored passively through link monitoring and router information.
Server logging
Krishnamurthy and Rexford (2001) affirm that web servers typically generate logs as part of client processing and each log relates to HTTP requests handles by the server. Typical information yielded includes information about requesting client, the time requested, the request and the response message. Server logs have given site
administrators a vehicle to examine access patterns of clients to a certain set of resources. Some problems with server logging include lack of detailed information, meaning
recording the header of each request would impose a significant overhead. Most logs record the request method, Request-URI, and response code. In addition, time is not an exact measurement, but rather when the request was received and when the server started or finished the requests.
Each entry in a server log includes information about the client responsible for the request like clients’ IP address or hostname. However, associating request is a difficult proposition because of proxies, shared client machines, and dynamic IP address
assignments. Proxies can generate requests on behalf of multiple users making it difficult to determine single user requests. Organizations typically have shared computing
in this situation. IP address can change overtime for a certain machine. When users connect to the Internet via modem, ISPs assign IP address to clients based on what is available in the pool of IP addresses.
Proxy logging
Krishnamurthy and Rexford (2001) express that web proxies create logs as normal operations, cover a wide range of requests for web sites and can be more detailed than server logs if the proxy is located near the requesting client. The first proxy in the chain from the user to the origin server can distinguish between requests of different users. Distinguishing between the users can be valuable for studying access patterns. Proxy logs include requests that are satisfied by the proxy’s cache and origin server would never see or record a particular request. Also, proxies can help determine the relative popularity of a site and help direct web caching policies.
There are some disadvantages of proxy logs-proxies do not see the requests satisfied by web browser caches or other proxies closer to the client. The proxy does not record requests to any particular server and this makes it difficult to determine request rates for popular sites and resources. Web proxy might also be quite “homogenous” based on the set of clients in terms of geographical location and bandwidth. In addition, commercial institutions typically do not make proxy logs public knowledge.
Client logging
the browser’s cache and keyboard/mouse operations, and the browser can determine when a request has been aborted by pressing the “STOP” button-this would never be recorded by the origin server.
In contrast to server and proxy logging, there is no standard for browser log formats. Popular browsers do not generate logs by default, but need to be modified and distributed to users. The source code for popular browsers is not typically available and to understand user patterns, a large study would need to be conducted using the modified browser. Another alternative that Krishnamurthy and Rexford (2001) put forth is to run a proxy server on the client’s machine and configuring the browser to make request to the proxy. A typical proxy would know what requests were satisfied by the browser’s cache, therefore the browser’s caching capacity would have to be disabled. By forcing the browser to generate HTTP request might negatively affect performance, which might affect the user’s attitude towards browsing.
Packet monitoring
In Krishnamurthy and Rexford’s book, they indicate that logs collected at the application level have no or little information about network activity. They suggest that packet monitoring can produce “detailed traces of web activity at the HTTP, TCP and IP levels.” Packet monitoring does not affect the performance of the web, therefore the users do not experience any “slowdowns” and it can provide an exact “timestamp” on the request/response timeline. Packet monitoring can help analyze aborted HTTP transfers that are difficult to understand by using web logs.
hardware considerations also. The packet monitoring system must be able to capture the data, process it, and store it why link speed increases. Processor and memory limitations plus disk speed make it challenging to monitor high-bandwidth links. Packet monitoring is much more costly than client, proxy or server logging.
Active measurement
Krishnamurthy and Rexford (2001) assert that using client, proxy, server logs, and packet monitoring to study user performance has two main problems. First, all the HTTP measurement methods are taken at a single location which makes it difficult to determine the user’s experience and to breakdown components of a delay. Second, these
measurement techniques monitor transfers “in the wild” and there is no control over when these request occur. An alternative method of collecting measurement data is by employing an active method. This is when a user sends a request and that information about the response is recorded such as a timestamp and HTTP headers. When one conducts an active measurement, there are three key issues to contend with. First, where should the modified user agent be located? Client/server performance varies
considerably depending on relative location. A Russian web user visiting a website hosted in North American using a telephone modem would not have the same experience as a Canadian using a cable modem connection visiting the same website. Second, what type of request to generate? Web sites are hosted on a multitude of hardware platforms, software, network connectivity, and popularity of the site. Third, what measurements to collect? The information collected in an experiment has a direct bearing on what
Proxy/Server logs
Krishnamurthy and Rexford (2001) indicate that most proxies and servers generate logs as normal operating procedures. Each log entry represents a single request/response pair and includes other fields that correspond to the requesting client, the time of the request, and the HTTP request/response message. There are no standards for log format and interpretation varies also.
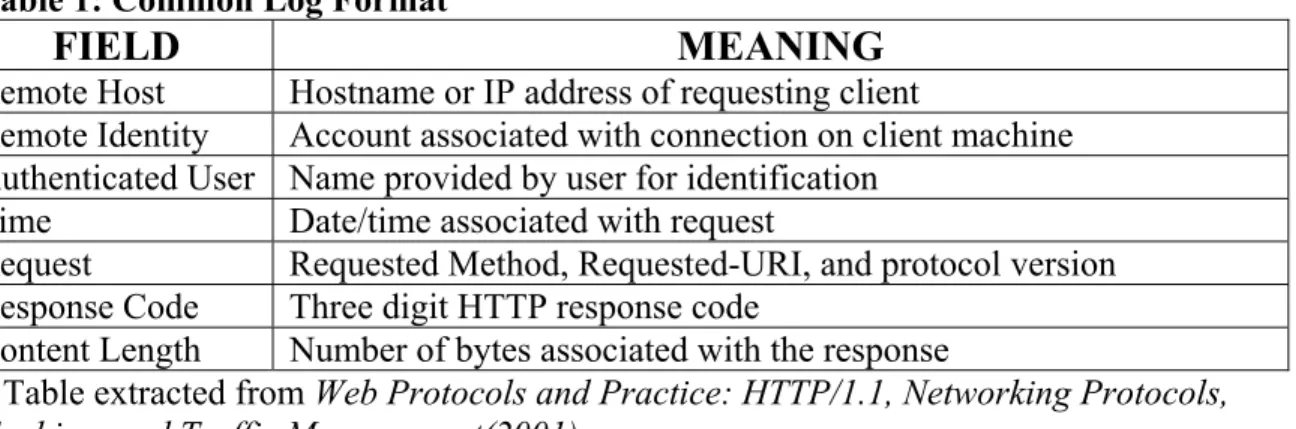
Common Log Format (CLF)
The most common log format is the NCSA Common Log Files (CLF) says Nicholas (2000). TABLE 1, below, shows seven fields for CLF and gives their basic meaning.
Table 1: Common Log Format
FIELD MEANING
Remote Host Hostname or IP address of requesting client
Remote Identity Account associated with connection on client machine Authenticated User Name provided by user for identification
Time Date/time associated with request
Request Requested Method, Requested-URI, and protocol version Response Code Three digit HTTP response code
Content Length Number of bytes associated with the response
* Table extracted from Web Protocols and Practice: HTTP/1.1, Networking Protocols, Caching, and Traffic Measurement(2001).
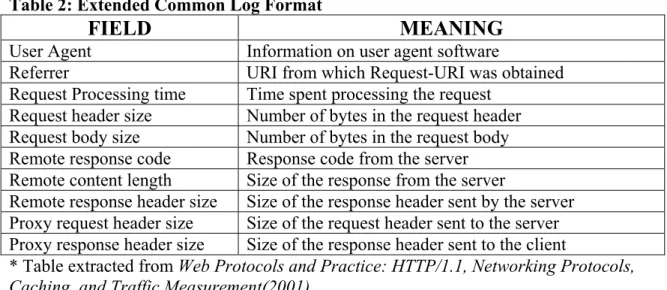
Extended Common Log Format (ECLF)
Web Protocols and Practice: HTTP/1.1, Networking Protocols, Caching, and
Traffic Measurement’s denotes that Extended Common Log Format (ECLF) represents additional fields that might be captured by server logs. Useful fields include the
Table 2: Extended Common Log Format
FIELD MEANING
User Agent Information on user agent software
Referrer URI from which Request-URI was obtained Request Processing time Time spent processing the request
Request header size Number of bytes in the request header Request body size Number of bytes in the request body Remote response code Response code from the server Remote content length Size of the response from the server
Remote response header size Size of the response header sent by the server Proxy request header size Size of the request header sent to the server Proxy response header size Size of the response header sent to the client
* Table extracted from Web Protocols and Practice: HTTP/1.1, Networking Protocols, Caching, and Traffic Measurement(2001).
Preprocessing Measurement Data
Web Protocols and Practice: HTTP/1.1, Networking Protocols, Caching, and Traffic
Measurement identifies that large volumes of data can accumulate from web logs and must be organized in some fashion before being analyzed. There are three steps that occur in the preprocessing stage.
1. Parsing measurement data to find any erroneous data. CLF server logs do not require sophisticated parsing compared to packet parsing. The parsing code can identify fields that have invalid date in the fields and generate a log that is in more manageable form. Nicholas (2000) suggests parsing is a sequence of operations that replace, add, change or delete characters in a file. They contend that the parsing function is like the “find and replace” function within word processing software.
2. Filtering measurement data to remove any unnecessary fields. Filters can delete information that is not useful in analyzing the data. Filtering might be set-up to remove records that are based on invalid fields such as timestamps that do not fit into the window of time of interest.
Drawing Inferences from Measurement Data
This section discusses the techniques for drawing inferences about HTTP headers; client/server identity, user actions, and resource modifications despite the limitations of server log data.
Limitations of HTTP header information
Krishnamurthy and Rexford (2001) indicate that server logs do not capture all the header information. They point out that most logs depict the request line and response code, but not the header fields. The Request-URI can be used to deduce the Content-Type; files that end in .htm or .html are likely to be HTML files and files that end in .jpeg or .gif are likely to be images. A cgi-bin Request-URI usually corresponds to a script and
Post requests characteristically refers to HTML forms. Other response codes such as 206 Partial Content and 304 Not Modified refer to a client requesting a subset of a resource and the request included valid information respectively.
Ambiguous client/server identity
An IP address logged by a website is not a unique identifier purport
Krishnamurthy and Rexford (2001). A single user may submit requests on behalf of multiple users or a single client may browse the web from multiple clients IP s. In addition, multiple valid request refer to the same resource and identifying that unique resource can be difficult. Consider that www.flow.com/ and www.flow.com/index.html
Inferring user actions
Determining when and how a particular user action event occurs is crucial in web traffic measurements conclude Krishnamurthy and Rexford (2001). Identifying user clicks is important to understanding user behavior and is classifying clicks is a difficult task. The “time field” from a server log can be a practical way to determine “sequence of requests by a user.” The time between requests can indicate how long a user is visiting a page within the website. Estimating the requests from user clicks is important for
studying the user’s experience. As users become more accustomed to a particular web site, the layout, there may be less time between clicks or if a visitor is clicking on the links randomly-can not differentiate between the two.
Detecting resource modifications
Krishnamurthy and Rexford (2001) state that web resource modifications need to be noted also. When a web resource is created, modified or deleted, it most be noted to completed understand a user’s experience of the web site. Therefore, statistics on how often a website changes may be just as important as the web logs. Typically, web traffic measures do not include modifications to websites. HTTP headers, response size, and timestamps may help infer modified web resources. One way to study modified
websites/resources is to compare the Last-Modified headers of successive responses for the same source. By comparing the difference in time, inferences can be made about modifications. Suppose a Last-Modified header had a timestamp of 2 PM and another
METHODOLOGY
USA Cycling uses WebTrends to analyze its raw web logs. WebTrends was founded in 1993 and their website can be found at www.webtrends.com. WebTrends can handle multiple log formats and costs $299. Schultz (1997) reports that WebTrends is unique because it can support different types of Netscape Web and proxy servers along with NCSA, IBM, and Novell web servers. In addition, Schultz (1997) says log-file processing is where WebTrends stands out above the rest of the web-log analyzers. WebTrends users can define report characteristics before and after processing. For example, you can define WebTrends to identify IP address to domain names and store the information in a database instead of having to reread the log files. WebTrends has limits, as do other log-file analyzers. WebTrends readily admits that only way to measure unique users to a website is to require visitors to log in with a username and password (Bauer, 2000). Therefore, “unique session” data generated by WebTrends and other log-file analyzers is an estimation (Warren 2002).
WebTrends Report
USA Cycling uses WebTrends to analyze their web-logs. Each month’s web-log data was imported into WebTrends and outputted into tables and graphs in HTML format so that monthly trends could be easily recognized. WebTrends can be customized to accommodate the needs of the user and USA Cycling has selected to examine the following categories in the WebTrends Reports:
is also indicated in the table.
Least Requested Pages: This section identifies the least popular pages on your Web site, and how often they were accessed.
Top Entry Pages: This section identifies the first page viewed when a user visits this site. This is most likely your home page but, in some cases, it may also be specific URLs that users enter to access a particular page directly. The
percentages refer to the total number of user sessions that started with a valid Document Type. If the session started on a document with a different type (such as a graphic or sound file), the file is not counted as an Entry Page, and the session is not counted in the total.
Top Exit Pages: This section identifies the most common pages users were on when they left your site. The percentages refer to the total number of user sessions that started with a valid Document Type. If the session started on a document with a different type (such as a graphic or sound file), the file is not counted as an Entry Page, and the session is not counted in the total.
Single Access Pages: This section identifies the pages on your Web site that visitors access and exit without viewing any other page. The percentages refer to the total number of user sessions that started with a valid Document Type. If the session started on a document with a different type (such as a graphic or sound file), the file is not counted as an Entry Page, and the session is not counted in the total
Most Downloaded Files: This section identifies the most popular file downloads of your Web site. If an error occurred during the transfer, that transfer is not counted.
Most Submitted Forms and Scripts: This section identifies the most popular forms or scripts executed by your server. WebTrends counts any line with a Post command or a Get command with a "?" as a form or script, and shows only successful hits.
Most Active Organizations: This section identifies the companies or organizations that accessed your Web site the most often.
Top Authenticated Users: This section identifies the true name and relative activity level of the users logging onto a server that requires user name and password.
Most Active Countries: This section identifies the top locations of the users of your site by country. The country of the user is determined by the suffix of their domain name. Use this information carefully because this information is based on where the domain name of the visitor is registered, and may not always be an accurate identifier of the actual geographic location of this visitor (for example, while a vast majority of .com domain names are from the United States, there is a small minority of domain names that exist outside of the United States.)
Summary of Activity by Day: This section outlines general server activity, comparing the level of activity on weekdays and weekends. The Average Number of Users and Hits on Weekdays are the averages for each individual week day. The Average Number of Users and Hits for Weekends groups Saturday and Sunday together. Values in the table do not include erred hits.
Activity Level by Day of Week: This section shows the activity for each day of the week for the report period (i.e. if there are two Mondays in the report period, the value presented is the sum of all hits for both Mondays.) The Total Weekdays line indicates the number of hits occurring Monday through Friday of the report period. The Total Weekends line indicates the number of hits occurring Saturday and Sunday of the report period. Values in the table do not include erred hits. Activity Level by Hour of the Day: This section shows the most and the least active hour of the day for the report period. The second table breaks down activity for the given report period to show the average activity for each individual hour of the day (if there are several days in the report period, the value presented is the sum of all hits during that period of time for all days).
Technical Statistics and Analysis: This table shows the total number of hits for the site, how many were successful, how many failed, and calculates the
percentage of hits that failed. It may help you in determining the reliability of your site.
Forms Submitted By Users: This section shows the number of successful form submissions compared to the number that failed. WebTrends considers anything with Post command as a form.
Client Errors: This section identifies the type of errors which were returned by the Client accessing your server.
Page Not Found (404) Errors: This section identifies "Page Not Found" (404) errors which occurred on your server.
Most Downloaded File Types and Sizes: This section identifies the download file types and the total kilobytes downloaded for each file type. Cached requests and erred hits are excluded from the totals.
Organization Breakdown: This section provides a breakdown by types of organizations (.com, .net, .edu, .org, .mil, and .gov.) This information can only be displayed if reverse DNS lookups have been performed.
North American States and Provinces: This section breaks down Web site activity to show which of the North American States and Provinces were the most active on your site. This information is based on where the domain name of the visitor is registered, and may not always be an accurate representation of the actual geographic location of this visitor. This information can only be displayed if reverse DNS lookups have been performed.
Most Active Cities: This section further breaks down your Web site's activity to show which cities were the most active on your site. This information is based on where the domain name of the visitor is registered, and may not always be an accurate representation of the actual geographic location of this visitor. This information can only be displayed if reverse DNS lookups have been performed. Bandwidth: This section helps you understand the bandwidth requirements of your site by indicating the volume of activity as Kbytes Transferred.
Most Accessed Directories: This section analyzes accesses to the directories of your site. This information can be useful in determining the types of data most often requested.
Top Referring Sites: This section identifies the domain names or numeric IP addresses with links to your site. This information will only be displayed if your server is logging this information.
Top Referring URLs: This section provides the full URLs of the sites with links to your site. This information will only be displayed if your server is logging the referrer information.
Most Used Browsers: This section identifies the most popular WWW Browsers used by visitors to your site. This information will only be displayed if your server is logging the browser/platform information.
Netscape Browsers: This section gives you a breakdown of the various versions of Netscape browsers that visitors to your site are using.
Microsoft Explorer Browsers: This section gives you a breakdown of the various versions of Microsoft Explorer browsers that visitors to your site are using.
Visiting Spiders: This section identifies all robots, spiders, crawlers and search services (i.e. Alta Vista, Lycos, and Excite) visiting your site.
Most Used Platforms: This section identifies the operating systems most used by the visitors to your Web site.
Hit: An action on the Web site, such as when a user views a page or downloads a file.
USA Cycling Contacted
In May 2002, USA Cycling was contacted via email as a potential candidate for this user profile case study. Danny Smith, USAC Intern, responded and sent the WebTrends data to be analyzed in June 2002. USAC sent thirty-three months of data covering the time period from August 1999 to April 2002. The data was sent in HTML format. The data included all the categories listed in the WebTrends Reports section.
WebTrends Data Compiled
Data Analyzed
From late August 2002 to late September 2002, the data was analyzed and reworked in order to create a profile of an USA Cycling website user. It was the overall intent of this study is to develop a user profile of a typical user by analyzing trends in USA Cycling’s web user data. Appendix B is an example of the first two pages of a monthly WebTrends’s output. The data was put into spreadsheets to examine it over the thirty-three month period in order to see larger trends than what the HTML WebTrends report showed. The cycling season is much like any other sport with an off-season and a competitive season. To gain a better understanding of the typical USA Cycling user, more data would need to be examined. The two and half years of data provided an overall view of the typical USAC website user. Typically, most cycling events take place between the months of March and October, except cyclocross. Cyclocross’s season runs from mid-October through February. As with other sports, it was hypothesized that higher website usage would take place during the competitive season. Therefore, it was crucial to examine the logs for a longer duration than a month to view the natural ebbing of the bicycling season.
WEBTRENDS
Pros
include particular data about users. WebTrends uses an algorithm in order to distinguish the number of visitors to a website.
Cons
One of the more difficult aspect of all web-log analyzers is gathering the complete picture of the website user. There are many factors that the web-log analyzer does not measure-like user intent and how the user uses the information. These are measured in more controlled type studies that this paper does not intend to venture into. Problem with web-log analyzers, like WebTrends, were covered in the Problems with Web Log
Analysis section in the Literature Review.
FINDINGS
In this section, selected information will be presented and used to compile the USA Cycling User Profile. The following criteria were selected to craft the typical user profile for USA Cycling website users from August 1999 to April 2002:
Average Time Spent on USAC website, Authenticated Users, IP Identification of
Top 20 non-authenticated Users, Most Requested Web Pages, User’s Time Spent on the
Most Popular Web Pages, Least Popular Web Pages, Top Exit Pages, Top Entry Pages,
Number of Pdfs Download, Average Number of User Sessions per Hour, Average User
Session by Day, Hits Failed, Origins of User's Sessions, Cached Hits as Percent,
Bandwidth (kBytes Transferred), Top Referring Websites, Top Search Engines, Web
Average User's Time
Graph 1 shows the average amount of time that a user spent on USA Cycling’s website in terms of minutes. Examination of the graph indicates several spikes in the time spent on the website. Three main spikes occurred in March 2000, February 2001, and February 2002.
Graph 1: Average User's Time Spent on USA Cycling Website in Minutes
0.00 1.00 2.00 3.00 4.00 5.00 6.00 7.00 8.00 9.00 10.00 Aug -99 Oct-9 9 De c-99 Feb-0 0 Apr-0 0 Jun-0 0 Aug-0 0 Oct-0 0 Dec-0 0 Feb-0 1 Apr-0 1 Jun-0 1 Aug -01 Oct-0 1 Dec-0 1 Fe b-02 Apr-0 2 Time (min)
Essentially, these spikes (more use) represent the beginning of the competitive race
season in road and mountain bike disciplines. At the beginning of the season, race dates
and event dates are released. These spikes represent an increased use in response to the
new information posted to the USA Cycling website. Thus, the start of the race season
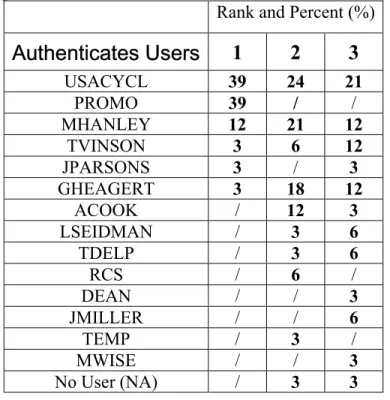
Authenticated Users
Table 3 shows the authenticated users visiting the website by identifying IP address. In addition, Table 3 displays the rank of each authenticated user and their relative activity over the thirty-three month period in terms of how much they access the USA Cycling website. For each ranking, there is an associated percent of use for that login ID.
Table 3: Authenticated Users Overall Usage Ranked and Percent Usage from August 1999 to April 2002
Rank and Percent (%)
Authenticates Users
1 2 3
USACYCL 39 24 21
PROMO 39 / /
MHANLEY 12 21 12
TVINSON 3 6 12
JPARSONS 3 / 3
GHEAGERT 3 18 12
ACOOK / 12 3
LSEIDMAN / 3 6
TDELP / 3 6
RCS / 6 /
DEAN / / 3
JMILLER / / 6
TEMP / 3 /
MWISE / / 3
No User (NA) / 3 3
thirty-three months, corresponds to thirty-nine percent usage for the thirty-three month time period. Therefore, USACYCL was the number one authenticated user thirty-nine percent of the time from August 1999 to April 2002. The percents are shown in bold for easier detection in the table.
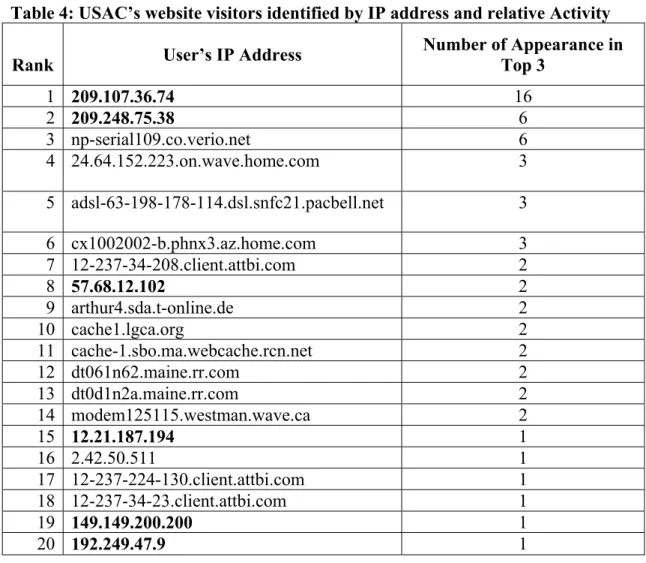
IP Identification of Top 20 Non-authenticated Users
In addition, WebTrends identifies top non-authenticated users and their relative activity.
Table 4: USAC’s website visitors identified by IP address and relative Activity
Rank User’s IP Address Number of Appearance in Top 3
1 209.107.36.74 16
2 209.248.75.38 6
3 np-serial109.co.verio.net 6
4 24.64.152.223.on.wave.home.com 3
5 adsl-63-198-178-114.dsl.snfc21.pacbell.net 3
6 cx1002002-b.phnx3.az.home.com 3
7 12-237-34-208.client.attbi.com 2
8 57.68.12.102 2
9 arthur4.sda.t-online.de 2
10 cache1.lgca.org 2
11 cache-1.sbo.ma.webcache.rcn.net 2
12 dt061n62.maine.rr.com 2
13 dt0d1n2a.maine.rr.com 2
14 modem125115.westman.wave.ca 2
15 12.21.187.194 1
16 2.42.50.511 1
17 12-237-224-130.client.attbi.com 1
18 12-237-34-23.client.attbi.com 1
19 149.149.200.200 1
20 192.249.47.9 1
The above results represent the top twenty in terms of top usage for a particular month. For example, 209.107.36.74 appeared 16 times during the 33-month period. The user’s IP address had to be ranked in the first, second or third position to be considered as a primary user of the USAC website for this study.
Most Requested Web Pages
Graph 2 displays the most requested web pages on the USA Cycling website in terms of percents. The homepage, www.usacycling.org, ranked consistently as the number one requested web page for the web site with www.usacycling.org/mtb and
www.usacycling.org/road following in second and third position respectively.
Graph 2: Most Requested Web Pages on the USA Cycling’s Website from August 1999 to April 2002 in Percent
0 5 10 15 20 25 30 35 40 Au g-99 Oct-9 9 Dec -99
Feb-00 Apr-00 Jun-00 Aug -00 Oct-0 0 Dec -00
Feb-01Apr-01 Jun-01
Aug -01
Oct-01Dec -01
Feb-0 2
Apr-02
Percent (%)
The homepage typically ranks first because it serves as the junction for the rest of the website. From the USA Cycling’s homepage, a user can link to the following main pages for different biking and racing disciplines: road, mountain, cyclocross, track and BMX.
Links for the other types of cycling have links from the USA Cycling homepage. Both the mountain biking and road biking are more popular that the other three forms of racing thus one would expect their usage to be higher based on the number of events.
These exceptions are not shown on the graph, but deserve attention and are explained here after. The third most requested web page in December 2000 was
www.usacycling.org/cx, which is the main web page for cyclocross. The Cyclocross season dictates its popularity and its popularity can be considered a seasonal
phenomenon. The cyclocross race season runs from late October to mid-February. December represents the midseason and in mid-December, the US Cyclocross National Championships are held. To access and search the cyclocross event and race database, users typically navigated through the main cyclocross web page to thus the increased traffic to the cyclocross web page. In January 2001, the membership page was the third most accessed (people getting information about upcoming race season). For February 2001 and June 2001, the www.usacycling.org/mtb site was the second and third most accessed.
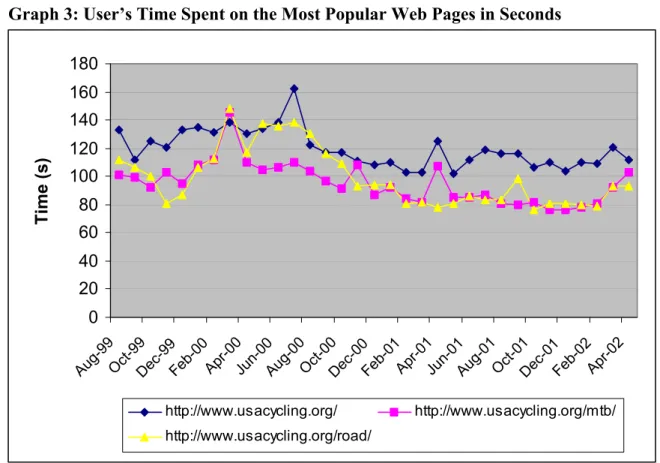
User’s Time Spent
serves as a gateway to news and events about competitive US cycling and August is a peak event month, the higher usage time is appropriate. In addition, there are usage spikes for April on the www.usacycling.org/mtb web page. Typically, by April, several major events and races have occurred and more are added to the database. Therefore, users interested in mountain biking news, events, and races would access the web page more at the start of the season.
Graph 3: User’s Time Spent on the Most Popular Web Pages in Seconds
0 20 40 60 80 100 120 140 160 180 Aug-9 9 Oct-9 9 Dec-9 9
Feb-00 Apr-00Ju n-00 Au g-00 Oct-0 0 Dec-00Feb-0 1 Apr-0 1 Jun-0 1 Aug-0 1
Oct-01Dec-01Feb-02Apr-0 2
Time (s)
http://www.usacycling.org/ http://www.usacycling.org/mtb/ http://www.usacycling.org/road/
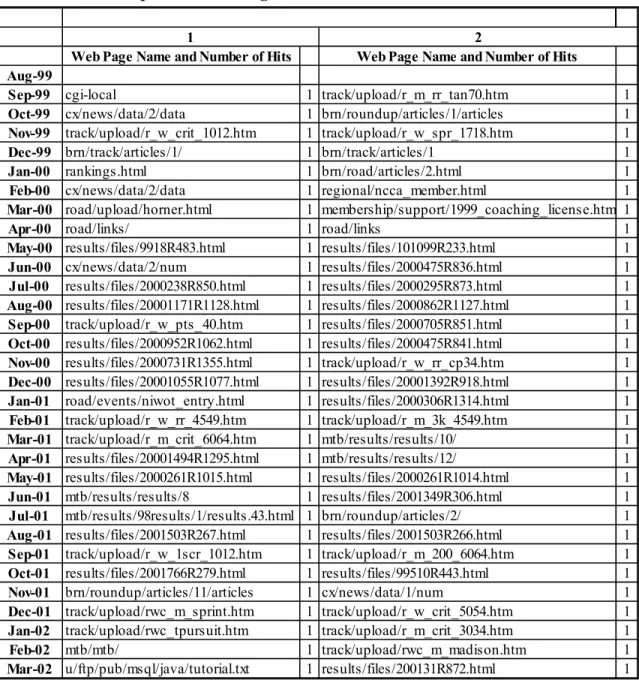
Least Requested Web Pages
Table 5: Least Requested Web Pages Ranked First and Second
Web Page Name and Number of Hits Web Page Name and Number of Hits Aug-99
Sep-99 cgi-local 1 track/upload/r_m_rr_tan70.htm 1
Oct-99 cx/news/data/2/data 1 brn/roundup/articles/1/articles 1 Nov-99 track/upload/r_w_crit_1012.htm 1 track/upload/r_w_spr_1718.htm 1 Dec-99 brn/track/articles/1/ 1 brn/track/articles/1 1
Jan-00 rankings.html 1 brn/road/articles/2.html 1
Feb-00 cx/news/data/2/data 1 regional/ncca_member.html 1 Mar-00 road/upload/horner.html 1 membership/support/1999_coaching_license.htm 1
Apr-00 road/links/ 1 road/links 1
May-00 results/files/9918R483.html 1 results/files/101099R233.html 1 Jun-00 cx/news/data/2/num 1 results/files/2000475R836.html 1 Jul-00 results/files/2000238R850.html 1 results/files/2000295R873.html 1 Aug-00 results/files/20001171R1128.html 1 results/files/2000862R1127.html 1 Sep-00 track/upload/r_w_pts_40.htm 1 results/files/2000705R851.html 1 Oct-00 results/files/2000952R1062.html 1 results/files/2000475R841.html 1 Nov-00 results/files/2000731R1355.html 1 track/upload/r_w_rr_cp34.htm 1 Dec-00 results/files/20001055R1077.html 1 results/files/20001392R918.html 1 Jan-01 road/events/niwot_entry.html 1 results/files/2000306R1314.html 1 Feb-01 track/upload/r_w_rr_4549.htm 1 track/upload/r_m_3k_4549.htm 1 Mar-01 track/upload/r_m_crit_6064.htm 1 mtb/results/results/10/ 1 Apr-01 results/files/20001494R1295.html 1 mtb/results/results/12/ 1 May-01 results/files/2000261R1015.html 1 results/files/2000261R1014.html 1 Jun-01 mtb/results/results/8 1 results/files/2001349R306.html 1 Jul-01 mtb/results/98results/1/results.43.html 1 brn/roundup/articles/2/ 1 Aug-01 results/files/2001503R267.html 1 results/files/2001503R266.html 1 Sep-01 track/upload/r_w_1scr_1012.htm 1 track/upload/r_m_200_6064.htm 1 Oct-01 results/files/2001766R279.html 1 results/files/99510R443.html 1 Nov-01 brn/roundup/articles/11/articles 1 cx/news/data/1/num 1 Dec-01 track/upload/rwc_m_sprint.htm 1 track/upload/r_w_crit_5054.htm 1 Jan-02 track/upload/rwc_tpursuit.htm 1 track/upload/r_m_crit_3034.htm 1
Feb-02 mtb/mtb/ 1 track/upload/rwc_m_madison.htm 1
Mar-02 u/ftp/pub/msql/java/tutorial.txt 1 results/files/200131R872.html 1
1 2
Top Exit Pages
Graph 4 shows the top exit pages for the USA Cycling website. The number one exit page is www.usacycling.org. This seems both intuitive and counter-intuitive. The
These three web pages are also the top used pages in terms of minutes accessed. Each page has news and information about upcoming events. Since the three pages are the top used and top exited-that seems to suggest that users are not going past these three main pages. Does this mean that users are finding the information they need or does it mean they are not finding the information and leaving the site? If users do not find what they are looking for, then typically they will return to search engine’s list to explore other websites about cycling.
Graph 4: Top Exit Pages Identified based on User's Session
0 5000 10000 15000 20000 25000 30000 35000 40000 45000 50000
Aug-99 Oct-99
Dec -99
Feb-00Apr-00 Ju n-00 Aug -00 Oct-0 0 Dec -00 Fe b-01
Apr-01Ju n-01 Aug -01 Oct-01 Dec -01
Feb-02Apr-02
User Sessions
http://w w w .usacycling.org/ http://w w w .usacycling.org/mtb/ http://w w w .usacycling.org/road
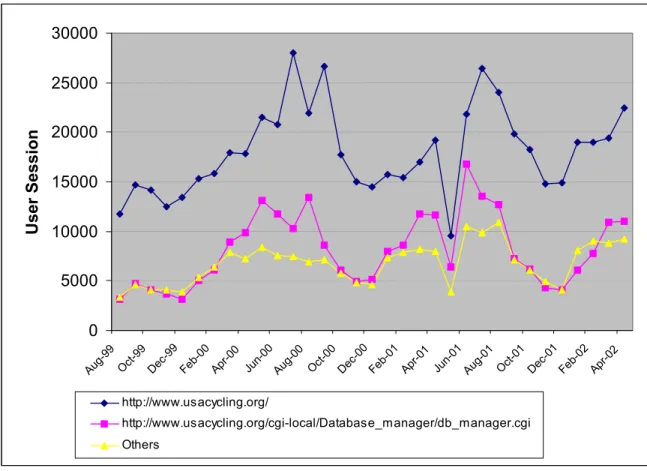
Top Entry Pages
This graph identifies the first page viewed when a user visits this site and
to the race database. The race database web page is the second entry web page on USA Cycling’s website.
Graph 5: Top Entry Pages in Terms of User Sessions for the USA Cycling.Org Website
0 5000 10000 15000 20000 25000 30000
Aug -99
Oct-9 9
Dec-99 Feb-00 Apr-00 Jun-00 Aug-00 Oct-00 Dec-0 0
Feb-01 Apr-01 Jun-01 Aug-01 Oct-01 Dec-01 Feb-02 Apr-02
User Session
http://www.usacycling.org/
http://www.usacycling.org/cgi-local/Database_manager/db_manager.cgi Others
On the www.usacycling.org/cgi-local/Database_manager/db_manager.cgi web page, a user can search for all races regardless of discipline or a user can search for a specific race in a specific state for a specific month by disciplines. This database is not fixed; it grows throughout the year. Though, most races are permitted by February or March of that year.
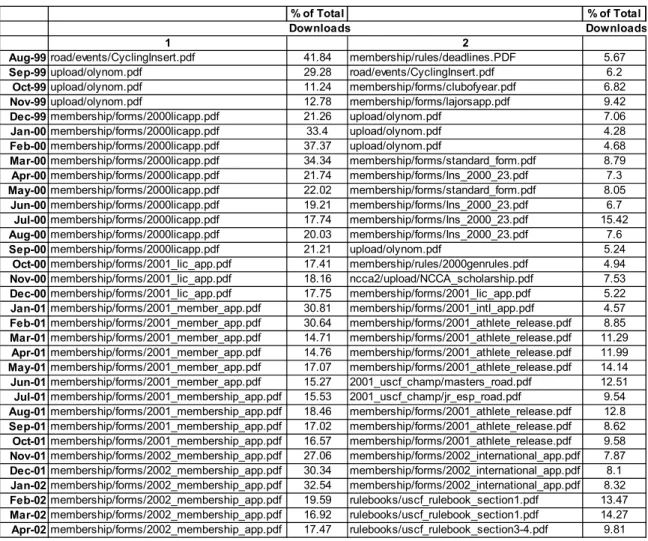
Number of Pdfs Download
application, membership application, and the athlete release form. To race in USA Cycling permitted events, participants must possess the license of that discipline before racing. Most races offer one-day license, but they are triplicate print form and are not downloaded from the computer.
Table 6: Number of Pdfs Download from USA Cycling Website
% of Total % of Total
Downloads Downloads
1 2
Aug-99road/events/CyclingInsert.pdf 41.84 membership/rules/deadlines.PDF 5.67
Sep-99upload/olynom.pdf 29.28 road/events/CyclingInsert.pdf 6.2
Oct-99upload/olynom.pdf 11.24 membership/forms/clubofyear.pdf 6.82
Nov-99upload/olynom.pdf 12.78 membership/forms/lajorsapp.pdf 9.42
Dec-99membership/forms/2000licapp.pdf 21.26 upload/olynom.pdf 7.06
Jan-00membership/forms/2000licapp.pdf 33.4 upload/olynom.pdf 4.28
Feb-00membership/forms/2000licapp.pdf 37.37 upload/olynom.pdf 4.68
Mar-00membership/forms/2000licapp.pdf 34.34 membership/forms/standard_form.pdf 8.79
Apr-00membership/forms/2000licapp.pdf 21.74 membership/forms/Ins_2000_23.pdf 7.3
May-00membership/forms/2000licapp.pdf 22.02 membership/forms/standard_form.pdf 8.05
Jun-00membership/forms/2000licapp.pdf 19.21 membership/forms/Ins_2000_23.pdf 6.7
Jul-00membership/forms/2000licapp.pdf 17.74 membership/forms/Ins_2000_23.pdf 15.42
Aug-00membership/forms/2000licapp.pdf 20.03 membership/forms/Ins_2000_23.pdf 7.6
Sep-00membership/forms/2000licapp.pdf 21.21 upload/olynom.pdf 5.24
Oct-00membership/forms/2001_lic_app.pdf 17.41 membership/rules/2000genrules.pdf 4.94
Nov-00membership/forms/2001_lic_app.pdf 18.16 ncca2/upload/NCCA_scholarship.pdf 7.53
Dec-00membership/forms/2001_lic_app.pdf 17.75 membership/forms/2001_lic_app.pdf 5.22
Jan-01membership/forms/2001_member_app.pdf 30.81 membership/forms/2001_intl_app.pdf 4.57
Feb-01membership/forms/2001_member_app.pdf 30.64 membership/forms/2001_athlete_release.pdf 8.85
Mar-01membership/forms/2001_member_app.pdf 14.71 membership/forms/2001_athlete_release.pdf 11.29
Apr-01membership/forms/2001_member_app.pdf 14.76 membership/forms/2001_athlete_release.pdf 11.99
May-01membership/forms/2001_member_app.pdf 17.07 membership/forms/2001_athlete_release.pdf 14.14
Jun-01membership/forms/2001_member_app.pdf 15.27 2001_uscf_champ/masters_road.pdf 12.51
Jul-01membership/forms/2001_membership_app.pdf 15.53 2001_uscf_champ/jr_esp_road.pdf 9.54
Aug-01membership/forms/2001_membership_app.pdf 18.46 membership/forms/2001_athlete_release.pdf 12.8
Sep-01membership/forms/2001_membership_app.pdf 17.02 membership/forms/2001_athlete_release.pdf 8.62
Oct-01membership/forms/2001_membership_app.pdf 16.57 membership/forms/2001_athlete_release.pdf 9.58
Nov-01membership/forms/2002_membership_app.pdf 27.06 membership/forms/2002_international_app.pdf 7.87
Dec-01membership/forms/2002_membership_app.pdf 30.34 membership/forms/2002_international_app.pdf 8.1
Jan-02membership/forms/2002_membership_app.pdf 32.54 membership/forms/2002_international_app.pdf 8.32
Feb-02membership/forms/2002_membership_app.pdf 19.59 rulebooks/uscf_rulebook_section1.pdf 13.47
Mar-02membership/forms/2002_membership_app.pdf 16.92 rulebooks/uscf_rulebook_section1.pdf 14.27
Apr-02membership/forms/2002_membership_app.pdf 17.47 rulebooks/uscf_rulebook_section3-4.pdf 9.81
Between September 1999 and December 1999,
www.usacycling.org/upload/olynom.pdf was the most popular downloaded file. This file is the policy and procedure for determining US cyclist to participate in the 2000
the web site for viewing. The cyclic nature of USA Cycling comes through again. The timing with a particular file or web page depends on the season or the time of the year.
Most racers apply for a yearly license because it is cheaper than buying a one-day license for every event. Yearly licenses can be applied for at races using the same
triplicate form or the PDF form can be downloaded from USA Cycling’s website and mailed in. The form has check boxes on it that allow the racer to indicate what type of license they are applying for. A license can be applied for at any time of the year. The cost is $40 for each discipline.
The “membership application” is the 2002 version of the 2001 “license
application.” The “athlete release” PDF is a form that has to be filled out by each rider before a USA Cycling permitted event. It is a liability form that releases USA Cycling and the promoters for any injuries incurred by racers. Typically, race participants will fill out the form and mail it in to the race promoter to be pre-registered. Pre-registering alleviates waiting in line and late-fees.
Average Number of User Sessions per Hour