pages. Advisor: Deborah Barreau
This study describes a survey of undergraduate students at the University of North Carolina Chapel Hill. The survey was conducted to determine the frequency of library use and source selection of undergraduate students. Demographics had little effect on library use and source selection. Two variables explain a student’s library use, the student’s parents’ education and the level of promotion the library receives from the faculty. A student’s choice of sources was independent of any variable in the study.
Headings:
College and university libraries – Undergraduate usage Source selection -- Statistics
Surveys – Undergraduate students
LIBRARY USE AND SOURCE SELECTION OF UNDERGRADUATE STUDENTS AT THE UNIVERSITY OF NORTH CAROLINA AT CHAPEL HILL
by Robert D. Wolf
A Master's paper submitted to the faculty of the School of Information and Library Science of the University of North Carolina at Chapel Hill
in partial fulfillment of the requirements for the degree of Master of Science in
Library Science.
TABLE OF CONTENTS
Introduction ……….. 3
Literature Review...……… 4
Early Studies on Undergraduate Library Use……… 4
Characteristics of Non-Users………. 5
Characteristics of Undergraduates………. 7
Background and Setting………. 8
Description of UNC Undergraduate Student Body……… 8
Academic Resources Available to Students………... 9
Methodology………... 10
Findings and Analysis……… 11
Conclusion………. 38
Bibliography……….. 43
LIST OF TABLES
TABLE 1: Characteristics of Sample Population……… 13
TABLE 2: Family Education………... 14
TABLE 3: High School and Public Library Use ……… 15
TABLE 4: Description of Activities Performed During Library Visits……….. 17
TABLE 5: Other Uses for Campus Libraries……….. 18
TABLE 6: Satisfaction with 1st Source………19
TABLE 7: Satisfaction with 2nd Source………... 20
TABLE 8: Satisfaction with 3rd Source………... 21
TABLE 9: Primary Source by Discipline……… 23
TABLE 10: Second Source by Discipline………. 24
TABLE 11: Third Source by Discipline……… 24
TABLE 12: Library Visits by Discipline……….. 25
TABLE 13: Science Majors, GPA versus Library Visits……….. 26
TABLE 14: GPA and Library Use……… 27
GPA and Source TABLE 15: Academic Year and Source Choice………... 28
TABLE 16: Sources Chosen Based On Proximity……… 29
TABLE 17: Source Chosen by Work Status………. 30
TABLE 18: Race and Campus Library Visits………... 31
Race and Choice of Source TABLE 19: Sex and Library Use……….. 32
Sex and Choice of Source TABLE 20: Age and Library Use………. 33
Age and Source TABLE 21: Parent Education and Library Visits……….. 34
Parent’s Education and Source Chosen TABLE 22: Public Library Use and Academic Library Visits………. 35
TABLE 23: Public Library Use and Choice of Source………. 36
TABLE 24: High School Library Use and Academic Library Visits…………... 37
TABLE 25: Faculty Library Promotion and Library Visits……….. 37
I. INTRODUCTION
With the rise of the internet and remotely accessible electronic resources, many academic libraries have seen a drop in patron usage and book circulation causing them to re-evaluate their mission and giving researchers much to ponder. While much research has been done to determine needs of the library patron once they are in the library, there is little information known about those who choose not to use the library, or at what point in their search students are most likely to seek information from the library. Researchers have looked at the information seeking behaviors of patrons, but have not examined the information seeking behaviors of non-library users, or the behavior of patrons prior to using the library. However, it is a difficult task to find the non-users, since by definition they do not use the library, however we can attempt to understand the source selection of “pre-patrons”.
We need to ask ourselves if students do not use the library resources available to them, why not? Is it because they are unaware of the resources offered by the library or not sure how to use them, or is it because they prefer to use other sources for their
academic information needs? In an academic setting, it would be useful to understand the research needs of “pre-patrons” or non-users since they should have very similar
It is the purpose of this study to try and determine the needs of an entire population, users and non-users alike. The survey in this study attempts to reach all parties to determine what they deem to be the most useful sources for their information needs, and to
determine their opinion of these sources. The goal is to determine if there is a particular attribute or attributes that define non-users, casual users and those who are more frequent patrons of the library and its resources.
II. LITERATURE REVIEW
There is a dearth of literature examining the information use behavior of students outside of the library. Most studies are concerned with the needs and searching behaviors of the student who has already set foot in the library, or is using the library’s online resources. It is somewhat disconcerting that so little emphasis is put on determining who the non-users are, and why they do not use a resource that is freely available to them, or why students will look towards the web or their textbooks, for example, rather than their library’s resources. Unfortunately it is not an easy task to locate these non-users since they are obviously not using the services offered to them, and may not be interested in participating in a study for a service they do not use.
replied they did not need these resources to do acceptable work, and this was long before the ease of access to information afforded to us by the Internet (Barkley).Students also saw use of the library as beyond the academic requirements of their courses for which they had little time (Lubans, 1971). Thus, in the 1960’s and 1970’s students do not seem much different from how many would characterize today’s students. It seems despite the ease of use technology has offered, students’ attitudes have not changed much.
A study four years later at the California State Polytechnic College, examining library circulation records and student records, found that students who did not use the library where more likely to drop out of college (Kramer, 1968). Kramer found students who did not use the library’s resources where nearly twice as likely to drop out between semesters as students who used the library at least infrequently (Kramer). A study at the Rensselar Polytechnic Institute Library in New York also found a strong relationship between library use and continuance of education (Lubans, 1971). It would be interesting to see if the same results would be found today.
there was no evidence that bibliographic instruction predisposed students to advanced planning (Hinchliffe, 2000).
More current research focuses on the characteristics of the non-user or infrequent user as the predictor for non-library use, not the consequence. Recent research has shown that library use may be indicative of the level of one’s education, age, race, and
background, with African American students engaging in more frequent library use. (Whitmire, 2003). The study also found a significant relationship between a faculty member’s promotion of the library resources to their students, and their students’ actual use of the library (2003). In a study of undergraduate economics students, Grimes and Charters examined five aspects, including demographics, standardized testing scores, prior library skills, living situation (full time work, on campus, family, etc.) and library activities, to determine traits of non-users or infrequent users (Grimes & Charters, 2001). They determined race, gender, ACT scores, and job status, full-time versus part-time, to be the strongest predictors of library use. They found students working full-time or with lower ACT scores were least likely to use the library or its resources. Other research also found a student’s academic program to be a significant predictor of library usage.
A student’s perception of the library is also influential in their likelihood of library patronage. In a study of students at a public state university it was found students who believed the library was essential to a strong academic community where also more likely to use library resources for their course work (Watson, 2001). They also believed use of the library’s resources contributed to their educational gains and they had more confidence in their library skills (Watson). Once again, freshman where the least likely to use library resources, and felt the library was less important to their educational
development than juniors or seniors (Watson).
In a 2003 study of Danish libraries, user perceptions and satisfaction with their libraries were found to be strongly influenced by the number of print titles available and the atmosphere of the particular library, where the availability of electronic resources only played a marginal role (Martensen and Gronholdt, 2003).
At the University of Maryland, College Park, a study was conducted by the Robert H. Smith School of Business to determine the needs of its business library patrons. In this study it was found that 69% of those participating in the study used a search engine to begin their searches, while only 17% used the library’s resources (Abels et al, 2004). The study also found that 34% of patrons would be unwilling to contact a librarian for help but would seek other sources (2004).
The base for an area of study in the library community has slowly begun to emerge as researchers realize the importance of the lost or non-user, in an ever-changing environment. Unfortunately there has been little research to build off these studies. It is important to understand the needs of all potential users in the academic community if the library is to remain relevant to academic growth and enhancement. It is also important to understand why students may consult other sources prior to or in lieu of using the library’s resources.
III. BACKGROUND AND SETTING
The University of North Carolina at Chapel Hill (UNC) currently enrolls 16,144 undergraduate students. The ethnicity of students is broken down as follows:
11.3 percent African American/Black 7.6 percent Asian American/Asian 3.6 percent Hispanic/Latino/Latina
0.9 percent Native American/Alaskan Native 73.1 percent White/Caucasian
0.2 percent Pacific Islander 3.3 percent Other/Not reported
were also very active in extracurricular activities with 93% performing community service and 64% involved in after school clubs or sports activities. The school is primarily devoted to the arts and sciences, with its three largest programs in business, biology, and journalism and mass communication.
In order to gain a complete understanding of the choices available to
inter-library loans online, only visiting the inter-library to pick up the materials when they are available. The University also offers a variety of online courses through Blackboard Learning System. Undergraduates are exposed to research through a required bibliographic instruction session in their English Composition classes.
IV. METHODOLOGY
The data for this analysis were gathered March 2005, from an online survey sent to a random selection of 1,313 undergraduate students over the age of 18 currently attending the University of North Carolina at Chapel Hill. A copy of the survey is found in Appendix A. Since non-users by definition do not use the library it would be hard to find them without contacting a large number of students. A survey was chosen in order to reach the most students possible and increasing the chance of finding those students who
were non-library users.
An email was sent to these students requesting their participation in the study. Of these 1,313, only four addresses where returned as incorrect by the mail server, the rest presumably reached their destination. A total of 167 surveys were returned over a one week period. Forty-five of these initial 167 were dropped from the sample pool since they were incomplete. This left one hundred twenty two useable responses for analysis. A number of variables were recoded in order to analyze plausible explanations for library use or non-use. Majors declared by respondents were broken down into four basic categories, including liberal arts, hard sciences, business, and undecided.
This includes but is not limited to Google, Yahoo, AskJeeves, etc. Library sources were also broken down into two categories, sources accessed from the library’s online
resources, and sources accessed in the physical library itself. Examples of library online resources include individual database names, the library webpage, and e-journals. Examples of physical library sources include individual library names, the reference desk, paper journals, and library books.
Student GPA’s were recoded to ranges from 1 to 4 at .5 intervals, to create
categories and increase ease of analysis. All variables except age are coded to categorical level variables to make cross tabulation possible with the dependent variables.
Due to the small number of responses for races other than Caucasian, race has been recoded as Caucasian and Non-Caucasian, for purpose of analysis, but has remained intact for the description of characteristics for the sample population.
There are two dependent variables in this study, the first is the frequency of library visits made by students to any of the campus libraries, and the second is the student’s choice of sources when doing research. This study examines the relationship between the student’s background, both demographic and academic, and his or her library use or non-use.
V. FINDINGS AND ANALYSIS
Table 1, describes the demographic break down of respondents. Respondents are spread rather evenly across class rank; they are for the most part full time students, about half are liberal arts majors, which is not surprising given the nature of the campus
TABLE 1: Characteristics of Sample Population (N=122)
Class Standing Frequency Percent Cumulative
Freshman 26 21.31% 21.31%
Sophomore 33 27.05% 48.36%
Junior 33 27.05% 75.41%
Senior 30 24.59% 100.00%
Academic Status
Full Time 119 97.54% 97.54%
Part Time 3 2.46% 100.00%
Major
Liberal Arts 60 49.18% 49.18%
Business 19 15.57% 64.75% Science 35 28.69% 93.44%
Undecided 8 6.56% 100.00%
Race
Caucasian 104 85.25% 85.25%
African American 3 2.46% 87.71%
Hispanic 3 2.46% 90.17%
Asian 8 6.56% 96.73% Other 4 3.28% 100.01% Sex
Male 39 31.97% 31.97%
Female 83 68.03% 100.00% Employment
Non-Working 58 47.54% 47.54%
Part Time Work 60 49.18% 96.72%
Full Time Work 4 3.28% 100.00%
Age
18 13 10.66% 10.66%
19 35 28.69% 39.35%
20 36 29.50% 68.85%
21 22 18.03% 86.88%
22 6 4.92% 91.80%
Most students come from families where at least one parent has completed a college degree (85.24%), see Table 2. None of the students surveyed reported having parents with less than a high school degree, while only 9% reported the highest level of parental education at the high school level. These students all come from relatively well educated backgrounds, with almost half coming from families with at least one parent earning a graduate or post-graduate degree. Overall, 90% have at least some college.
TABLE 2
Family Education (N=122)
Parent’s Education Frequency Percent Cumulative High School or GED 11 9.02 9.02
Some College 7 5.74 14.75
Associates or Bachelors Degree 51 41.80 56.56
Masters or Doctorate Degree 53 43.44 100.00
TABLE 3
High School and Public Library Use (N=122)
High School Library
(Public Library) Frequency Percent Cumulative Never 12 (8) 10.17 (6.56) 10.17 (6.56)
Rarely 42 (50) 35.59 (40.98) 45.76 (47.54)
Sometimes 40 (38) 33.90 (31.15) 79.66 (78.69)
Often 24 (26) 20.34 (21.31) 100.00 (100.00)
The students in this survey were also asked a number of questions concerning their campus library use, including how often they use the library, if ever, and for what purpose or task they were using the library. They were asked to estimate the number of times they visited any of the campus libraries in the past month. Only one student responded he never used the library, while over one third used one or more campus libraries, with the rest visiting the library from one to ten times. Students were also asked how often they borrow materials from the library, check their email, use reserve
materials, use the library to study by themselves or in groups, and to state any other activities they may engage in during their visit.
When asked how often students borrow books or other materials from the library, nearly 20% indicated that they never did, and another 36% rarely checked out materials (see Table 4). Only about 15% replied they checked out materials on a regular basis. This may reflect the drop in circulation reported by many libraries even when there is an increase in the number of patron visits.
Students were asked how often they use the library to conduct research. Ninety-three percent of all respondents conducted research in the library at least rarely, showing that the vast majority see the library as a place for research.
When asked how often they use the library to study on their own 42% of students replied they study often, while 30% replied they study some of the times. Overall, 92% of students said they studied in the library in some capacity. With 92% of students studying in the library at least once, it seems clear that the library is still seen as a place of study.
TABLE 4 Description of Activities Performed During Library Visits (N=122)
Checkout Materials
Use Frequency Percent Cumulative
Never 22 18.03% 18.03%
Rarely 44 36.07% 54.10%
Sometimes 37 30.33% 84.43%
Often 19 15.57% 100.00%
Use Email
Use Frequency Percent Cumulative
Never 8 6.56% 6.56%
Rarely 23 18.85% 25.41%
Sometimes 41 33.61% 59.02%
Often 50 40.98% 100.00%
Use Reserve Materials
Use Frequency Percent Cumulative
Never 8 6.56% 6.56%
Rarely 28 22.95% 29.51%
Sometimes 65 53.28% 82.79%
Often 21 17.21% 100.00%
Study Alone
Use Frequency Percent Cumulative
Never 10 8.20% 8.20%
Rarely 24 19.67% 27.87%
Sometimes 36 29.51% 57.38%
Often 52 42.62% 100.00%
Study in a Group
Use Frequency Percent Cumulative
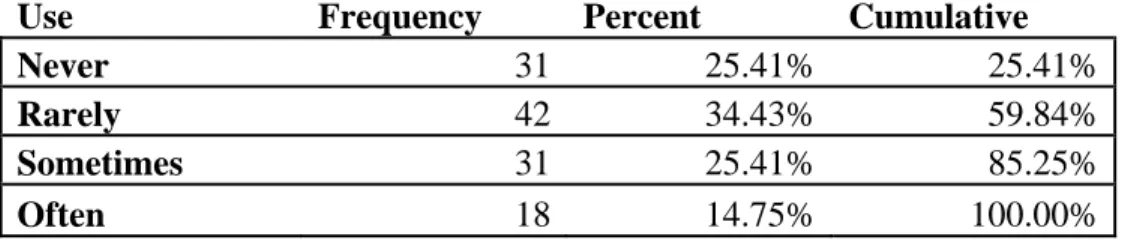
Never 31 25.41% 25.41%
Rarely 42 34.43% 59.84%
Sometimes 31 25.41% 85.25%
When asked about other activities students participate in while visiting the library, 12% replied they used the computer lab (see Table 5). Another 12% replied they use the library to sleep. Printing and photocopying were the most frequently sited activity, making up 42% of all responses. Other popular responses where, to use the bathroom, waste time, or read the newspaper.
TABLE 5 Other Uses for Campus Libraries (N=26)
Use Frequency Percent Cumulative
Bathroom 2 7.69% 7.69%
Computer Lab 3 11.54% 19.23%
Language
Study 1 3.85% 23.08%
Printing or
Photocopying 11 42.28% 65.36%
Reading 1 3.85% 69.21%
Movies 1 3.85% 73.06%
Newspapers 1 3.85% 76.91%
Sleeping 3 11.54% 88.45%
Wasting Time 1 3.85% 92.30%
Downloading 1 3.85% 96.15%
Using
Reserves 1 3.85% 100.00%
library, there is a definite feeling of importance attached to the library and the function is serves.
In order to gain insight to the research processes of the students, they where asked to list what sources they used most often when conducting research. They were asked to list the top three resources they would use in order of importance, and to rank how effective they thought these sources were for finding the information they were seeking. It is hoped that by knowing where students turn to first for their information needs, it might become clear why. All students listed at least one source, 92% listed two sources, and 66% listed three sources.
Not surprisingly 65% turned to the Internet as their first source of information. The Internet in this case includes any online resources that are not provided by UNC libraries or their database providers. Of those who chose the internet as their source 87% were very satisfied with the results they find on the Internet, only 13% found it only somewhat helpful (see Table 6). About 21% searched the online catalog or databases for information with an 85% satisfaction rate, while another 12% stated they would actually visit the physical library and reported a 93% satisfaction level, the highest for all sources, though it is not clear if they used the library’s online resources once at the library.
TABLE 6 Satisfaction with 1st Source (N=122)
Rate Internet Online Library
Resources Library Textbook Total
Somewhat 10 4 1 2 17
Percentage 12.66% 15.38% 7.14% 66.67% 13.93%
Very 69 22 13 1 105
Percentage 87.34% 84.62% 92.86% 33.33% 86.07%
As the most popular second source for information, students stated they were most likely to visit one of the campus libraries (39%) with only a 55% very satisfied rating and a 43% somewhat satisfied rating (see Table 7). This is logical since we would expect the person’s first choice of sources to be the most satisfying. However, as in the primary source it is unclear if library uses include using the library’s online resources. Thirty-four percent stated they used the library’s online resources with a 55% very satisfied rating and a 42% somewhat satisfied rating. The Internet still attracted 11% of responses with a 33% very satisfied rating and a 66% somewhat satisfied rating. Results are summarized in Table 6.
TABLE 7 Satisfaction with 2nd Source (N=112)
Rate Internet Online Library
Resources Library Other Total
Not Very 0 1 1 0 2
% 0 2.63 2.27 0 1.79
Somewhat 8 16 19 11 54
% 66.67 42.11 43.18 61.11 48.21
Very 4 21 24 7 56
% 33.33 55.26 54.55 38.89 50.00
Total 12 38 44 36 112
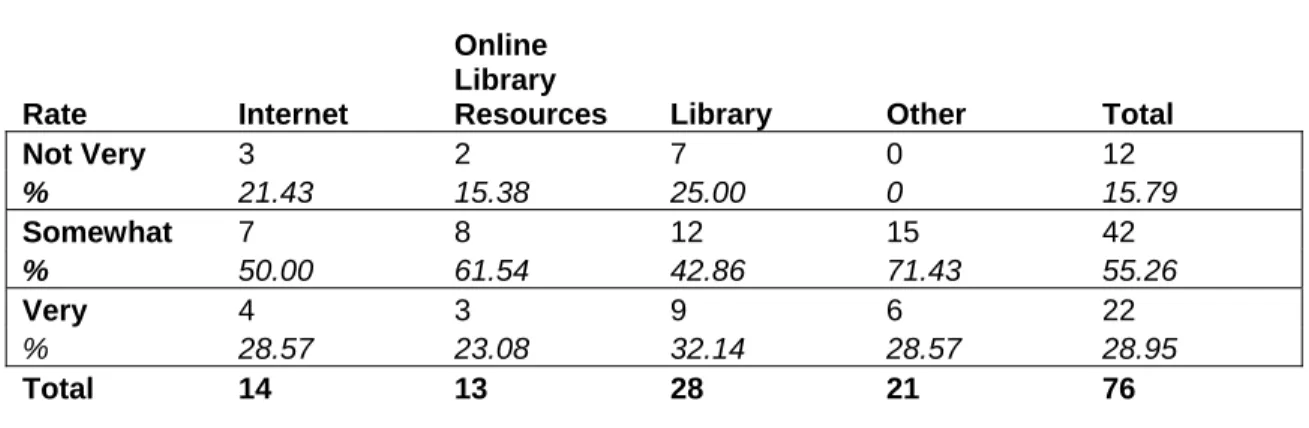
TABLE 8 Satisfaction with 3rd Source (N=76)
Rate Internet Online Library
Resources Library Other Total
Not Very 3 2 7 0 12
% 21.43 15.38 25.00 0 15.79
Somewhat 7 8 12 15 42
% 50.00 61.54 42.86 71.43 55.26
Very 4 3 9 6 22
% 28.57 23.08 32.14 28.57 28.95
Total 14 13 28 21 76
In a separate question students were asked how often they use the libraries’ online resources. This question was asked in addition to the three source questions to gain a better understanding of the student’s use of library resources when excluding other outside sources, and as a check on the accuracy of the student’s answers. Forty percent answered they use the library’s online resources often, while 45% said they only used them sometimes. Only 15% said they rarely or never used the available online resources.
Students were also asked if they use materials put on reserve by their professors. This question once again is closely related to library use since most reserve materials are either housed in the library or reached online through the library’s webpages. Students may not consider accessing their reserve materials as using the library, so this is another measure of use. A majority of students (61%) stated they only access those reserves that are required by the course. Twenty-five percent stated they only use reserve materials if they have time, where those who never look at reserves and those who look at all reserves make up the extremes with 1% and 13% respectively.
information while 66% stated it was not. If we look at the sources cited as the student’s first choice of information, this confirms their initial responses.
Overall, students seem happy with the level of information they receive or are capable of finding through the library’s resources. When asked if they would be willing to attend a brief workshop to improve their library skills, 88% replied either no or probably not, while 2% answered they would definitely be interested in a skills workshop. The other 10% stated they would probably attend, but were not certain.
According to Whitmire, two sources that can have a great influence in the resources consulted by students are the faculty and library staff (2003). When students were asked if their professors promoted library use for research assignments, 57% replied that their professors normally instruct them to use library sources, where only 13% replied their professors never mention using library resources for assignments. Students were also asked if they ever received a library instruction session in their academic careers here at UNC. Although bibliographic instruction is a requirement for many English composition classes, only 52% of responses report to have received bibliographic instruction. This may be due to a number of factors, students may have tested out of the English composition classes, bypassing the instruction sessions, they may not remember their session since it may have been one class period a number of years ago, or they could be transfer students who were not required to take the English composition classes.
only work part-time, they are just as likely to live on campus as off, and they come from well educated backgrounds.
The relationships between choice of source or library use and the independent variables were tested for significance; only those relationships that were significant with an 85% confidence interval are analyzed here.
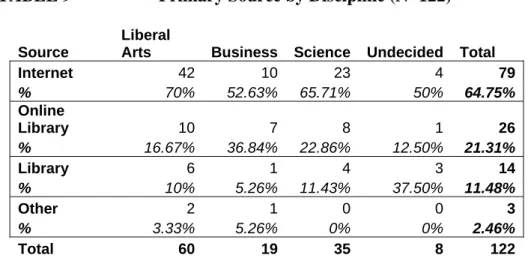
According to previous research, students in less writing-intensive studies, such as engineering or sciences, use the library less frequently than students in a liberal arts field. Liberal arts students used an Internet source more often than their Business or Science counterparts were, (see Table 9). In fact, business students reported the most library use, with 42% or eight responses, though of these eight, 88% said they would use the online library resources over the physical library. Students in the Liberal Arts used the Internet 1.28 times more often than students in Business, while students in the Sciences used the Internet 1.18 times more often than Business students.
TABLE 9 Primary Source by Discipline (N=122)
Source
Liberal
Arts Business Science Undecided Total
Internet 42 10 23 4 79
% 70% 52.63% 65.71% 50% 64.75%
Online
Library 10 7 8 1 26
% 16.67% 36.84% 22.86% 12.50% 21.31%
Library 6 1 4 3 14
% 10% 5.26% 11.43% 37.50% 11.48%
Other 2 1 0 0 3
% 3.33% 5.26% 0% 0% 2.46%
Total 60 19 35 8 122
third choice of sources, liberal arts students use library resources more often. Unfortunately, by this time their satisfaction with the source is waning.
TABLE 10 Second Source by Discipline (N=112)
Source
Liberal
Arts Business Science Undecided Total
Internet 7 1 3 1 12
% 12.50% 5.56% 9.68% 14.29% 10.71%
Online
Library 17 8 12 1 38
% 30.36% 44.44% 38.71% 14.29% 33.93%
Library 23 6 11 4 44
% 41.07% 33.33% 35.48% 57.14% 39.29%
Other 9 3 5 1 18
% 16.07% 16.67% 16.13% 14.28% 16.07%
Total 56 18 31 7 112
TABLE 11 Third Source by Discipline (N=80)
Source
Liberal
Arts Business Science Undecided Total
Internet 6 4 4 0 14
% 14.63% 33.33% 19.05% 0.00% 17.50%
Online
Library 8 1 4 1 14
% 19.51% 8.33% 19.05% 16.67% 17.50%
Library 18 4 5 3 30
% 43.90% 33.33% 23.81% 50.00% 37.50%
Other 9 3 8 2 22
% 22.96% 25.01% 38.09% 33.33% 22.50%
Total 41 12 21 6 80
may be somewhat skewed. The only person to reply that he did not use the library was a liberal arts history major.
TABLE 12 Library Visits by Discipline (N=122)
No. Visits
Liberal
Arts Business Science Undecided Total
Never 1 0 0 0 1
% 1.67% 0.00% 0.00% 0.00% 0.82%
1-5 26 10 13 3 52
% 43.33% 52.36% 37.14% 37.50% 42.62%
6-10 17 2 5 4 28
% 28.33% 10.53% 14.29% 50.00% 22.95%
11+ 16 7 17 1 41
% 26.67% 36.84% 48.75% 12.50% 33.61%
Total 60 19 35 8 122
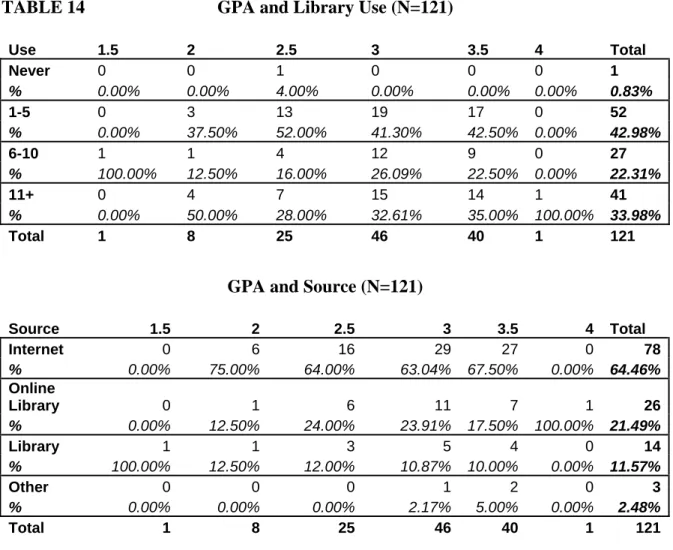
According to Kramer, library use in the Sciences is not a predictor of grade point average (1968). Students who visit the library five or more times a semester have higher GPA’s than those who visit five times or fewer, (see Table 13). Choosing a 3.0 GPA or above as a measure, students with a GPA of 3.0 or higher reported visiting the library six or more times, 1.33 times more often than those with lower GPAs. In this sample,
TABLE 13 Science Majors, GPA versus Library Visits (N=34)
Library Visits
< 3.0 GPA
>3.0 GPA
TOTAL
1-5 visits 7 6 13
6 or more visits
6 15 21
Total 13 21 34
TABLE 14 GPA and Library Use (N=121)
Use 1.5 2 2.5 3 3.5 4 Total
Never 0 0 1 0 0 0 1
% 0.00% 0.00% 4.00% 0.00% 0.00% 0.00% 0.83%
1-5 0 3 13 19 17 0 52
% 0.00% 37.50% 52.00% 41.30% 42.50% 0.00% 42.98%
6-10 1 1 4 12 9 0 27
% 100.00% 12.50% 16.00% 26.09% 22.50% 0.00% 22.31%
11+ 0 4 7 15 14 1 41
% 0.00% 50.00% 28.00% 32.61% 35.00% 100.00% 33.98%
Total 1 8 25 46 40 1 121
GPA and Source (N=121)
Source 1.5 2 2.5 3 3.5 4 Total
Internet 0 6 16 29 27 0 78
% 0.00% 75.00% 64.00% 63.04% 67.50% 0.00% 64.46%
Online
Library 0 1 6 11 7 1 26
% 0.00% 12.50% 24.00% 23.91% 17.50% 100.00% 21.49%
Library 1 1 3 5 4 0 14
% 100.00% 12.50% 12.00% 10.87% 10.00% 0.00% 11.57%
Other 0 0 0 1 2 0 3
% 0.00% 0.00% 0.00% 2.17% 5.00% 0.00% 2.48%
Total 1 8 25 46 40 1 121
TABLE 15 Academic Year and Source Choice (N=122)
Source Freshman Sophomore Junior Senior Total
Internet 15 23 20 21 79
% 57.69% 69.70% 60.61% 70.00% 64.75%
Online
Library 6 6 7 7 26
% 23.08% 18.18% 21.21% 23.33% 21.31%
Library 3 4 5 2 14
% 11.54% 12.12% 15.15% 6.67% 11.48%
Other 2 0 1 0 3
% 7.69% 0.00% 3.03% 0.00% 2.46%
Total 26 33 33 30 122
TABLE 16 Sources Chosen Based On Proximity (N=122)
Source
On Campus
Off
Campus Total
Internet 36 43 79
% 57.14% 72.88% 64.75%
Online
Library 17 9 26
% 26.98% 15.25% 21.31%
Library 7 7 14
% 11.11% 11.86% 11.48%
Other 3 0 2
% 4.76% 0.00% 2.46%
Total 63 59 122
TABLE 17 Source Chosen by Work Status (N=118)
Source
Non Working
Part Time
Work Total
Internet 34 54 76
% 58.62% 70.00% 64.41%
Online Library 11 15 26
% 18.97% 25.00% 22.03%
Library 10 3 13
% 17.24% 5.00% 11.02%
Other 3 0 3
% 5.17% 0.00% 2.54%
Total 58 60 118
According to most of the available literature, a person’s demographics are a strong predictor of library use. It is believed older minority females with higher grade point averages will be the most frequent library users (Whitmire, 2003). Unfortunately, the results from the survey were not well represented by non-Caucasians.
TABLE 18 Race and Campus Library Visits (N=122)
Use Caucasian Other Total
Never 1 0 1
% 0.96% 0.00% 0.82%
1-5 47 5 52
% 45.16% 27.78% 42.62%
6-10 25 3 28
% 24.04% 16.67% 22.95%
11+ 31 10 41
% 29.81% 55.56% 33.61%
Total 104 18 122
Race and Choice of Source (N=122)
Internet 68 11 79
% 65.38% 61.11% 64.75%
Online
Library 20 6 26
% 19.23% 33.33% 21.31%
Library 14 0 14
% 13.46% 0.00% 11.48%
Other 2 1 3
% 1.92% 5.56% 2.46%
Total 104 18 122
Since the race and sex of the students in the survey can not be compared they must be examined separately. There is little difference between male and female students and their frequency of library use. It is interesting to note the only respondent to reply that he or she has not used the library in the past month was male. It would be helpful for the purposes of this study to interview this individual and determine why he does not use the library, and what sources he uses to find information for academic research.
TABLE 19 Sex and Library Use (N=122)
Use Male Female Total
Never 1 0 1
% 2.56% 0.00% 0.82%
1-5 15 37 52
% 38.46% 44.58% 42.62%
6-10 9 19 28
% 23.08% 22.89% 22.95%
11+ 14 27 41
% 35.90% 32.53% 33.61%
Total 39 83 122
Sex and Choice of Source (N=122)
Source Male Female Total
Internet 22 57 79
% 56.41% 68.67% 64.75%
Online Library 10 16 26
% 25.64% 19.28% 21.31%
Library 6 8 14
% 15.38% 9.64% 11.48%
Other 1 2 3
% 2.56% 2.41% 2.46%
Total 39 83 122
TABLE 20 Age and Library Use (N=122)
Use 18 19 20 21 22 23+ Total
Never 0 0 0 0 1 0 1
% 0.00% 0.00% 0.00% 0.00% 16.67% 0.00% 0.82%
1-5 5 16 17 5 4 5 52
% 38.46% 45.71% 47.22% 22.73% 66.67% 50.00% 42.62%
6-10 4 7 5 8 0 4 28
% 30.77% 20.00% 13.89% 36.36% 0.00% 40.00% 22.95%
11+ 4 12 14 9 1 10 41
% 30.77% 34.29% 38.89% 40.91% 16.67% 10.00% 33.61%
Total 13 35 36 22 6 10 122
Age and Source (N=122)
Source 18 19 20 21 22 23+ Total
Internet 9 21 23 13 6 7 79
% 69.23% 60.00% 63.89% 59.09% 100.00% 70.00% 64.75%
Online
Library 3 6 8 7 0 2 26
% 23.08% 17.14% 22.22% 31.82% 0.00% 20.00% 21.31%
Library 0 7 4 2 0 1 14
% 0.00% 20.00% 11.11% 9.09% 0.00% 10.00% 11.48%
Other 1 1 1 0 0 0 3
% 7.69% 2.86% 2.78% 0.00% 0.00% 0.00% 2.46%
Total 13 35 36 22 6 10 122
Students with parents who have high school educations tended to use the physical library more often, where students with parents with a graduate or post-graduate degree tended to use the library’s online resources (see Table 21). One might theorize this is due do to the probable incomes of families with lower education levels and their lack of access to computers, but that should also mean that they would not choose the Internet at the same rate as their more educated counter parts.
TABLE 21 Parent Education and Library Visits (N=122)
Use High School
Some College
Assoc. or Bach.
Masters or
PhD. Total
Never 0 1 0 0 1
% 0.00% 14.29% 0.00% 0.00% 0.82%
1-5 6 1 23 22 52
% 54.55% 14.29% 45.10% 41.51% 42.62%
6-10 2 2 14 10 28
% 18.18% 28.57% 27.45% 18.87% 22.95%
11+ 3 3 14 21 41
% 27.27% 42.86% 27.45% 39.62% 33.61%
Total 11 7 51 53 122
Parent’s Education and Source Chosen (N=122)
Source High School
Some College Assoc. or Bach. Masters or PhD. Total
Internet 8 4 29 38 79
% 72.73% 57.14% 56.86% 71.70% 64.75%
Online
Library 1 3 12 10 26
% 9.09% 42.86% 23.53% 18.87% 21.31%
Library 2 0 8 4 14
% 18.18% 0.00% 15.69% 7.55% 11.48%
Other 0 0 2 1 3
% 0.00% 0.00% 3.92% 1.89% 2.46%
It is a reasonable hypothesis to believe a student’s public library use prior to his or her college career would be an indicator of their use of the campus library system. The reasoning behind this hypothesis is that a frequent public library user would be
comfortable with a library atmosphere, and would be more willing to visit the library. Fifty-four percent of those who used their public library often are also frequent campus library visitors (see Table 22). Comparing those who used their public library often with those who used it never to sometimes, the data suggests that those who visited their library often visited their campus library eleven or more times a month, 1.43 times more often than those who never used their public library, 2.45 times more often than rare users, and 1.57 times more often than those using public libraries sometimes. Conversely, those who rarely used their public library were also infrequent users of the campus library. There is a slight positive relationship between the frequency of public library visits prior to college, and the frequency of campus library visits (gamma = 0.211).
TABLE 22 Public Library Use and Academic Library Visits (N=122)
Use Never Rarely Sometimes Often Total
Never 0 1 0 0 1
% 0.00% 2.00% 0.00% 0.00% 0.82%
1-5 2 25 17 8 52
% 25.00% 50.00% 44.74% 30.77% 42.62%
6-10 3 13 8 4 28
% 37.50% 26.00% 21.05% 15.38% 22.95%
11+ 3 11 13 14 41
% 37.50% 22.00% 34.21% 53.85% 33.61%
Total 8 50 38 26 122
source. The only noticeable difference is frequent public library users used the physical library more often than the online resources, when compared to those who never, rarely, or sometimes used their public library (see Table 23).
TABLE 23 Public Library Use and Choice of Source (N=122)
Source Never Rarely Sometimes Often Total
Internet 5 35 23 16 79
% 62.50% 70.00% 60.53% 61.54% 64.75%
Online
Library 1 10 12 3 26
% 12.50% 20.00% 31.58% 11.54% 21.31%
Library 2 4 2 6 14
% 25.00% 8.00% 5.26% 23.08% 11.48%
Other 0 1 1 1 3
% 0.00% 2.00% 2.63% 3.85% 2.46%
Total 8 50 38 26 122
Considering the influence public library use seems to have on a student’s use of the academic library, it would seem reasonable to believe use of their high school libraries would have a similar effect. However, there is little significant difference in the frequency of academic library visits and the frequency of high school library visits, as seen in Table 24. A gamma of -0.01, for this relationship, only strengthens this
TABLE 24 High School Library Use and Academic Library Visits (N=118)
Use Never Rarely Sometimes Often Total
Never 1 0 0 0 1
% 8.33% 0.00% 0.00% 0.00% 0.85%
1-5 3 20 17 10 50
% 25.00% 47.62% 42.50% 41.67% 42.37%
6-10 2 9 10 6 27
% 16.67% 21.43% 25.00% 25.00% 22.88%
11+ 6 13 13 8 40
% 50.00% 30.95% 32.50% 33.33% 33.90%
Total 12 42 40 24 118
There is only a slight difference between students who reported faculty support of the library and those who reported infrequent or no support for frequent library visitors. Students whose faculty members promoted the use of the library used the library 1.5 times more often than students whose faculty did not promote the library and 1.3 times more often than those students whose professors only promoted the library some of the time. There was no significant difference between faculty library promotion and student selection of source, with a gamma of -0.07.
TABLE 25 Faculty Library Promotion and Library Visits (N=122)
Use Yes No Sometimes Total
Never 0 0 1 1
% 0.00% 0.00% 2.70% 0.82%
1-5 27 8 17 52
% 39.13% 50.00% 45.95% 42.62%
6-10 16 4 8 28
% 23.19% 25.00% 21.62% 22.95%
11+ 26 4 11 41
% 37.68% 25.00% 29.73% 33.61%
Total 69 16 37 122
One might also expect those students who have received some sort of
between the two groups when comparing library visits. We can also see there was little or no difference in their choice of sources.
TABLE 26 Library Instruction and Library Visits (N=122)
Use Yes No Total
Never 0 1 1
% 0.00% 1.69% 0.82%
1-5 26 26 52
% 41.27% 44.07% 42.62%
6-10 14 14 28
% 22.22% 23.73% 22.95%
11+ 23 18 41
% 36.51% 30.51% 33.61%
Total 63 59 122
Library Instruction and Source Chosen (N=122)
Source Yes No Total
Internet 40 39 79
% 63.49% 66.10% 64.75%
Online
Library 17 9 26
% 26.98% 15.25% 21.31%
Library 6 8 14
% 9.52% 13.56% 11.48%
Other 0 3 3
% 0.00% 5.08% 2.46%
Total 63 59 122
V. CONCLUSIONS
Non-Caucasians; however, the sample population may not be an accurate representation of minority groups due to the small sample size. Student living and working situations had little noticeable affect on library use and source selection. However, there were notable difference in library use based on the parents’ education and the faculties’ involvement in library use.
It was found that prior high school library use had no affect on the student’s college library use, whereas prior public library use increases the student’s academic library use. However, neither public nor high school libraries altered the student’s selection of source materials. Also, students who received bibliographic instruction showed no difference in source selection or library visits than students without an instruction session.
As seen in the Abels study at the University of Maryland, Robert H. Smith School of Business, about 70% of students chose the Internet as their first source of information. This is very similar to the results of this study, where 65% chose the Internet as their first source suggesting that even though the results from this study may be slightly skewed due to sample size, they may also relatively accurate.
The findings of this study challenge some of the findings of previous studies. For example, students in the sciences and business fields used the library more often than expected compared with liberal arts students. There are a number of reasons this may have occurred including small sample groups in business and science or faculty influence on the student’s library use. These explanations are however in no way inclusive.
GPA, age, and academic year. In fact, freshmen students were more likely to use the library than seniors. According to Geffert and Christensen, incoming students are much more likely to be open to library instruction and library propaganda, and hence more likely to use the library (1998). Age may be less influential in library use as the library offers more digital resources and tries to adapt to the needs of its users. Generational difference may be more influential than age. Typically students are of the same generation since there is only on average four years difference between freshman and seniors. It would be interesting to compare traditional students with older students to see if there is a greater variation in library use and the sources they choose.
All the participants in this study stated that they planned to finish their degrees. This contradicted both Lubans’s and Kramer’s findings, where lack of library use was attributed to higher drop out rates. However, unlike these studies, students today have access to the Internet which may be a surrogate for using the library, and may have altered the results if available to students in the Lubans and Kramer studies.
It also important for librarians who instruct students, to understand that different students will have different information needs and pre-conceived ideas about the library, which may be due to their familial educational background, and that these students may need alternative forms of bibliographic instruction for them to realize the potential of the library.
This paper is only a beginning study of non-users and pre-library use users. It is necessary for more research to be done in order to fully understand what leads students in an academic environment, where there are resources available to them, to choose the Internet as their first choice of research. Is it the ease of use or convenience of access? Are students turned away from online library resources by the multitude of interfaces and too many choices? It is understandable for students to turn toward the Internet to gain a quick background on a subject, but for serious research it can be misleading,
inappropriate or incorrect. It is important to reach students, and inform them of the information available to them, and the importance of reputable sources.
Unfortunately, this study was unable to reach a significant portion of students who would be classified as non-users, there for the results may be skewed toward the user’s perspective. It would be beneficial to target the non-user to gain an understanding of their needs and motivations. This could be done through interviews with non-users. In order to find these non-users, it would be necessary to ask students if they know or know of a fellow student who does not use the library. With this information, these non-users could be contacted for interviews.
analysis of their needs. A study focused on specific groups would be most beneficial. It would also be useful to create focus groups to provide students to interact with each other and elicit responses an interviewer may not be able to.
A study into the further opinions and attitudes of students would also be necessary to determine how they feel about a broad range of topics. It is almost necessary to take a sociological or psychological approach to any further studies, to understand what makes a student choose the library over the internet or why some students will not use the library at all. Is there something in the human condition that is unexplored by the library
sciences, that makes the library a less desirable source of information? How can
Bibliography
Abels, E., Griner, L. and Turqman, M. (2004). If You Build It Will They Come? Information Outlook, 8:10, 13-17.
Barkey, Patrick. (1964). Patterns of Student Use of a College Library. College and Research Libraries, 26:2, 115-118.
Geffert, Bryn and Christensen, Beth. (1998). Things They Carry. (College Students and Libraries). Reference & User Services Quarterly, 37:3 279-286.
Grimes, Paul W. and Charters, Marybeth R. (2000). Library Use and the Undergraduate Economics Student. College Student Journal, 34 (Dec 2000), 557-570.
Hinchliffe, Joseph. (2000), Faculty-Directed Library Use Instruction: A Single Class, Retrospective Study. Research Strategies, 17, 281-289.
Kramer, Lloyd A. and Kramer, Martha B. (1968). The College Library and the Drop-Out. College & Research Libraries, 29:4, 310-312.
Lubans, John. (1971). Nonuse of an Academic Library. College & Research Libraries,
Martensen, Anne and Grønholdt, Lars. (2003). Improving Library Users’ Perceived Quality, Satisfaction and Loyalty: An Integrated Measurement and Management System. The Journal of Academic Librarianship, 29:3, 140-147.
Massey-Burzio, Virginia. (2002). Facing the Competition: The Critical Issues of
Reference Service. College and Research Libraries News, 63:11, 774-775.
Overview of the UNC Library System 15 March 2005 < http://www.lib.unc.edu/overview.html>
Sheesley, Deborah. (2002). The ’Net Generation’: Characteristics of Traditional-Aged
College Students and Implications for Academic Information Services. College &
Undergraduate Libraries, 9:2, 25-42.
UNC: ACADEMIC: FACTS AND FIGURES 15 March 2005
<http://www.admissions.unc.edu/academics/factsandfigures.htm>.
Watson, Lemuel. (2001). How do Students’ Perceptions of Their Library Usage Influence Their Academic Educational Outcomes. College Student Journal, 35:3, 366-343.
Whitmire, Ethelene. (2003). Cultural Diversity and Undergraduates’ Academic Library Use. The Journal of Academic Librarianship, 32:3, 148-161.
APPENDIX
SURVEY
Age?
Race?
Caucasian
African American Hispanic/Latino Asian
Other Sex?
Male Female
What is your academic standing? Freshman
Sophomore Junior Senior
Are you a full-time or part-time student? Full-time
What is your major? (If undecided please enter "undecided") Please Specify
To the best of your knowledge what is your current GPA?
What is the highest level of education of your parent or gaurdian? Less than high school
High school or GED Some college
A bachelors or associates degree A masters or doctorate degree
Do you intend to complete your current degree? Yes
No
Do you intend to pursue a masters or doctorate degree? Yes
No
How many hours do you study for classes in a typical week? 0-1
2-5 6+
Do you work while in school? No
What is your living situation? Live on campus
Live off campus
Prior to college, how often did you use your public library? Never
Rarely Sometimes Often
Did your high school have a library? Yes
No
If you answered yes, how often did you use the library? Never
Rarely Sometimes Often
Have you ever taken a remedial course at the college level? Yes
No
Have you ever had a library instruction session at UNC, either as part of a class or workshop, where you learned of resources available at UNC's libraries?
In the last class assignment that required you to find more information about a subject, what where the first three places you looked? List them in order of importance. How helpful is this resource?
Not Very Somewhat Very Not Very Somewhat Very Not Very Somewhat Very
How often in a month would you say you use any of the campus libraries? Never
1-5 times 6-10 times 11+
If you use the library, what do you use it for and how often?
Borrowing books or other materials: Never Rarely Sometimes Often Checking Email: Never Rarely Sometimes Often
Researching Information for a class project/paper: Never Rarely Sometimes Often
Studying Alone: Never Rarely Sometimes Often Group Study: Never Rarely Sometimes Often
Other: Please Specify Never Rarely Sometimes Often How often do you use the online services available from the UNC Library system? i.e. databases, online catalog, etc...
In your opinion, is the library helpful in reaching your academic goals? Yes
No Not sure
Do you feel the library is important to the Univeristy as a whole? Yes
No Not sure
If you had an assignment to write a paper on a topic you know little about would you turn to the library for information?
Yes, I go to the library first. After consulting other sources.
I would not use the library, I can find the information elsewhere. If your instructor has put class materials on reserve at the library...
I never look at reserve materials
If I have time I look at reserve materials
Only if the readings are required would I look at them. I always look at reserve materials
If the library offered workshops on using library resources and improving your research abilities, would you be likely to attend such a workshop?
In general, do any of your instructors promote the use of the library when giving a research assignment?
Yes No Sometimes
Submit