Evaluation of Vermont School Wellness Policies
by
Lindsay P. Simpson
A Master’s Paper submitted to the faculty of the University of North Carolina at Chapel Hill
In partial fulfillment of the requirements for the degree of Master of Public Health in
the Public Health Leadership Program.
Chapel Hill
2012
________________________________
Abstract
Obesity among youth is a complicated public health and education challenge in Vermont
and across the United States. In addition to detrimental health consequences, youth obesity
negatively impacts quality of life and learning potential. School-based child wellness practices,
including healthful eating and physical activity, have great potential to maximize academic
success. To support positive change and to address the problem of child obesity, federal and
Vermont state legislation require that schools adopt and implement a School Wellness Policy
(SWP) that dictates a healthy learning environment for students. This study was designed to
evaluate the quality of SWPs from a geographically stratified sample of 25 Vermont high
schools. The Wellness School Assessment Tool (WellSAT) was used to measure and compare
the comprehensiveness and strength of SWPs.
The mean score for overall comprehensiveness of SWPs is 30.8 and the mean score for
overall strength is 15.7 for the 25 Vermont high schools in this sample. These scores fall much
below the highest possible score of 100 points. Among the schools in this sample, policies scored
more points for items related to Standards for USDA Child Nutrition Programs and School
Meals, and for items related to policy evaluation. Schools serving a larger proportion of students
living in poverty have higher quality SWPs than schools with fewer students living in poverty.
Schools serving only students in grades nine-12 have lower quality polices than schools serving a
broader grade-level distribution of students. The findings suggest that Vermont SWPs may be
weaker than those from a national sample, although differences in sampling and other study
design characteristics may contribute to this disparity.
Based on these findings, it is suggested that Vermont schools may benefit from state
learning. In the long term, a continuous improvement framework for school wellness, with
periodic policy assessment at multiple points is recommended. Finally, future research studies
are proposed, including replication of this type of study for the full range of grades in Vermont,
Introduction
Child obesity is one of the most troubling public health issues of the 21st Century. This
condition is associated with cardiovascular disease, type 2 diabetes, asthma, sleep disorders, and
musculoskeletal disorders.1 In terms of psychosocial complications, overweight or obese youth
are also more likely to be at the risk of facing social stigma which can lead to poor self-esteem,
depression, anxiety, and destructive behaviors.2,3 Most important for schools, poor nutrition and
physical inactivity among youth are negatively associated with academic performance.4,5
Although obesity is caused by caloric imbalance6, this public health issue has been
deemed a "wicked problem" due to the contribution of many complex biological, environmental,
and societal risk factors.7 Such societal risk factors include lack of education, poverty, limited
access to healthy food, parental obesity, and race.8, 9, 10, 11 Additionally, as they age, youth with
increased body-mass index levels (an indicator of body fatness) are at greater risk of becoming
obese adults.12
Considering these many risk factors, this complex problem requires a comprehensive
solution approach that addresses all levels of behavior influence: intrapersonal, interpersonal,
organizational/community, and public policy; as described by the socio-ecological model.13 As
public institutions, schools are in a position to implement both practices and policies to support
life-long health. Some may argue that due to the negative effects of obesity on quality of life14
and learning; 15, 16 schools are bound by a moral obligation to help solve child obesity.
Recognizing this important locus of influence, when the United States (U.S.) Congress
reauthorized the Federal Child Nutrition Act in 2004, a new provision required all schools with a
2010, the Healthy, Hunger-Free Kids Act expanded the SWP requirements to include a minimum
of the following additional provisions:17
"Include goals for nutrition promotion and education, physical activity, and other school-based activities that promote student wellness;
Include nutrition guidelines to promote student health and reduce childhood obesity for all foods available in each school district;
Permit parents, students, representatives of the school food authority, teachers of physical education, school health professionals, the school board, school administrators, and the general public to participate in the development, implementation, and review and update of the local wellness policy; Inform and update the public (including parents, students, and others in the community) about the
content and implementation of local wellness policies; and
Be measured periodically on the extent to which schools are in compliance with the local wellness policy, the extent to which the local education agency’s local wellness policy compares to model local school wellness policies, and the progress made in attaining the goals of the local wellness policy, and make this assessment available to the public".18
During this same period of action at the federal level, advocates in Vermont also
recognized that schools have an obligation to address child obesity because of the considerable
amount of time youth spend in this setting. Data from the Vermont Youth Risk Behavior Survey
reveals that between 2003-2011 youth overweight and obesity rates have ranged between 23%
and 27%.19 In order to address this threat to the current and future health of Vermonters, it is
critically important to acknowledge and capitalize on the reality that schools are a place of
significant influence for shaping youth knowledge, attitudes, and behaviors around both nutrition
and physical activity. Indeed, student wellness is a foundation for successful academic
performance.20
In Vermont, schools must provide students at least 175 teaching days per year.
Furthermore, the required educational program must include both nutrition education and
physical education for students in grades K-12.21 Data also indicate that 95% of Vermont
students have access to breakfast and/or lunch programs during the school day, thanks to the
federally-funded school food service programs.22 Equipped with this information, law makers
This law reinforces federal legislation by requiring all Vermont schools to write and
implement a SWP. In order to support this work, the law called upon the Vermont Department of
Education to collaborate with the Departments of Agriculture and Health to develop a model
policy. This document, called The Vermont Nutrition and Fitness Policy Guidelines, became a
list of best practices for creating a health-enhancing educational environment.24 At the request of
their members, the Vermont School Boards' Association (VTSBA), representing more than 300
independent school boards state-wide, also developed a sample wellness policy. However, in an
effort to minimize the burden on schools, the VTSBA wrote a sample policy that simply meets
the lowest standards of the law. In the accompanying letter, the organization specifically notes
that they "purposefully limited the scope of this model" and clarified that schools may choose,
but are not legally required, to expand upon this policy framework.25 Despite being very
different from one another, the influence of these model and sample policies is best understood
within the context of the Vermont school governance system.
In Vermont, the requirement of schools to create a local SWP becomes a varied and
complex process due to the unique public education governance structure. In stark contrast with
most states or urban areas across the country, Vermont's entire public education system serves
only 90,289 students in grades prekindergarten through 12.26 At the same time, a diverse
geographic and often rural landscape necessitates the operation of more than 300 public schools
which range in size from 14 students at East Haven River School to 1,345 students at Champlain
Valley Union High School.9 Furthermore, collectively Vermont schools have an extremely
diverse set of grade level configurations (e.g. PreK-12, K-6, 5-8, 7-8, 7-12, 9-12, etc…).27
Despite such low student enrollment and small school size, deep tradition and state law allow
school board member in power per approximately every 64 students.28 These school boards are
ultimately responsible for creating, implementing, and evaluating a local SWP. In addition, some
schools also operate a coordinated school health team or school health committee which may be
charged with development, implementation and oversight of the SWP. With such a large number
and variety of administrators in control of schools, it is possible that the quality of policies may
vary greatly across the state.
Although federal law requires the Vermont Department of Education to monitor all
school food service programs; which includes assessment of SWPs, this process may not assure
quality or consistency across schools. For example, due to limited staffing, Vermont schools are
typically only subject to review once every five years; and the process merely ensures that the
school has a policy in place.29 Consequently, the intent of limiting and preventing child obesity
through SWPs may or may not be realized.
In 2009, several Vermont agencies and non-profit partners pooled funds and staff
resources to develop an incentive for SWP monitoring and technical assistance - the School
Wellness Award.30 The award is designed to recognize and promote best school wellness
practices. To apply, schools conduct an electronic, self-assessment of their SWP and practices
and include narrative success stories. All applicants are provided an honorary banner to hang in
their building. In addition, top scoring schools in three categories - elementary, middle, and high
school - are rewarded with funds to support school wellness initiatives. Moreover, award
ceremonies are held across the state, at various conferences, to promote these examples of school
efforts to reduce child obesity. However, limited monitoring from the Vermont Department of
ensure that wellness policies and practices are implemented within a continuous improvement
system.
WellSAT Tool
In response to the nationwide need of schools to address child obesity; Yale University's
Rudd Center for Food Policy and Obesity developed a SWP evaluation tool called the Wellness
School Assessment Tool (WellSAT). Released in February 2010,31 this tool was born out of a
research-based, comprehensive, 96-item coding system that was designed to measure the quality
of school wellness policies.32 The tool is intended for use by school staff and/or public health
personnel who are interested in assessing the quality of local school wellness policies. In
addition, the WellSAT is available online at no cost.
WellSAT users create a personal login and then score one or more SWPs by rating
individual policy statements as zero, one, or two. Scores are then compiled into subsection
summaries as well as an overall rating that provides a numeric measure of policy
comprehensiveness and strength. Comprehensiveness is a measure of the degree to which
recommended content is addressed in the policy. The strength score indicates how strongly the
statement is phrased. (Specific scoring criteria are described below, see pp 11-12.) Once policy
analysis is completed, an auto-generated final report identifies useful resources that the school
can employ to ameliorate weak policy areas. Schwartz et al. found that the tool is a valid and
reliable measure of school wellness policy quality.33 Since this tool is relatively new, as of
December 2011 no research studies that employed the tool have yet been published.
As of December 2011, the WellSAT website has been viewed by over 12,000 visitors
from every state in the nation, plus the District of Columbia. Over 2,000 visitors were from
1333 policies from all states. These policies were not systematically collected. Rather, it is
possible that this sample represents early initiators who were motivated to make SWP
improvements. Among this sample, the mean total comprehensiveness score was 56.1 points
(standard deviation = 21.4 points) while the mean total strength score was 33.0 points (standard
deviation = 21.3 points). Hence, these scores indicate that nationally SWP quality falls far below
the WellSAT standard of excellence that is set at 100 points for comprehensiveness and 100
points for strength.
Quality of School Wellness Policies
Considering the powerful role of schools in addressing child obesity, the purpose of this
study is to understand the quality of existing wellness policies from a sample of Vermont
schools. This study aims to assess and describe SWPs to help identify strengths and deficiencies
across the state. The work was carried out from August 2011 to December 2011 - seven years
after federal and state governments required schools to adopt SWPs. What follows is a
description of the process, findings, and implications from a systematic analysis of policies
collected from a sample of Vermont public schools that provide education to students in grades
nine through twelve. Findings from this study have the potential to guide development of
training and technical assistance to enhance the work of developing, implementing, and
evaluating the effectiveness of SWPs. The methodology in this study may also be useful to
provide a framework for policy assessment and improvement over time.
Methods
Sampling and Data Collection
As discussed, since 2004 Vermont schools have been required by both federal and state
whether schools are operating in compliance with these laws. The study also provides a measure
of policy quality. To conduct the investigation, Vermont schools serving students in grades
nine-12 (n=60) were divided into strata based on county location. High schools were chosen because
these schools are often larger and fewer than elementary schools. Although there are 14 counties
in Vermont, Grand Isle County does not have a high school, therefore data were available from
schools in 13 counties. Next, two high schools were randomly identified from each of the
remaining 13 counties to create a target sample of 26 geographically dispersed high schools. This
sample design represents approximately 40% of Vermont public schools serving high
school-aged youth. (See the results sections for a detailed description of sample demographics.)
Each of the 26 targeted high schools was contacted by a research assistant from
Dartmouth Medical School (see Appendix A) who was assigned the task of collecting primary
data - the SWP. To ensure consistent messaging about the purpose of data collection, both a
telephone script and e-mail script were used (see Appendix B). Three of the 26 targeted schools
did not respond to the request for their policy. Fortunately, each non-responsive school was
located in a different county. From two of these counties, a third high school was randomly
selected and a SWP was successfully collected. The third county is home to only two high
schools; therefore a second SWP could not be collected. Altogether, the final sample included
primary data from 25 schools that represent 13 Vermont counties.
In addition to these primary data, other available secondary data were collected from the
Vermont Department of Education's Education Data Warehouse (EDW) with help from a
Department of Education data analyst (see Appendix A). For each of the 25 sample schools the
following information was retrieved: grade level distribution, number of students, student race,
Food Policy and Obesity. The organization provided SWP scores from a national sample of data
that was stored in the WellSAT database (see Appendix A and Figure 6).
School Wellness Policy Evaluation
Each SWP was evaluated for comprehensiveness and strength using the WellSAT. To
develop a study protocol, the WellSAT supporting background documents and instructions were
reviewed.35 Next, SWPs were collected from two high schools outside of the study sample. The
policies for these two schools were scored by the primary researcher in order to practice the
evaluation methods. This process informed creation of a project-specific coding protocol (see
Appendix B). Next, the primary researcher scored each of the 25 policies included in the study
sample.
To ensure inter-rater reliability 20% (n = 2) of the sample SWPs were randomly selected.
Then, a research assistant from Dartmouth Medical School used the same scoring protocol to
produce a second score for each of these policies. In advance, a 20% margin of difference was
determined as an acceptable threshold of agreement for the total comprehensiveness and total
strength scores. Both scores for these two policies fell within this margin of difference.
The WellSAT tool is divided into five distinct sections: Nutrition Education and Wellness
Promotion (NEWP), Standards for USDA Child Nutrition Programs and School Meals (US),
Nutrition Standards for Competitive and Other Foods and Beverages (NS), Physical Education
and Physical Activity (PEPA), and Evaluation (E). Each section includes between four and 16
questions designed to evaluate the comprehensiveness and strength of policy items in that
category. In the NEWP section, nine items are scored on a scale from zero to two. In the US
section, seven items are scored on a scale from zero to two. The NS section "relates to sale or
therefore the NS section rates 16 items on a scale from zero up to four. The highest score of four
is given for statements that ban the sale of food items which compete with the sale of USDA
meals served at a school. The PEPA section addresses fourteen policy items; all of which are
scored from zero to two. Finally, the E section assesses four items on a scale of zero to two. For
each item, a score of zero = Not mentioned; one = Weak Statement; two, three, or four =
Meets/Exceeds Expectations.36
After all items in each section are evaluated, the WellSAT automatically generates a
score of comprehensiveness and a score of strength for each of the five sections described above
and for the overall policy. As previously described, comprehensiveness is a measure of the
degree to which recommended content is addressed in the policy, whereas the strength score
indicates how strongly the statement is phrased. The highest possible score for overall
comprehensiveness is 100 points. The highest possible score for overall strength is also 100
points.37 Likewise, for each subsection, the maximum score is 100.
The WellSAT also generates results for each individual policy in a data file which allows
for compilation and analysis of all quality measures. Note also that the WellSAT produces a
school-specific score card which includes feedback and web-links to resources that can be used
to help enhance the policy that was scored. This information can be shared with each of the
schools in the study sample.
Results
Vermont Study Sample Characteristics
The final sample of Vermont high schools includes 25 schools selected from 13 Vermont
counties. This sample represents 42% of public schools serving students in grades nine-12.
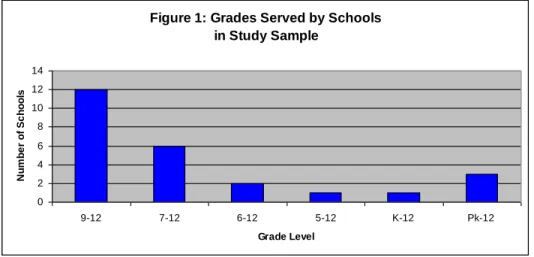
of 25 schools (48%) serve only students in grades nine-12, six schools (24%) serve students in
grades 7-12, two schools (8%) serve students in grades six-12, one school (4%) serves students
in grades five-12, one school (4%) serves students in grades K-12, and three schools (12%) serve
students in grades Pk-12 (see Figure 1).
Figure 1: Grades Served by Schools in Study Sample
0 2 4 6 8 10 12 14
9-12 7-12 6-12 5-12 K-12 Pk-12
Grade Level N u m b e r o f Sc h o o ls
As stated above, the total public school population of 90,289 PreK-12 students in
Vermont is small compared with other states.25, 38 Furthermore, Vermont is a relatively rural state
with a low population density.39 Therefore, school size is considered small compared with those
of others states.40, 41 Among this sample of 25 schools, four schools (16%) serve 250 or fewer
students, 11 schools (44%) serve 251-500 students, seven schools (28%) serve 501-1000
students, and three schools (12%) serve 1001 or more students (see Figure 2).
Figure 2: Size of Schools in Study Sample
0 2 4 6 8 10 12
<250 251-500 501-1000 >1001
Number of Students
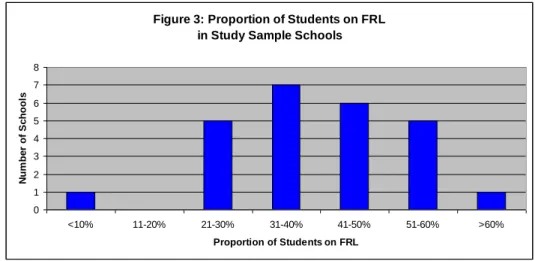
In order for students to enroll in the federally-funded school food service program,
parents/guardians with low incomes must complete an application form on behalf of their
student(s). Hence, the proportion of students in the Free- or Reduced-Priced Meal Program
(FRL) serve as an indicator of the income of families served by the school. Specifically, a higher
proportion of students in FRL indicate that the school is serving more families with low income.
Among the schools in this sample, one school (4%) reports less than 10% of students in FRL,
five schools (20%) are serving a population with 21-30% of students in FRL, seven schools
(28%) are serving a population with 31-40% of students in FRL, six schools (24%) are serving a
population with 41-50% of students in FRL, five schools (20%) are serving a population with
51-60% of students in FRL, and one school (4%) reported that over 51-60% of their students participate
in FRL (see Figure 3).
Figure 3: Proportion of Students on FRL in Study Sample Schools
0 1 2 3 4 5 6 7 8
<10% 11-20% 21-30% 31-40% 41-50% 51-60% >60%
Proportion of Students on FRL
N
um
be
r
of
S
c
ho
ol
s
In terms of race, Vermont schools generally do not serve a diverse student body, which is
reflected in this study sample. Among the schools in this sample, one school reports serving a
population with 72.9% white students. The other 24 schools report that their population of
students is comprised of between 89.4% to 98.1% white students.
Among the high schools in this sample, the mean score for overall comprehensiveness of
SWPs is 30.8 (standard deviation 11.3 points) and the mean score for overall strength is 15.7
(standard deviation 7.3 points). These scores fall much below the highest possible score of 100
points. It is also noteworthy that scores range between five and 59 points for total
comprehensiveness and between zero and 37 points for total strength (see Table 1). Only one
school was scored 0 for overall strength because it did not include any statements that aligned
with legal requirements. This same policy earned the lowest score of five points for
comprehensiveness because it had only one weak statement that named the superintendent as
responsible for policy implementation.
Table 1: Summary of Overall WellSAT Scores for Comprehensiveness and Strength
Low High Mean Standard
Deviation
Total Comprehensiveness 5 59 30.8 11.3
Total Strength 0 37 15.7 7.3
Mean subsection scores for comprehensiveness and strength are as follows: NEWP -
16.3 and 3.6 points; US - 47.3 and 23.6 points; NS - 22.2 and 6.2 points; PEPA- 23.0 and 5.7
points; E - 45.0 and 39.0 points (see Table 2).
Table 2: Summary of Comprehensiveness and Strength Scores by Section of WellSAT
Low High Mean Standard
Deviation
NEWP Comp. 0 67 16.3 12.9
Strength 0 56 3.6 11.5
US Comp. 0 71 47.3 19.6
Strength 0 43 23.6 11.0
NS Comp. 0 56 22.2 13.7
Strength 0 50 6.2 10.5
PEPA Comp. 0 73 23.0 16.6
Strength 0 45 5.7 13.2
E Comp. 25 50 45.0 10.2
Strength 0 50 39.0 19.2
NEWP - Nutrition Education and Wellness Promotion
A separate analysis was conducted to assess whether SWP quality is related to student
family poverty level. Recall that a higher proportion of students in FRL indicates that the school
is serving more families with low income. To carry out this analysis, a dichotomous "poverty
status indicator" was developed. Sample schools were divided into two groups defined by
whether they were above or below the midpoint of the proportion of students in FRL: low
poverty schools [<40% of students in FRL (N = 13)]; and high poverty schools [≥41% of
students in FRL (N = 12)]. Low poverty schools have slightly lower SWP quality scores than
high poverty schools. Mean total comprehensiveness score is 28.5 points and mean total strength
score is 13.6 points for the schools with a smaller proportion of low income students. Mean total
comprehensiveness score is 33.3 points and mean total strength score is 17.8 points for the
schools with a larger proportion of low income students (see Table 3 and Figure 4).
Table 3: Overall WellSAT Scores by School Poverty Status*
Mean Comprehensiveness Mean Strength Low poverty schools
(<40% FRL, n=13)
28.5 13.6
High poverty schools
(≥41%, n=12)
33.3 17.8
* Proportion of students who participate in the Free and Reduced Priced Meal Program (FRL)
Figure 4: Vermont Wellness Policy Scores by Poverty Status
0 5 10 15 20 25 30 35 Comprehensiveness Strength P o in t S c o re
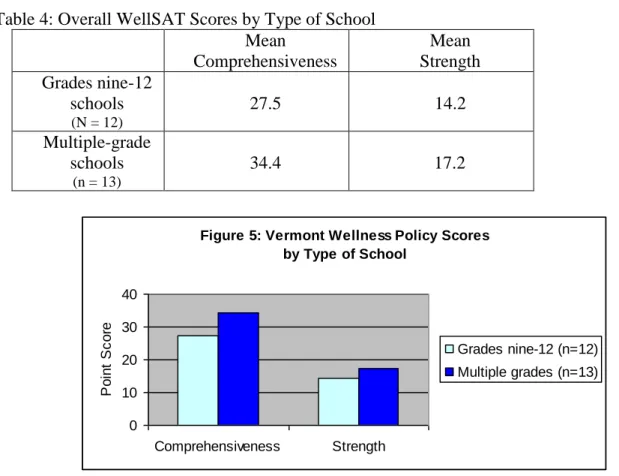
A final investigation of the Vermont SWP data was conducted to assess whether quality
of policy is related to the type of school. In this case, type is defined by the grade level
distribution within the school. As previously discussed, Vermont schools vary greatly by the
grade levels served. In this sample of high schools, 12 serve only grades nine-12, whereas 13
schools serve grades nine-12 along with students in elementary and/or middle school (herein
referred to as "multiple-grade schools") (see Figure 1). The SWP scores from nine-12 only
schools are lower than the policy scores from the multiple-grade schools. Specifically, mean total
comprehensiveness is 27.5 points and mean total strength score is 14.2 points for the schools
with grades nine-12 only. Mean total comprehensiveness is 34.4 points and mean total strength
score is 17.2 points for the schools with students in elementary, middle, and/or high school (see
Table 4 and Figure 5).
Table 4: Overall WellSAT Scores by Type of School Mean Comprehensiveness Mean Strength Grades nine-12 schools
(N = 12)
27.5 14.2
Multiple-grade schools
(n = 13)
34.4 17.2
Figure 5: Vermont Wellness Policy Scores by Type of School
0 10 20 30 40 Comprehensiveness Strength P o in t S c o re
Grades nine-12 (n=12)
Vermont School Wellness Policy Scores Compared with National Data
The Vermont sample SWP scores are lower than scores for the policies from the national
sample (n=1333) retrieved from the WellSAT database as of December 2011. Among the
national sample, the mean total comprehensiveness score is 56.1 points (standard deviation =
21.4 points) and the mean total strength score is 33.0 points (standard deviation = 21.3 points).
As indicated above, among the schools in this Vermont sample, the mean score for overall
comprehensiveness of SWPs is 30.8 (standard deviation 11.3 points) and the mean score for
overall strength is 15.7 (standard deviation 7.3 points) (see Table 1). This represents a difference
of 25.2 points for comprehensiveness and a difference of 17.3 points for strength. In other words,
the scores from the national sample are nearly double those scores for Vermont SWPs (see
Figure 6). On the other hand, as identified in Table 2, the Vermont policies did score well in a
few subsections.
Figure 6: School Wellness Policy Scores, Vermont vs. National Sample
0 10 20 30 40 50 60
Comprehensiveness Strength
P
o
in
t
S
c
o
re
Vermont (n=25)
National (n=1333)
Discussion
Based on this sample of 25 Vermont high schools, the mean score for overall
score for overall strength (15.7 points) is only about one-sixth of the highest possible score, 100.
These measures indicate a need for improved SWPs among the high schools in Vermont.
Comparisons to national averages also provide useful information for analyzing the
meaning of the findings in this study. Mean overall scores for comprehensiveness and strength
among this sample of Vermont high schools are about one-half the value of nationally reported
scores; once again providing an indicator of need for improvement. However, it must be noted
that this variation may be due to a difference in sample size and/or due to sampling techniques.
The national sample (n=1333) is over 53 times larger than the Vermont sample (n=25). Then
again, although large, the national sample was not randomly selected. The national data may
reflect some favorable selection bias due to the fact that this information was self-reported. Also,
it is not know what grade ranges are represented among the national data; whereas, the Vermont
sample primarily focused on high schools. Consequently, these comparisons should be made
with caution. Nevertheless, differences of this magnitude are unlikely to be attributable to
sampling methods alone.
A deeper level of analysis shows that among the Vermont SWPs, scores for the five
WellSAT subsections also vary (see Table 2). Relatively high scores were awarded to the US and
E sections. The mean US scores are 47.3 points for comprehensiveness and 23.6 points for
strength while the mean E section scores are 45.0 points for comprehensiveness and 39.0 points
for strength. In terms of other subsection scores for comprehensiveness, these means are
approximately double the scores for NEWP, NS, and PEPA subsections. This result is
encouraging because it indicates that school policy makers were consistent with the details of the
Standards for USDA Child Nutrition Programs and School Meals. It suggests that quality of
addition, the high scores for evaluation suggest that policy writing teams made an effort to
emphasize the importance of policy management, including reporting on implementation.
One of the most interesting findings of this study is that schools with relatively high
poverty levels have stronger SWPs than the group of schools with less poverty. The difference in
scores is 4.8 points for comprehensiveness and 4.2 points for strength. Another remarkable trend
among this sample of SWPs is that schools serving only grades nine-12 have weaker policies
than schools with elementary, middle and/or high school students. The difference in SWP scores
by type of school is 6.9 points for comprehensiveness and 3.0 points for strength.
For each of these findings, the consistency of direction for both measures of SWP quality
makes this difference notable. They may indicate that schools serving a large proportion of
students living in poverty and schools serving a broader age range of children are already tuned
into the importance of establishing a healthy environment for academic success. However, due to
small size of the differences coupled with the small numbers of schools in each sub-category,
only limited conclusions can be drawn from these results. In fact, these sub-category differences
may be due to chance alone. To understand this better, these findings are worthy of further
investigation in future studies with larger sample sizes.
SWP development may be influenced by relative income of student families. This may be
correlated with other important county or town characteristics. Schools located in small, rural,
low-income towns are likely to be operating on a smaller budget and have reduced potential for
drawing on additional community financial support to enhance the school nutrition and physical
activity environment. Large, urban, wealthy school systems not only have larger budgets, but
also naturally have access to a broader network of resources from which to draw support for
Vermont Food Education Every Day (FEED) reports that "from 2004 to 2010 the number of
students eligible for FRL grew by 21%.42 Nevertheless, despite these challenges, this study
suggests that perhaps schools serving more students with low-income are able to establish buy-in
from policy makers to enhance the wellness environment. Furthermore, perhaps because such
schools are identified as economically needy they are better positioned to secure funding and
programmatic resources to improve the wellness environment. Certainly, a high-quality wellness
policy is an important supporting document to show value for school wellness when applying for
support.
It must be reiterated that this sample of SWPs does not represent all of K-12 education in
Vermont. Nevertheless, as the data about school type may indicate, some school policy makers
may believe younger students need to be educated in an environment with tighter guidelines over
nutrition and physical activity than older peers. As students stretch toward graduation, it may be
more natural for school officials to support student growth and independence by reducing
restrictions and increasing choices. Hence, future investigations might focus on schools serving
early grades so that this finding can be better understood. In addition to grade level distribution,
it must also be noted that some districts or supervisory unions which oversee multiple schools
elect to adopt one policy for all schools. This was the case for approximately 14 of the 25
schools in this sample.
SWPs and practices may also be enhanced by the presence of a strong, active school
wellness team. The Centers for Disease Control and Prevention (CDC) recommends Coordinated
School Health (CSH) as a strategy to improve student health and learning.43 This CSH model,
employed by many Vermont schools, involves establishing a team of school staff, administrators,
goals based on data, b) determine available resources, c) establish and action plan, and d)
implement and evaluate the plan. Anecdotally, schools with high-quality SWPs often attribute
this to the activities of an influential school health team - especially one that includes a local
health care provider. This is another aspect of SWP development that could be investigated in
future studies.
In reviewing and discussing these findings, limitations of the research methods must be
considered. These include a critique of sampling and scoring methods, an assessment of the
investigation scope, and feedback about the WellSAT tool.
The sampling method of stratifying schools by county location is a trade off between
collecting a geographically diverse sample of SWPs and gathering a sample that proportionately
represents the entire population distribution of Vermont schools. As noted, this strategy also
focuses on schools serving high school youth. Schools that exclusively serve elementary and
middle school students were not included in this sample because there tends to be much variation
in size and resources of these schools. Hence, the results are not necessarily generalizable to K-8
schools. Likewise, the methods do not result in a true proportionate representation of all high
schools in the state. To make this study manageable, the stratification methods ensures county
representation but limits the number of schools that can be selected to only two schools in each
county. This tends to overrepresent schools in small counties and underrepresent schools in large
counties. For example, Washington County has only seven schools that provide high school
education. Because the sampling method calls for random selection of two schools per county
this small ratio statistically increases the chance of any single school selection. This is both a
introduces a simple and efficient process for ensuring geographic representation, but may
sacrifice the proportional representation of schools in every county.
As described in the methods section, the entire sample of SWPs was scored once by the
same researcher. Intra-rater reliability was not assessed. Inter-rater reliability was based on the
second scoring only 20% of the sample (two policies). It is possible that this scoring method may
reduce the accuracy and reliability of findings. Given increased resources of personnel and time,
the methods can be strengthened if all SWPs in the sample are scored independently by two
researchers. Then, both set of records can be checked and adjusted for agreement. Despite these
small challenges, the overall sampling methods and analysis procedure resulted in 25 policies
that were collected and scored. It is thought that these methods generated a respectable pilot
study of SWPs in Vermont high schools.
Also important to consider is that all findings in this study are based on the WellSAT,
which is still a relatively new methodology with only limited use and no peer-reviewed,
published studies. Although it is thought to be a valuable and reliable evaluation tool, only
through wider testing and application can the WellSAT be fully assessed. Most notably, its use in
a wider variety of settings (e.g. urban vs. rural, low poverty vs. high poverty) will contribute
further to understanding the usefulness and sources of variability of this methodology.
Replication of studies, such as the one reported here, will produce additional data to fully assess
the value of the WellSAT. Based on its application in this study, the following observations are
offered.
The WellSAT was created for use by schools across the country. Therefore, some aspects
of the tool may be better aligned with education systems in certain parts of the U.S. For example,
quality and taste of meals. Nevertheless, in general, this online SWP scoring system is easy to
use. Explanation for scores is clear and well supported with examples for each measure. It is also
helpful that the final scoring report is available electronically in multiple formats (i.e. as a text or
data file) and is accompanied by resources to support policy improvements. Recognizing that the
scoring process inherently requires subjective decision-making, users might benefit from a
comprehensive sample SWP that has been scored by Rudd Center for Food Policy and Obesity
staff. This sample could be enhanced by including a detailed explanation for scoring decisions.
In terms of question details, a few inconsistencies between the WellSAT sections for
nutrition education and physical education are noted. First, in the PEPA section, question seven
allots points for schools that hire licensed physical education instructors. A similar question is
not included for hiring licensed health/nutrition education instructors. Second, the PEPA section
includes a question (number five) about the student-teacher ratio. An analogous question does
not appear for the NEWP section. Third, neither section addresses whether the SWP sets limits to
interruptions for either nutrition education or physical education. Such a question would address
the reality that increased pressure on academic performance measures, via standardized test
scores, has caused many administrators to pull students out of these classes for other academic
interventions. Question ten in the PEPA section addresses physical activity breaks during
standard classroom instruction. This question unfortunately refers only to instruction at the
elementary school level. Neuroscience research indicates students of all grade-levels experience
learning and health benefits from regular, interspersed bouts of physical activity.44 Therefore, it
is recommended that this question be applied not just to elementary education, but also to middle
update to the USDA Nutrition Standards for national school lunch and school breakfast
programs.45
Implications
Collectively, the low quality scores of SWPs in this study sample indicate that schools in
Vermont may benefit from additional supports for school wellness. Many of the analyzed
policies mimicked the simpler version distributed by the VTSBA, thereby leading to low scores
on the WellSAT. Assuming that stronger SWPs can put schools in a more powerful position to
help halt and even reduce child obesity, leadership for this work must be bold and specific. For
example, state agencies such as the Vermont Departments of Education and Health and other
community partners like FEED might consider investing in training, resources, and technical
assistance to help local school boards and CSH teams establish strong wellness systems. Training
for policy setters must first address the importance of wellness for student learning; then
emphasize the most effective, repeatable strategies that will enhance student wellness and reduce
obesity. Second, resources such as high quality, model policies from Vermont schools plus the
WellSAT tool itself must be promoted. Third, school leaders might benefit from assistance with
the process of policy writing and for establishing feasible implementation and monitoring
strategies. Finally, after provision of these supports, this study could be repeated at a later point
in time to determine if SWPs do indeed strengthen. As a whole, this work will create a
continuous improvement system similar to the community health assessment process employed
by the field of public health.46
Future Research and Recommendations
This investigation can be thought of as an initial assessment of SWPs in Vermont as well
investigations are proposed for the future. First, as in all successful research, it is important to
replicate this study. A larger Vermont sample size with broader grade-level distribution will help
establish a clear picture of SWPs statewide. Furthermore, results of a larger sample of Vermont
SWPs could be more accurately compared with those from a national sample of policies when
data collection methods are consistent across both samples.
Additional data and study about use of the WellSAT would be beneficial to school
systems as a way to measure SWP quality and compliance with federal and state regulations.
With that in place, a long term recommendation for Vermont includes the development of a
continuous improvement framework that employs the WellSAT to evaluate SWPs over time by
tracking changes using traditional methods for continuous quality improvement.47
Next, it is important to investigate further the policy writing and implementation process,
which is critical to understanding the efficacy of any policy. Clearly, a written policy tells us
nothing about how the document is written, implemented, or evaluated. Hence, additional
research is necessary to understand how SWPs are created at the local level. This subsequent
work could be accomplished through structured interviews with school administrators or CSH
team members. Some questions might include: How were stakeholders engaged in the policy
writing process? What resources or sample policies were consulted? What factors limit the
quality of documents approved by local school boards? This type of information could be used to
drive provision of training and technical assistance for schools.
Of course, regardless of the policy content, these documents are meaningless unless they
are implemented, enforced, evaluated, and improved. Therefore, it must also be understood what
significance or value a school places on the SWP in light of other federal and state requirements
members of our communities - schools must recognize that learning cannot take place if children
are not well. Public health officials must also step up to support schools while helping them to
Appendix A
Acknowledgements
This study was conducted with the generous help of several individuals. Thank you to Linda Laros of Dartmouth Medical School and Yesha Maniar of Dartmouth College. Linda and Yesha helped with primary data collection. Yesha also assisted with secondary coding of SWPs. Dan Sheppard, Vermont Department of Education, provided secondary data for each school. Meghan O'Connell, Rudd Center for Food Policy and Obesity at Yale University, provided helpful background information and critical secondary data from the WellSAT.
Most importantly, much gratitude is shared with my two project advisors. Dr. Anna Adachi-Mejia, Dartmouth Medical School, sparked the inspiration for this project then generously shared her time and expertise as an advisor and second reader. Dr. Bill Sollectio, Gillings School of Global Public Health at the University of North Carolina Chapel Hill,
provided thoughtful guidance for project development and essential input as the primary reader.
Appendix B
Script for Collecting Wellness Policies by Phone or e-mail
Hi, this is name from Dartmouth Medical School in Lebanon, New Hampshire. I was hoping to obtain a copy of the school’s local wellness policy. Do you know if that is available somewhere online?
If yes – what is the website?
[try to check it while you are still on the phone]
If no – is there someone I could speak with at the school to obtain a paper copy of your policy?
By e-mail: _____________________ Please send it to…
name
HB 7925, Dartmouth Medical School Lebanon, NH 03766
My number is 603-653-9115 if you have any questions. Many thanks!
[if they need more info from you]
I’m a research assistant for Dr. Adachi-Mejia at Dartmouth Medical School. She is very
interested in learning more about school local wellness policies and we have copies from schools across the state but they are several years old. We’re hoping to update what we have to make sure they are the most recent. What might be a best way to get a copy?
Appendix C
School Wellness Policy Scoring Protocol
1. Register for an account with the Rudd Center WellSAT: http://www.wellsat.org/
2. Read WellSAT scoring guide:
http://www.yaleruddcenter.org/resources/upload/docs/what/communities/SchoolWellness PolicyEvaluationTool.pdf
3. Review the blank survey: http://www.wellsat.org/evaluation.aspx
4. Review WellSAT FAQs: http://www.wellsat.org/faq.aspx
5. Thoroughly review the School Wellness Policy.
6. Create a record in the WellSAT by school name.
7. Score the School Wellness Policy. This process should take about 30-45 minutes per policy.
a) Keep a hard copy record of the score assigned to each statement on the School Wellness Policy. For example:
"Administration will ensure compliance with the Wellness Policy and will provide a report of the school district’s compliance with the Policy to the school board as requested through data available to them." Statement gets two scores: E1-2, E3-2
b) If forced to make a judgment between two scores, assign higher score.
c) If an attachment is referenced but not included with the School Wellness Policy, do not score this attachment.
8. After the scoring is complete for each School Wellness Policy ensure that a copy is e-mailed to your account. Then forward this e-mail copy to [email protected] and [email protected]
References
1
Centers for Disease Control and Prevention. (2011). Basics About Childhood Obesity. Retrieved 11/23/11 from:
http://www.cdc.gov/obesity/childhood/basics.html
2 Ebbeling, C.B., Pawlik, D. B., and Ludwig, D. S. (2002). Childhood obesity: public-health crisis, common sense
cure. The Lancet. 360: 473–82.
3
Tilda Farhat, T., Iannotti, R.J., and Simons-Morton, B. G. (2010). Overweight, Obesity, Youth, and Health-Risk Behaviors. American Journal of Preventative Medicine. 38(3):258–267.
4 Centers for Disease Control and Prevention. (no date). Physical Inactivity and Unhealthy Dietary Behaviors and
Academic Achievement. Retrieved 1/6/12 from:
http://www.cdc.gov/healthyyouth/health_and_academics/pdf/physical_inactivity_unhealthy_weight.pdf
5 Basch, Charles, E. (2010). Healthier Students are Better Learners: A Missing Link in School Reforms to Close the
Achievement Gap. Retrieved 1/6/12 from:
http://www.equitycampaign.org/i/a/document/12557_EquityMattersVol6_Web03082010.pdf
6
Centers for Disease Control and Prevention. (no date). Obesity and Overweight - Causes and Complications. Retrieved 1/31/12 from: http://www.cdc.gov/obesity/causes/index.html.
7 Finegood, D.T., Merth, T. D. N., & Rutter, H. (2010). Implications of the Foresight Obesity System Map for
Solutions to Childhood Obesity. Obesity. 18, S13–S16.
8
Paeratakul S, Lovejoy JC, Ryan DH, Bray GA.(2002). The relation of gender, race and socioeconomic status to obesity and obesity comorbidities in a sample of U. S. adults. International Journal of Obesity. v26, 205–10.
9 Drewnowski, A. & Specter, SE. (2004). Poverty and obesity: the role of energy density and energy costs. American
Journal of Clinical Nutrition, 79(1), 6-16.
10
Magarey, A. M. et. al. (2003). Predicting obesity in early adulthood from childhood and parental obesity. International Journal of Obesity. 27, 505–513.
11 Cossrow, N. & Falkner, B. (2004). Race/Ethnic Issues in Obesity and Obesity-Related Comorbidities. The Journal
of Clinical Endocrinology & Metabolism. 89(6), 2590-2594.
12
Sun Gao et. al. (2002). Predicting overweight and obesity in adulthood from body mass index values in childhood and adolescence. American Journal of Clinical Nutrition, 76(3), 653-658.
13 Glanz K, Rimer Bk and Lewis, FM. (2002). The scope of health behavior and health education. In K Glanz, FM
Lewis, & B Rimer, (eds.) Health behavior and health education: Theory, research, and practice, 3rd ed., San Francisco: Jossey-Bass Publishers. Pp. 3-21.
14 Ebbeling, C.B., Pawlik, D. B., and Ludwig, D. S. (2002). Childhood obesity: public-health crisis, common sense
cure. The Lancet. 360: 473–82.
15
Centers for Disease Control and Prevention. (no date). Physical Inactivity and Unhealthy Dietary Behaviors and Academic Achievement. Retrieved 1/6/12 from:
http://www.cdc.gov/healthyyouth/health_and_academics/pdf/physical_inactivity_unhealthy_weight.pdf
16 Basch, Charles, E. (2010). Healthier Students are Better Learners: A Missing Link in School Reforms to Close the
Achievement Gap. Retrieved 1/6/12 from:
http://www.equitycampaign.org/i/a/document/12557_EquityMattersVol6_Web03082010.pdf
17 U.S. Public Law 111–296. (2010). Retrieved 11/26/11 from:
http://www.gpo.gov/fdsys/pkg/PLAW-111publ296/pdf/PLAW-111publ296.pdf
18 Centers for Disease Control and Prevention. (2011). Local School Wellness Policy. Retrieved 11/26/11 from:
http://www.cdc.gov/healthyyouth/npao/wellness.htm..
19 Vermont Department of Health. (2011). Vermont Youth Risk Behavior Survey. Retrieved 11/24/11 from:
http://healthvermont.gov/research/yrbs.aspx.
20 Basch, Charles, E. (2010). Healthier Students are Better Learners: A Missing Link in School Reforms to Close the
Achievement Gap. Retrieved 1/6/12 from:
http://www.equitycampaign.org/i/a/document/12557_EquityMattersVol6_Web03082010.pdf
21 Vermont State Board of Education. (2006). School Quality Standards. Retrieved 11/26/11 from:
http://education.vermont.gov/new/pdfdoc/board/rules/2300_2343_2350.pdf.
22 Vermont Food Education Every Day. (2010). How Do We Feed Vermont's School Children? Retrieved 11/24/11
from: http://www.vtfeed.org/sites/default/files/staff-files/site-downloads/FarmtoSchoolPrimer2010.pdf.
23 Vermont General Assembly. (2004). H.272: An Act Relating to Nutrition Policy in Vermont Schools. Retrieved
24 Agency of Agriculture, Food and Markets, Vermont Departments of Education and Health. (2008). Vermont
Nutrition and Fitness Policy Guidelines. Retrieved. 11/26/11 from:
http://education.vermont.gov/new/pdfdoc/pgm_nutrition/school_nutrition/policy/nutrition_policy_guidelines_1008.p df.
25 Vermont School Boards' Association. (2005). Model Policy on Wellness. Retrieved 11/26/11 from:
http://www.vtvsba.org/policy/f28.pdf.
26
Vermont Department of Education. (2011). Elementary/Secondary Public School Enrollment 2010-2011 School Year. Retrieved 11/23/11 from:
http://education.vermont.gov/new/pdfdoc/data/enrollment/EDU-Elementary_and_Secondary_Public_School_Enrollment_2010_2011_School_Year.pdf.
27 Verbal communication. Glenn Bouchard, IT: Data Management Analysis. Vermont Department of Education. 10/
2011.
28
Vermont Department of Education. (2007). Vermont Education Governance: A Brief Primer. Retrieved 11/26/11 from: http://education.vermont.gov/new/pdfdoc/dept/archived_initiatives/ed_governance/primer_0107.pdf.
29 Verbal Communication. Laurie Colgan, Director of Child Nutrition Programs. Vermont Department of Education.
1/ 2012.
30
Vermont Department of Health. (2012). Fit and Healthy Kids School Wellness Award. Retrieved on 1/31/12 from:
http://healthvermont.gov/local/school/healthy_schools.aspx#wellnessawards
31 E-mail communication: Meghan O'Connell, Yale Rudd Center for Food Policy and Obesity. 12/19/11. 32
Schwartz, et. al. (2009). A Comprehensive Coding System to Measure Quality of School Wellness Policies. Journal of the American Dietetic Association. 109: 1256-1262.
33 Ibid.
34 E-mail communication: Meghan O'Connell, Yale Rudd Center for Food Policy and Obesity. 12/19/11. 35
Yale Rudd Center for Food Policy and Obesity. (2010). WellSAT: Wellness School Assessment Tool. Retrieved 11/15/11 from: http://www.wellsat.org/.
36 Schwartz et al. (no date). School Wellness Policy Evaluation Tool. Retrieved 12/14/11 from:
http://www.wellsat.org/faq.aspx.
37 Ibid. 38
National Center for Education Statistics. (2012). Total Student Membership, 2009-2010. Retrieved on 1/31/12 from: http://nces.ed.gov/pubs2011/snf200910/tables/table_04.asp
39 U.S. Census Bureau. (2010). Resident Population Data - Population Density. Retrieved 1/31/12 from:
http://2010.census.gov/2010census/data/apportionment-dens-text.php.
40 Ibid.
41 National Center for Education Statistics. (2012). Average student membership size of regular public elementary
and secondary schools, 2009-2010. Retrieved on 1/31/12 from:
http://nces.ed.gov/pubs2011/pesschools09/tables/table_05.asp
42 Vermont Food Education Every Day. (2010). How Do We Feed Vermont's School Children? Retrieved 11/24/11
from: http://www.vtfeed.org/sites/default/files/staff-files/site-downloads/FarmtoSchoolPrimer2010.pdf.
43 Centers for Disease Control and Prevention. (2011). Coordinated School Health. Retrieved 11/27/11 from:
http://www.cdc.gov/healthyyouth/cshp/.
44
Centers for Disease Control and Prevention. (2010). Association Between School-Based Physical Activity, Including Physical Education, and Academic Performance. Retrieved 11/27/11 from:
http://www.cdc.gov/healthyyouth/health_and_academics/pdf/pape_executive_summary.pdf.
45
U.S. Department of Agriculture. (2012). Press release: USDA Unveils Historic Improvements to Meals Served in America’s Schools. Retrieved 2/12/12 from: http://www.fns.usda.gov/cga/PressReleases/2012/0023.htm
46 Durch, J. S., Bailey, L. A., & Stoto, M. A. (1997) Improving Health in the Community - A Role for Performance
Monitoring. Institute of Medicine. Washington, D.C.
47
W. A. Sollecito and J.K. Johnson ( Eds.). (2013). Continuous Quality Improvement in Health Care,4th Edition. Jones and Bartlett Publishers. Sudbury, MA.