The potential release of pollutants during the dredging process has in recent years come under the scrunity of
federal and state agencies. A simple laboratory test and mathematical model were sought to predict the concentration of contaminants released at the point of a dredging process.
This research investigates the effect of initial suspended solids (SS) concentration, mixing time, and
settling time in a 4-L graduate cylinder on the final water column concentrations of SS, PCBs, and selected metals (Cu, Pb, and Cd). The objective was to determine the conditions that could best simulate the actual contaminant
concentrations measured in a pilot dredging operation of New
Bedford Harbor.
Results indicate that most of the PCBs found in the column after settling were sorbed onto suspended particles rather than dissolved. Aeration time had little effect on final SS or PCB concentration. Settling time had the most influence of the test parameters on SS and PCBs but beyond 1 hour, the effect was minimal. Analysis of settling rate
indicated that flocculent rather than discrete settling
occurred.
From a matrix of laboratory testing using initial SS, aeration time, and settling time as variables, a non-linear
regression model was used to predict final SS concentrations
partitioning model. Particle size distributions (PSD)
analyses were analyzed (Coulter Counter) on solids remaining
in the laboratory column for various combinations of
experimental conditions.
PCB and SS concentrations obtained in New Bedford
Harbor from the ports of the dredgehead and from the plume
were compared to those found in the laboratory test. In
general, the field and laboratory data were within one order
of magnitude. However, the scatter in field data was
considerable and this must be included in any analysis of
predictive capability of a simple laboratory test and
mathematical model.
Finally, if sorbed PCB concentrations, initial
suspended solids, and settling time are measured, then the
total, particulate, and soluble PCBs in the water column can
be predicted without elutriate tests by using the simple
equilibrium partitioning model and the non-linear regression
I would like to thank Dr. Francis A. DiGiano and Dr.
Cass T. Miller for their personnel interest, guidance, and counsel during my study at Environmental Sciences and
Engineering. I am also grateful to Dr. M. Judith Charles for her positive criticism and support during the preparation of this report.
I especially appreciate my parents, my wife. Dr. Kang, Taehyeung for their spiritual aid in preparing this report.
I also would like to thank Luci Sonnenberg, Vanessa
Manuel, Andy Szakowski, Kerry Kelly, Alex Mayer, Chris Hull, Kathy Miller, and all other colleges at Environmental
Sciences and Engineering for their laboratory assistance, helpful discussion, writing, and proofreading.
TABLE OF CONTENTS
ACKNOWLEDGEMENTS...i
TABLE OF CONTENTS...ii
LIST OF TABLES...V LIST OF FIGURES...viii
1. INTRODUCTION ...1
1.1 Background ...1
1.2 Obj ectives ...3
2. LITERATURE REVIEW...4
2.1 Motivation for Development of Elutriate Tests ...4
2.2 Review of Elutriate Test Development...7
2.3 Importance of Resuspended Solids during Dredging Operations...14
2 .4 Other Uses of Elutriate Tests ...17
3 . METHODS ...20
3.1 Parameters for Investigation in the DRET ..20
3 .2 Site and Field Test ...22
3.3 Analytical Methods ...24
3.3.1 Analysis of PCBs ...24
3.3.1.1 PCBs Analysis of Aqueous Samples ...25
3.3.1.2 PCBs Analysis on Filter (Sorbed PCBs) ...25
Electron Capture Detector ...26
3.3.1.5 PCB Calibration and Quantification ...27
3.3.2 Analysis of Metals ...28
3.4 Measurement of Suspended Solids and Particle Size ...31
3.4.1 Gravimetric Method ...31
3.4.2 Particle Size Distribution Analyzer Method.31 3 .5 Particle Sizing ...33
4. RESULTS 2^D DISCUSSION...34
4.1 Quantification of PCBs Concentration...34
4.2 Comparison of Liquid-Liquid Extraction to Soxhlet Extraction ...37
4.3 Sediment and Water Characteristics ...39
4.4 Volatilization of PCBs during the DRET ....39
4.5 Elutriate Test ...41
4.5.1 Suspended Solids and PCBs Concentration ...41
4.5.2 Usefulness of Simple Equilibrium Partition Model ...54
4.5.3 Comparison of the Soluble PCBs with Previous Studies...55
4.5.4 Release of Metals (Cu, Pb, Cd) in the DRET.57 4 . 6 Field Data from New Bedford Harbor ...59
4.6.1 PCBs and SS Data ...61
4.6.2 Metals Data ...70
4.8 Prediction of Suspended Solids in DRET.... 85
4.8.1 Three Factor Matrix Experiments ...85
4.8.2 Correlation of Final SS with DRET Conditions...88
4.9 Particle Size Distribution ...96
4.9.1 Log-normal Distribution...96
4.9.2 Power Law Distribution...103
4.10 Settling Characteristics ...Ill 4.11 Distribution of Sorbed PCBs with Particle Size ...120
4.12 Implication of the DRET for Prediction of
PCBs ...1255. CONCLUSIONS AND RECOMMENDATIONS ...128
5.1 Conclusions...128
5.2 Recommendations...130
6. REFERENCES ...132
•
2.1 Dredged Material Disposal Criteria (Jensen
Criteria) Developed for FWQA\EPA (Boyd et al. ,1972)...6
2.2 Ability to predict suspended solids (SS)
concentration with Modified Elutriate Test
after Palermo and Thackston (1988b)...10
2.3 Summary of elutriatetest procedures...12
3.1 Metal analysis conditions by graphite
furnace atomic absorption spectroscopy...30
4.1 Validation of sediment PCBs (ug/g dry wt) quantification method by COMSTAR for
replicate sample...35
4.2 Comparison of sorbed PCBs on sediment as
determined by soxhlet extraction and
liquid-liquid extraction for replicate
samples...38
4.3 The characteristics of sediment and water from New Bedford Harbor...40
4.4 Summary of PCBs data from Dredging Elutriate
Tests...42
4.5 PCBs data from Dredging Elutriate Tests
(Aroclor 1242, Aroclor 1254)...45
4.6 Summary of predicted PCBs concentration of Dredging Elutriate Tests...47 4.7 Compositions of Aroclor 1242 and 1254 (wt %)
(Onuska, 1983)...49
4.8 Octanol/water partition coefficient (Kow) of PCB homologous group (Erickson, 1986)...50
4.9 Comparisons of soluble PCBs concentration of elutriate tests in the previous dredging research...56
4.10 Summary of metals (Cu, Pb, and Cd) data
pilot study...62
4.12 Summary of individual PCBs data from New
Bedford Harbor pilot study (Dredgehead
sample)...63
4.13 Summary of individual PCBs data from New
Bedford Harbor pilot study (Plume sample)..65
4.14 Summary of New Bedford Harbor field PCBs data
(Aroclor 1242, Aroclor 1254)...69
4.15 Summary of Cu, Pb, and Cd data from New Bedford Harbor pilot study (Dredgehead
sample)...71 4.16 Comparison of DRET data to Cutterhead Field
data...77
4.17 Comparison of DRET data to Horizontal Auger
Field data ...78
4.18 Comparison of DRET data to Matchbox Field
data...78
4.19 Final suspended solids concentration (mg/L)
with respect to initial suspended solids, aeration time, for settling time of 1 hr...87
4.20 Final suspended solids concentration (mg/L)
with respect to initial suspended solids
and settling time, for aeration time of
1 hr and 12 hr...89 4.21 Parameter Estimation Results ...94
4.22 Medians(djg) and geometric standard
deviations (GSD) as a function of settling time, for an initial suspended solids
concentration of 0.5 g/L and for an
aeration time of 1 hr...100
4.23 Medians(dgg) and geometric standard
deviations (GSD) as a function of initial
suspended solids concentration, for an aeration time of 3 hr and a settling time
of 1 hr...105
4.24 Medians(djp) and geometric standard
deviations (GSD) as a function of aeration time, for an initial suspended solids
time of 1 hr...106
4.25 Power-law distribution factor analysis
( n(dp) = A*dp' *)...Ill
LIST OF FIGURES
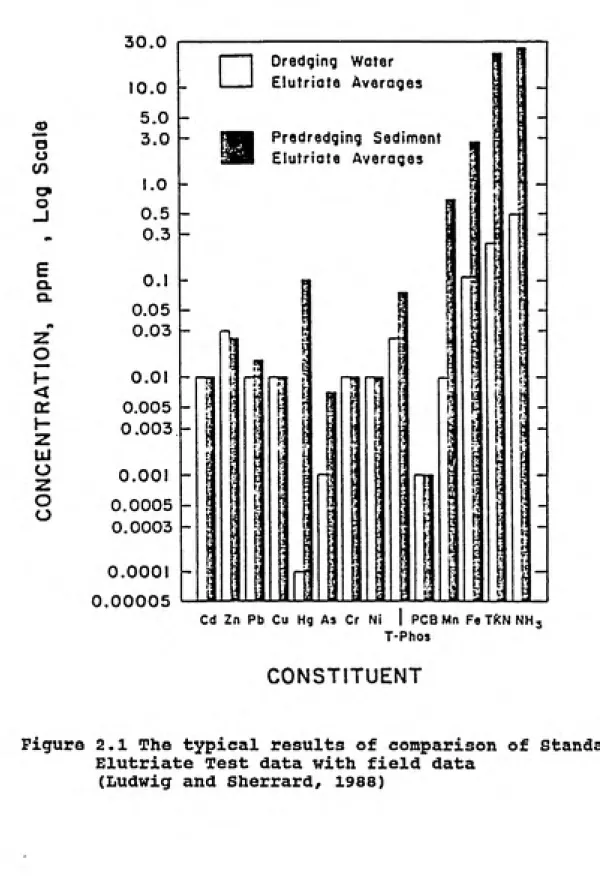
2.1 The typical results of comparison of Standard
Elutriate Test data with field data
(Ludwig and Sherrard, 1988)...13 2.2 The typical resuspended sediment levels from
cutterhead operations (Savanah River)(Havis,
1988)...15
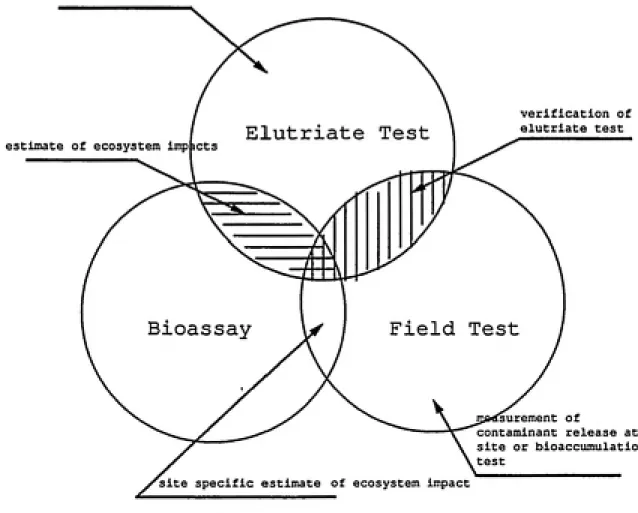
2.3 Relationship among DRET, bioassay, and field
measurement approaches...19
3.1 The major elements of the Dredging Elutriate
Test...21
3.2 The map of New Bedford Harbor...23
3.3 The GC chromatogram of Standard of Aroclor 1242 (a) and 1254 (b)...29
3.4 Diagram of PSD analyzer...32 4.1 GC chromatogram of PCBs of sediment PCBs (a) and
standard Aroclor mixture of 1242 and 1254
(b)...36
4.2 Comparison of soluble PCBs with predicted
soluble PCBs...52 4.3 Comparison of total PCBs with predicted total
PCBs...53 4.4 Plume Sample Locations (Cutterhead, Horizontal
Auger, and Matchbox work area)...60
4.5 Comparison of sorbed PCBs with different
dredgeheads (Dredgehead sample)...67 4.6 Comparison of sorbed PCBs with different
dredgeheads (Plume sample)...68
4.7 Comparison of sorbed Cu with different
dredgeheads (Dredgehead sample)...73 4.8 Comparison of sorbed Pb with different
dredgeheads (Dredgehead sample)...74 4.9 Comparison of sorbed Cd with different
4.10 Comparison of total and dissolved PCBs from the Dredging Elutriate Test (DRET) with those
from the Standard Elutriate Test (SET) and dredgehead sampling in New Bedford Harbor
pilot study (Cutterhead=CH, Horizontal Auger=HA,
and Matchbox=MB)...81
4.11 Comparison of total and dissolved PCBs from the Dredging Elutriate Test (DRET) with those
from the Standard Elutriate Test (SET) and plume sampling in New Bedford Harbor pilot study (Cutterhead=CH, Horizontal Auger=HA,
and Matchbox=MB)...82
4.12 The relationship between total PCBs and SS for the DRET and field data (One suspected
value from Matchbox (SS^ = 32 mg/L,
total PCBs = 49.4 ug/L) was not included)...84
4.13 Comparison of SS^ measurement by gravimetric
method to SS^ measurement by PSD method...91
4.14 The change in final suspended solidsconcentration (SS^) as a function of settling
time for an aeration time of 1 hr...924.15 The change of the final suspended solids
concentration (SSJ with respect to initial
suspended solids (SS^) and settling time(tg)..95
4.16 The change in particle size distribution and
final suspended solids concentration (SS^)
as a function of settling time (t^) , for an
initial suspended solids concentration of
0.5 g/L and for an aeration time of l hr...97 4.17 The change in log normal particle size
distribution and final suspended solids
concentration (SS^) as a function of settling
time (tg) , for an initial suspended solids
concentration of 0.5 g/L and for an aeration time of 1 hr...99
4.18 The change in particle size distribution and
final suspended solids concentration (SS^)
as a function of initial suspended solids concentration (SS-) , for an aeration time of 3 hr and for a settling time of 1 hr...102
4.19 The change in particle size distribution and
final suspended solids concentration (SS^)
for a settling time of 1 hr...104 4.21 Cumulative particle size distribution (n(dp)
is a particle size distribution)...107 4.22 Effects of particle size distribution function
on number (----) , surface (___ _ ___) and volume(_______) distributions (size interval
0.3 to 30 um, particle concentration = 132 mg/L,
and particle density = 2.65 ug/cm^)...109
4.23 The power - law distribution analysis as a
function of settling time ( t^ ) , for an
initial suspended solids concentration of
0.5 g/L and an aeration time of 1 hr...110 4.24 Suspended solids concentrations as a function
of a settling time for an initial suspended
solids of 0.5 g/L and for an aeration of 1 hr.115
4.25 Suspended solids concentrations as a function of a settling time for an initial suspended
solids of 10 g/L and for an aeration of 1 hr..ll6 4.26 The comparison of experimental particle
settling data to Stoke's Law prediction for
an aeration time of 1 hr...117
4.27 Log average settling velocity distributions for
aeration of 1 hr...119
4.28 Particle size number distribution before and
after particle sizing...122
4.29 Particle size volume distribution before and
1.1 Background
Dredging is a process by which sediments are removed
from the bottom of a streams, lakes and coastal waters,
transported via ship, barge or pipeline, and discharged to
land or water. Each year, approximately 4 00 million yd^ of
sediment are dredged from US waterways in order to maintain shipping channels (Lee, 1976). In many instances,
contaminants are sorbed onto these dredged materials. PCBs (polychlorinated biphenyls) laden sediments found in New
Bedford Harbor, Massachusetts and in the Hudson River, New
York have been well-publicized in the news media.
The problem facing environmental engineers is how to predict the release of sorbed contaminants from dredged materials. Up until recently, concern was limited to
pollution at the point of disposal either in open water or confined areas. A simple laboratory test was derived to contact water and dredged material in a manner that would simulate the conditions of contaminant release expected in the field. This became known as the "elutriate test."
However, the possibility that pollution also exists at the point of dredging, where contaminated sediment is
resuspended in the water column by the action of dredgehead.
term "Dredging Elutriate Test" or DRET has been adopted to distinguish it from previously developed elutriate tests used in predicting contaminant release at the point of
disposal.
The Standard Elutriate Test (SET) was
originally-developed to compare the chemical analysis of the elutriate from a sediment/water mixture to a similar analysis of the open water disposal site water. The test was modified by Palermo and Thackston (1988a) to predict the concentrations of chemicals in confined disposal area. Of concern were adjustments to agitation - oxidation conditions, sediment concentration and settling time that would best simulate field conditions in a simple laboratory experiment. Even though they measured suspended solids and concentrations of contaminants in each phase, their discussion did not
emphasize that most contaminants were associated with SS. To date, only the SET has been used to predict the soluble
contaminants concentrations released at the point of dredging (Ludwig and Sherrard, 1988) . Havis (1988) noted from investigations of four field sites that the
in the test suggested the need for more study. This study
was carried out along with a field study by New England
Division of US Army of Corps Engineers in New Bedford Harbor
to develop and verify the elutriate test at the point of
dredging.
1.2 Objectives
The overall objectives of this research are:
1. To use existing elutriate tests as a starting point for
laboratory research on the key factors affecting release
of contaminants, namely initial solids concentration, aeration time, and settling time with the intent of
recommending a suitable DRET.
2. To compare results of laboratory elutriate tests to field
data collected by the Corps of Engineers at the New
Bedford Harbor dredging site using three different dredgeheads.
3. To investigate in detail the characteristics of the
resuspended solids i.e., the settling characteristics,
particle size distribution and contaminant load as
2.1 Motivation for Development of Elutriate Tests
The authority of the Department of the Army to regulate dredging and dredged material disposal is based on the
Rivers and Harbors Act of 1890. (Engler, 1980). The US Army
Corps of Engineers limited its jurisdiction to the
protection of navigation and limited its review of proposed activities to only those effects. Prior to about 1970, the dredged sediments were disposed of in the most economic manner, in nearby land or waterways. In the late 1960's, however, state and federal pollution control agencies became increasingly concerned about the disposal of dredged
material, and particularly the release of contaminants from sediments. In the late 1960s', the US Army Corps of
Engineers enlarged the scope of the review of permit applications to include fish and wildlife, conservation, pollution, esthetics, ecology and the general public interest (Engler, 1980).
The earliest guidelines or criteria proposed for
dredged material were promulgated in 1971 by FWQA (Federal Water Quality Administration, predecessor of EPA) called
"the Jensen Criteria" (Lee et al., 1976). Seven chemical
grease, mercury, lead, and zinc (Table 2.1). When the
concentration of above items in the dredged material exceeds the given concentration of Jensen Criteria, the alternative disposal should be considered instead of open water
disposal. The adoption of Jensen Criteria generated
considerable controversy about the appropriateness of the use of bulk criteria as a tool to minimize the adverse environmental impact of chemical contaminants associated with dredged sediment disposal. Those criteria merely
account for the presence of contaminants in sediments and do not measure the potential biological availability or
chemical release during the dredging and disposal operations (Lee et al., 1975). To implement a technically valid
approach for assessing the environmental significance of chemical contaminants in dredged sediment upon open water disposal, the US EPA and US Army Corps Engineers developed the SET (EPA Standard Elutriate Test, 1973).
In March 1975, the US District Court for the District
Parameter Maximum Percent Dry Weight
Volatile Solids
Chemical Oxygen Demand Total Kjeldahl Nitrogen
Oil and Grease
Mercury
Lead Zinc
6.0 5.0 0.10 0.0001 0.005 0.005 0.005
Corps to issue permits, under criteria established by the
EPA, for transport of dredged material for dumping in ocean
waters.
2.2 Review of Elutriate Test Development
Two elutriate tests have been developed so far by the
research contracts of the US Army Corps Engineers. The first
of these is referred to as the Standard Elutriate Test (SET) which is used to predict the release of contaminants at the point of open water disposal operation. The Modified
Elutriate Test (MET) followed to predict the release of contaminants at the point of confined dredged material
disposal areas.
The criteria (Palermo, 1986) used to develop EPA-SET
were that:
1) the test should be based on the best available knowledge;
2) the test methodology should not be beyond the current
state of the art;
3) routine testing laboratories should be capable of performing the test procedure; and
4) the cost for testing should not be prohibitively
expensive.
The SET consists of preparing 1:4 (volume basis)
•
water in a tightly sealed container, shaking it mechanically
for thirty minutes, allowing it to settle for 1 h, then
obtaining the elutriate via centrifugation or filtration of
the supernatant through 0.45 um filter. If major
contaminants are 1.5 times more concentrated in the water after it has been mixed with sediment than it was
previously, the sediment is considered to be polluted. The classification of "major contaminants" includes
organohalogens and several heavy metals. Further laboratory
investigation pointed out that oxygen status and sediment:liquid ratio during the test were the most
important factors influencing test results.
The problem encountered in the SET is excessive release
of contaminants due to anoxic conditions that would not be encountered in the field. The failure to properly define the
redox conditions during the elutriate tests resulted in the
production of a large amounts of essentially meaningless
elutriate test data across the US (Jones and Lee, 1978). The EPA-SET was modified by using compressed air agitation
rather than mechanical mixing to specify the redox potential
under which the test was conducted (Modified SET, 1977).
Jones and Lee (1978) concluded that the Modified SET was potentially useful for evaluating the short term release of contaminants from dredged material discharged into open
water.
disposal was used instead, even though the environmental impact of confined disposal of contaminated dredged material
may be more severe than for open water disposal (Jones and
Lee 1978; Gambrell et al., 1978). The Modified Elutriate
Test (MET) was developed to predict the release of
contaminants at the point of confined dredged material
disposal. The MET consists of preparing the expected average field influent concentration (or 150 ug/L (dry-weight basis) if no other data is available) by mixing the sediment and dredging site water, aerating by compressed air for 1 h, settling for up to 24 h maximum, then determining SS and
dissolved and total concentrations of desired analytes.
To illustrate the predictive capability, the suspended solids data reported by Palermo and Thackston (1988b) are
summarized in Table 2.2. Two observations from Table 2.2 are
possible. First, despite the large initial slurry
concentration (57 - 152 g/L), the final SS in MET was very
low (10 - 85 mg/L). This suggests that most of the dredged
material settles fairly rapidly (within 24 h) leaving behind very small particles. In fact, the companion paper by
Palermo and Thackston (1988a) showed that SS declined very sharply during the first 24 h and furthermore that 90
percent of these supernatant sediment particles were less than 10 um in diameter. The second observation is that the
MET always produced lower SS than measured in the field.
Site Test Slurry Column SS Mean Field Concentration (mg/L) SS (mg/L)
(g/L)
Mobile 99 33 40
Savannah 142 85 75
Norfolk 122 20 202 (high wind)
3 5 (low wind)
Black Rock 57 84 173
adjustment factor (1.5-2.0) to account for non-quiescent conditions in the field. The authors were the first to
measure SS extensively but they did not emphasize that most
contaminants were adsorbed to the surface of the solid
rather than dissolved in solution. For this reason, the authors did not fully discuss the importance of settling
time and particle size distribution in minimizing the
environmental impacts that result from the re-suspension of
SS in confined disposal. A summary of experimental
conditions used in the EPA-SET, Modified SET, and MET is
provided in Table 2.3.
The potential release of contaminants at the point of
the dredging process has, in recent years, come under
scrunity of federal and state regulatory agencies (Ludwig
and Sherrard, 1988). During the early stage of theImprovement of Operations and Maintenance (lOMT) research program, researchers thought that the processes involved at
the point of dredging were similar to those involved with
open water disposal of dredged material. The SET has been
applied to the point of dredging operations under theWaterways Experiment Station (WES) - lOMT research program (Ludwig et al., 1989). This approach has met with limited
success. Figure 2.1 shows the comparison of typical results
between SET data and field data at the point of dredging-Results showed that release could be predicted within an order of magnitude. But generally, more release wasType Standard'a Modified Standard Modified'^
Sediment Loading 1:4 sediment/water ratio 1:4 sediment/water ratio 150 g/L, or expected
influent concentration
Aeration time (min)
30 30 60
Aeration Method Mechanical shaking Compressed air Compressed air
Settling time (hr)
expected mean retention time up to 24 hr maximum
Concern of
Suspended Solid
yes
Date 1973 1977 1986
a. Ludwig and Sherrard (1988) b. Jones and Lee (1978)
c. Palermo and Thackston (1988a)
o o
en o» o -J
B
Q. O.
<
z UJ o z o o
30.0
10.0
Dredging Water
Elutriate Averages
Predredging Sediment
Elutriate Averages
0.05 0.03
™
0.005 0.003
O.OOI h 0.0005 0.0003
0.000 0.00005
Cd Zn Pb Cu Hg As Cr Ni I PCBMn Fe TfCN NH, T-Phos
CONSTITUENT
Figure 2.1 The typical results of comparison of Standard
Elutriate Test data with field data
contaminants in the water column were particle associated, SS and particulate contaminants were not measured.
2.3 Importance of Resuspended Solids during Dredging
Operations
The differences among SET, MET, and DRET are especially critical with regard to solid-water ratio. The SET has been developed to deal with open water disposal operations
including dredging operations and the 1:4 sediment/water ratio in the SET is based on the optimum hydraulic pumping
ratio. The MET was developed to predict the release of
contaminants at the point of confined dredged material disposal areas. It was recommended that the sediment and dredging site water should be mixed to approximately equal the expected average influent concentration (or 150 g/L if no data are available) should be used. In contrast the DRET should simulate the solids concentration at the point of dredging. Therefore, the field condition may be different, especially for the amount of suspended solids.Based on available data, the maximum suspended solids concentrations (mass of dry solids/volume of water) at the point of dredging is usually less than 10,000 mg/L (Havis,
1987). This translates roughly to a solids -to- water volume ratio of just 1:200 instead of the 1:4 recommended in the
- £
O o Q Z
300
r-200 h
100 h
^'OOLE ^ UPPER
400 800 1200 1600 DISTANCE FROM DREDGE, FT
Figure 2.2 The typical resuspended sediment levels from
cutterhead operations (Savanah River)
sediments level from cutterhead dredge (Havis, 1988).
Contaminants may be released in soluble form directly to the water column, or they may remain adsorbed to the fine resuspended sediment particles. Most researchers have
emphasized that the primary mode of environmental impact was
from the soluble fraction since dissolved forms of
contaminants are more available for aquatic biota uptake than those that remain adsorbed to sediment particles (Chen et al., 1976). Turbidity and suspended solids associated with dredged material were judged to have an insignificant effect on dredged material disposal on water quality.
Therefore, the Dredged Material Research Program (DMRP) has not paid much attention to the suspended particles remaining during dredging and disposal processes.
Suspended materials may be a more important source of contamination than once thought. Trace metals and
chlorinated hydrocarbons associated with suspended particles may pose some problems due to the biological uptake. It was reported that Fiddler crabs accumulate PCBs from
contaminated sediment (Nimmo et al., 1971) and detritus (Marinucci and Bartha, 1982) and can transfer them to
aquatic, avian, and terrestrial food webs when preyed upon by fishes, birds, and small mammals (Montague, 1980).
Laboratory and field studies of bioaccumulation, toxicity,
and food-chain transfer of chemical bound to sediment have
Hayes et al.(1987) emphasized the environmental impact
of the re-suspension of sediment associated with
contaminants and investigated the range and concentrations of sediment plumes in the field studies of selected dredging equipment. As the fined-grained particles are resuspended,
contaminants attached to the particles can be transported to
the receiving waters. The ecological significance of these particles are not yet well-defined. Since the suspended solids remaining during dredging is the potential source of spreading of contaminants, it is necessary to monitor and reduce suspended solids to minimize potential effects to the environment.
2.4 Other Uses of Elutriate Tests
Most elutriate tests merely indicate how much
contaminants would be released during dredging and disposal operation, but do not specify the amount of damage caused in the exposed dredging ecosystem. In other words, the
environmental impacts of dredging on the ecosystem cannot be determined from the elutriate test alone; this only simulate the release of contaminants during dredging and not the
effect on the aquatic biota. A bioassay test is needed to determine the impact on the ecosystem properly. Furthermore, the elutriate tests appear to give conservative estimates of
the contaminants release (Jones and Lee., 1978) . If this is
the contaminant concentrations for bioassay work. The
estimate of contaminant relase
estimate of ecosystem impi
verification of
elutriate test
urement of
contaminant release at
site or bioaccumulation
test
site specific estimate of ecosystem impact
Figure 2.3 Relationship among DRET, bioassay,
3. METHODS
3.1. Parameters for investigation in the DRET
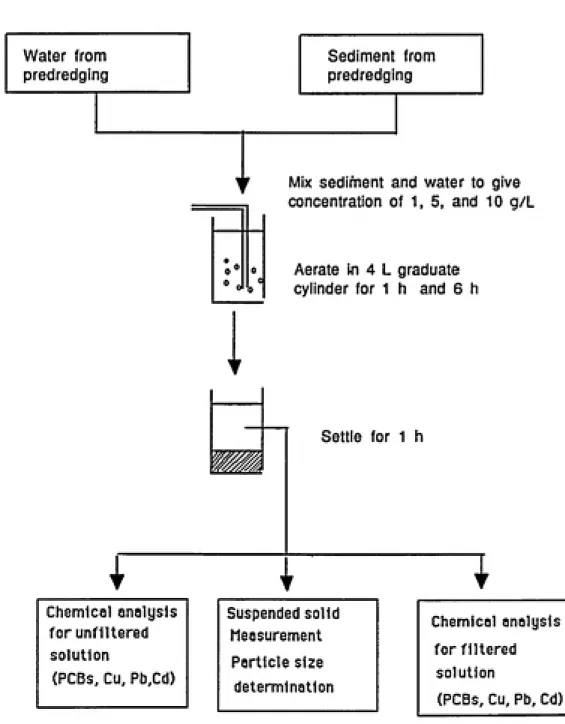
Figure 3.1 depicts the major elements of the DRET. The
general scheme was based on the findings of Palermo (1986).
Tests were conducted in 4 L graduated cylinders equipped with a magnetic stir bar for mixing and a diffuser for
aeration. Air was bubbled through the solution at a flow
rate of 0.5 ftVhr (0.47 L/min) . Water and sediment
representative of pre-dredged conditions were obtained from
the field site at New Bedford Harbor to conduct the test.
Palermo (1986) developed the MET under the confined disposal
field experiment that solid/water ratio were about 150 g/L
or the expected influent concentration. However, field data
(Havis, 1987) at the point of dredging indicated that solid concentration was much lower. For this reason, the following three solids concentrations were tried; 10 g/L, 5 g/L, and 1
g/L-The water and sediment were added to the graduated
cylinder in the appropriate volume to give initial suspended
solids (SS) concentrations of 1 g/L, 5 g/L or 10 g/L. The
mixture was aerated for either 1 h or 6 h and settled for 1
h. An aeration time of 1 h was based on that in previous
research in confined disposal operation (Palermo, 1986). A
Water from
predredging
Sediment from
predredging
Mix sediment and water to give concentration of 1, 5, and 10 g/L
Aerate tn 4 L graduate cylinder for 1 h and 6 h
1
J
Settle for 1 h
^
Chemical analysis
for unfiltered solution
(PCBs, Cu, Pb,Cd)
Suspended solid
Measurement Particle size determination
Chemical analysis
for filtered solution
(PCBs, Cu, Pb, Cd)
of PCBs and metals (Cu, Cd, Pb). For analysis of soluble and suspended PCBs, the sample was split into two, 1-L samples. The remaining was used for analysis of metals (both soluble and suspended), SS, and particle size distribution (PSD). Based on preliminary elutriate tests, it became clear that the contaminants and nature of SS remaining in the water was very important because most of the contaminants were sorbed
rather than soluble.
A series of elutriate tests were conducted to determine
in more detail the effect of initial SS, aeration time, and settling time on final suspended solids and PSD. For these tests, artificial sea water was prepared by mixing Instant Ocean (commercial name) with distilled water. This was
necessary because the volume of sea water needed for these
tests was greater than shipped from New Bedford Harbor. Four different amounts of initial SS (0.5, 1, 5, 10 g/L) were tested using four different aeration times (1, 3, 6, 12 h) and different settling times (1, 6, 12, 24 h). The objective of these elutriate tests was to determine if final SS could be estimated based on elutriate conditions.
3.2 Site and Field Test
New Bedford Harbor, as shown in Figure 3.2 is located
in Bristol County, Massachusetts, about 50 miles south of
Boston and approximately 3 0 miles southeast of Providence,
=—-.Vooa St. Bridge
i\ BrooMawn P
Quames
m
;SNdftti
Fairhaven
RT=195=
m
Caqgesnall St. Bridge RT==195
Fairhaven
Fairhaven
Island
Island Island
!T\^______„. ilNewBedfqr
New Bedford Harbor
contaminated with polychlorinated biphenyls (PCBs) and heavy metals to the extent that the site is being studied by the EPA under the Federal Superfund program. PCB contamination in sediment of New Bedford harbor ranges from a few parts per million to over 100,000 ppm (Weaver, 1983). The water column in New Bedford Harbor has been measured to contain PCBs in parts per billion range.
The U.S. Army Engineers, Division of New England (NED) provided analyses of suspended solids, metals, and PCBs during pilot dredging operations to compare the results of laboratory data. The following three dredgehead were used during dredging operation: cutterhead, horizontal auger, and
matchbox. These field tests were conducted in November 1988,
December 1988,and January 1989 (U.S. Army Corps of
Engineers, NED, 1989).
3.3 Analytical Methods
3.3.1. Analysis of PCBs
One of the main objectives in this research was to compare laboratory data with field data for developing DRET. Therefore, all procedures for analyses and quantification of
PCBs and metals were adopted from those used by the US-EPA
were nitrogen carrier gas instead of helium gas in GC analysis and hexane extraction solvent instead of freon
(Trichlorotrifluoroethane). Chromerge (chromic/sulfuric
acid) was used to clean all glassware involved in the
measurement of PCBs.
3.3.1.1 PCBs Analysis of Acrueous Samples (Filtered PCBs and Unfiltered PCBs )
Two, 1-L aliquots were taken from the 3-L sample
siphoned from the graduated cylinder for PCB analyses; one
aliquot was passed through 0.45-um glass fiber filter. The
filtered and unfiltered aliquots were spiked with about 1.4
ug of octachlonaphthalene (OCN) and refrigerated in brown glass bottles with Teflon-lined caps until extraction(within 24 h). The water samples came from New Bedford Harbor pre-dredged condition. The unfiltered solution and filtered solution in the DRET were extracted three times with 65 mL of high-purity hexane. Water was removed by addition of sodium sulfate and concentrated to 1 or 2 mL
with a Kuderna Danish apparatus.
3.3.1.2. PCBs Analysis on Filter (Sorbed PCBs)
the filter. The vial was shaken manually for a few minutes and the solvent was allowed to remain in contact with the
solids overnight. Water was removed by addition of sodium sulfate, after which the extract was transferred to an 80-mL micro Kundera Danish apparatus for concentration to 1 or
2-mL.
3.3.1.3 PCBs Analysis of Sediment
The concentration of PCBs on New Bedford Harbor
sediment were analyzed by removing 1 or 2 g subsample from the sample provided, spiking with an internal standard
(OCN), covering with acetone, extracting with hexane for overnight (Soxhlet), drying with sodium sulfate, and concentrating to 1-mL. The 1-mL extract was then treated with mercury, a 50% solution of sodium hydroxide (1 time) and a 50% solution of sulfuric acid (3 times).
3.3.1.4 Gas Chromatography (capillary column) / Electron Capture Detector Analysis
All GC-ECD analyses (PCBs) were performed with a
Hewlett-Packard Model 5890A, equipped with split/splitless,
auto injection systems, and a standard Ni^^ electron capture
detector. The GC/ECD conditions used in this work were as follow:
0.25-mm ID
2. Nitrogen gas for carrier gas and make-up gas at approximately 1.5, 45 mL/min respectively
3. 275 °C injection temperature and 325 °C detector
temperature4. 6.0 °C/min ramp rate
3.3.1.5 PCB Calibration and Quantification
Quantification of PCBs is not simple because the analyte is not a single compound but rather a complex
mixture of 209 possible congeners. In addition, standards of all 209 congeners are not readily available for calibration. The applicability of the different quantification techniques depends on the analytical technique, the PCB concentrations, the consistency of the PCB pattern within a sample set, and the analytical objectives (Erickson, 1986). Quantification against an Aroclor standard by the area of selected peaks may be appropriate, if the PCB pattern closely resembles that of commercial Aroclor mixtures. Since one of the
objectives of this research was to compare the laboratory data to field data, the quantification method was based on the method used by the EPA laboratory in Narragansett.
Internal standard (OCN) was added to the sample immediately prior to the extraction procedure, and analytes were
solution were prepared with an approximate 1:1 ratio of
Aroclor 1242 to 1254 and were used to establish a multi¬ point calibration curve. Four chromatographic peaks were selected for quantification: two diagnostic peaks for Aroclor 1242 and two diagnostic peaks for Aroclor 1254
(Figure 3.3). The rationale for choosing the diagnostic
peaks was that each peak of Aroclor should be differentiable and exclusive. The concentrations for each Aroclor were
calculated using the ratio of the analytes to internal
standard responses and the total reported.
3.3.2 Analysis of Metals
All glassware and polyethylene bottles used in this metal analysis was soaked in nitric acid, rinsed with
deionized water and dried. Sea water is difficult to analyze
because of the matrix effect of salt. The matrix is atomized
along with the analyte and the background signal overwhelms the signal of sample (Slavin et al., 1982). Sample are
pretreated to remove this interference. But the pretreatment process is time consuming and can lead to sample
contamination (Slavin et al., 1983). In this work, the
method of direct determination using graphite furnace atomic absorption spectrometry with the stabilized temperature
NDO
-zxd zfrZT -T^!^
.lt-ll» ..J'rt*!'
NOO
-Ut't*
TXd Z^'ZT
-.«'i'-y, '
zyid frgzT
TXd frSZI
-tIi-«
ͣͣ
•-•ͣ" "^^^^
The analysis conditions appear in Table 3.1.
TaQsle 3.1 Metal analysis conditions by graphite furnace atomic absorption spectrometry
Wavelength Site Matrix Modifier'' Temperature (°C)
(nm) (mg) Pyrolysis Atomization
Cu 324.8 P^ 0.015 Pd + 0.01 MgCNOj) 1300 2500
Pb 283.3 P 0.2 PO^ +0.01 MgCNOj) 850 800
Cd 228.8 P 0.2 PO^ + 0.01 MgCNO,) 900 1600
a. platform graphite tube b. Schlemmer et al. (1986)
A 200-mL aliquot of settled water from the elutriate
test was passed through a 0.45-um polycarbonate filter to
analyze dissolved metals and a 50-mL aliquot was digested
with nitric acid to analyze the total metals. Detectionlimits for each metal (Cu, Pb, Cd) were 5 ug/L, 10 ug/L, and
3.4. Measurement of Suspended Solids and Particle Size
3.4.1 Gravimetric Method
The measurement of SS was performed using a 500-mL
aliquot according to Standard Methods for the Examination of
Water and Wastewater (APHA, 1981).
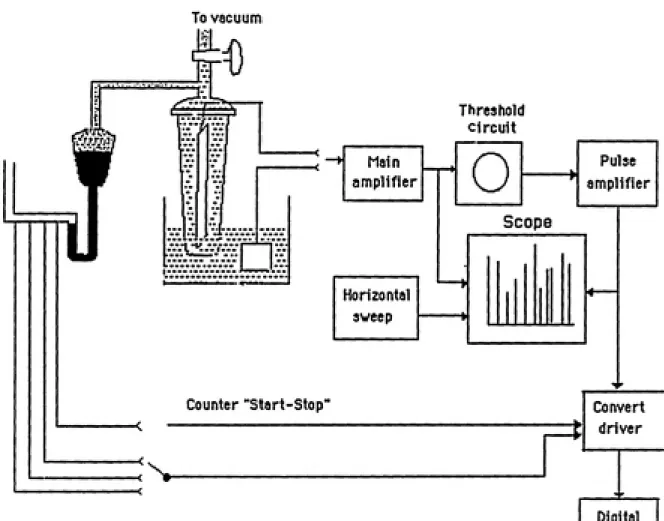
3.4.2 Particle Size Distribution Analyzer Method
The particle size distribution (PSD, Model 112 LSD/ADC-80XY) analyzer used in this research determines the number and size of particles in an electrically conductive liquid.
This is accomplished by forcing the suspension to flow
through a small aperture having an immersed electrode on either side (Allen, 1981)• As a particle passes through the aperture, it changes the resistance between the electrodes.
The changes in resistance is proportional to the volume of
the particles. The pulse are amplified, sized and counted. From the derived data, the particle size distribution can be
determined. A description of these compounds is provided in
Fig 3.4.
The reliability of particle size distribution
measurements of heterogeneous particulate suspensions is limited because of particle clogging of the sensor orifice
To vacuum
n
Threshold
circuit Main
amplifier
Horizontal sweep
Counter "Start-Stop"
:v
0
Pulse
amplifier
Scope
Convert driver
register
1981). Most of the particles in the sediment from New
Bedford Harbor were ranged below 2 0 um. Therefore, twoaperture tubes (30 um, 90 um) were used. Assuming spherical
particles, the total volume of suspended solids was
calculated by integrating the curve of particle size vs
number of particles. The mass of suspended solids was
calculated using a density of 2.3 g/cm^.
3.5. Particle Sizing
Particle sizing by several types of filters such as
membrane filter (2 um, 5 um, and 8 um), glass fiber filter
(5 um and 8 um), and nylon mesh (5 um and 10 um), was
attempted following the method of Day (1965). The objective
was to isolate enough of a given range of particle sizes to
perform analyses of sorbed PCBs; Palermo and Thackston
4. RESULTS AND DISCUSSION
4.1 Quantification of PCB Concentration
A common approach in peak identification is to compare the patterns produced by the sample with those produced by a mixture of commercial preparations such as Aroclor or
Clophen. The PCB contents of samples are often expressed in terms of Aroclor or Clophen. In some cases degradation and metabolism of selected compounds have caused dissimilarities and can lead to erroneous conclusions. Burkhard (1987)
reported on COMSTAR (Complex Mixture Statistical Reduction) which is a method for the analysis of PCBs using regression analysis with outlier checking and elimination. This program sums the distribution of congeners in the Aroclor so as to create a complex mixture that resembles the sample and then determines the concentration of PCBs in the sample by
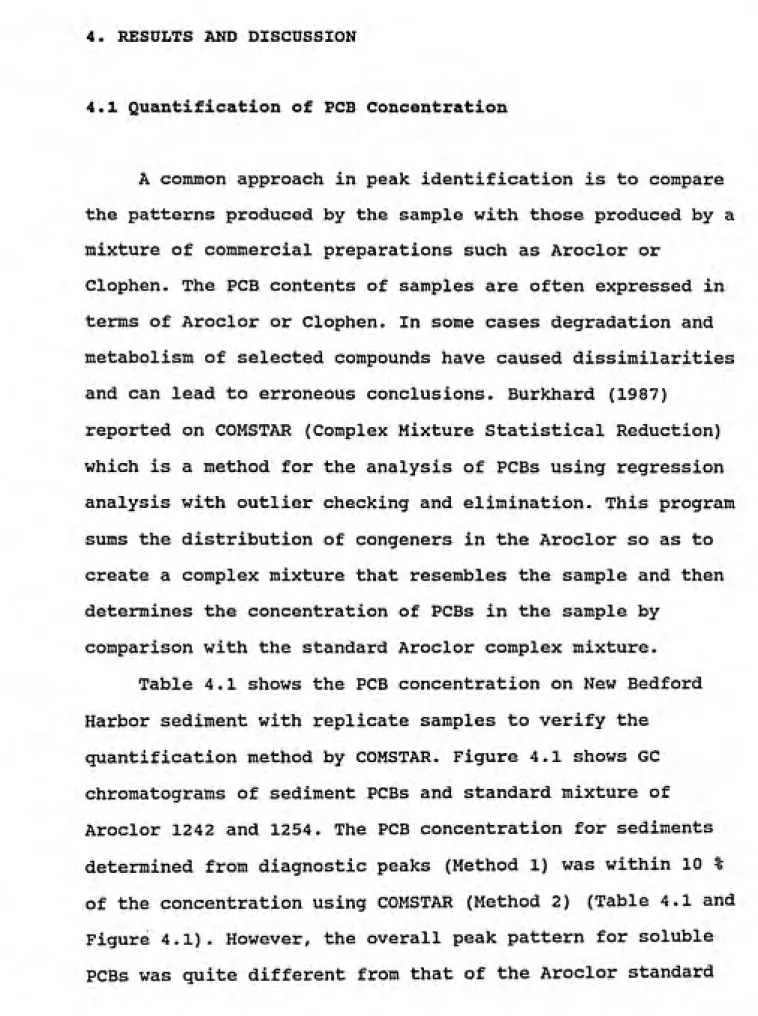
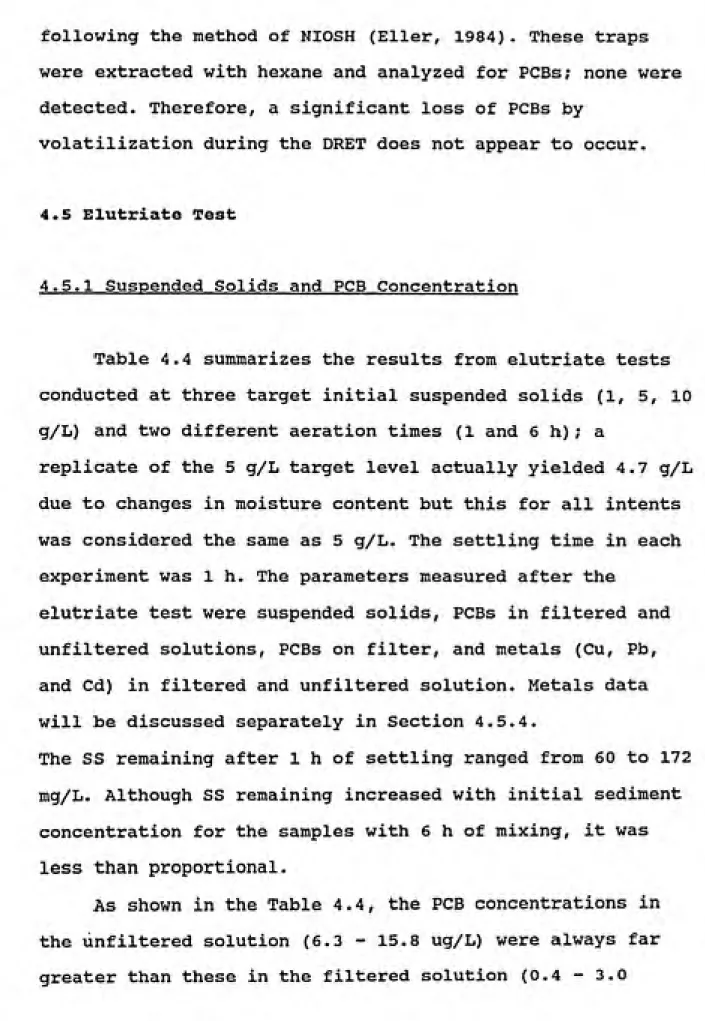
comparison with the standard Aroclor complex mixture. Table 4.1 shows the PCB concentration on New Bedford
Harbor sediment with replicate samples to verify the
quantification method by COMSTAR. Figure 4.1 shows GC
chromatograms of sediment PCBs and standard mixture ofAroclor 1242 and 1254. The PCB concentration for sediments
Sample Method 1^ Method 2^
A 160 158
(r^ = .934)
B 173 189
(r*^ = .935)
iLLJ
Kit c
[m
Figure 4.1 GC chromatogreuas of sediemt PCBs
and standard Aroclor mixture of 1242 and 1254 (b)
mixture so that the quantification method by the diagnostic
peak is not recommended. The concentration of soluble PCBs
might be best determined by calculation of concentrations of
individual congeners. The calculation method of this
congener-specific PCB concentrations, however, was not used
for this study due to time and cost restraints and the factthat knowledge of individual PCBs was not important in this
study.
4.2 Comparison of Liquid-Liquid Extraction to Soxhlet
Extraction
Liquid-liquid extraction was used to measure PCB
concentrations in suspended solids remaining in the DRET,
while Soxhlet extraction was used to measure PCBs in bulk
sediment. The two methods were compared for replicate
samples to determine whether they yield the same results.
The results in Table 4.2 indicated that the Soxhlet
extraction method yielded a higher estimate of PCB
concentrations than the liquid-liquid extraction method,
which was used for later data analysis of the partitioning
of sediment PCB during the elutriate test. This was done to
maintain consistency in laboratory methods since
liquid-liquid extraction was used for sorbed and soluble PCBs
replicate samples
Soxhlet Extraction Liquid-Liquid Extraction Method Sample Concentration Sample Concentration
(ug/g dry wt) (ug/g dry wt)
1 242 1 160
2 226 2 173
avg 234 avg 167
CO
4.3 Sediment and Water Characteristics
-The characteristics of the sediment and water samples
from New Bedford Harbor were determined before the DRET was
performed. The results of these analyses appear in Table
4.3. This measurements provided background level
concentration for PCBs, Cu, Pb, and Cd. The moisture content
was needed to calculate the initial SS added to initiate an
elutriate test and the specific gravity was needed to
calculate the final SS at the end of the elutriate test by
the PSD analyzer method.
4.4 Volatilization of PCBs during the DRET
PCBs have been reported in air as well as in soil,
water, sediments, and human tissue. PCBs are semi-volatile.
Coates (1986) measured Henry's constant by using the
characteristics of semi-volatility and slight solubility.
Therefore, any loss of PCBs during the DRET through
vaporization must be included in a material balance. Aqueous
solutions of PCBs were prepared by adding appropriate amount
of standard stock Aroclor 1242 and Aroclor 1254 solution. Distilled water was added to obtain an Aroclor concentration
typically found in the DRET (about 3 ug/L). The spiked water
Sediment Characteristics
Moisture Content --- 0.65 g water/g wet sample Specific Gravity
PCBs -Pb Cu Cd
---1. by Soxhlet extraction
2. by liquid-liquid extraction
3. obtained from U.S. Army Engineer Division, New England
Water Characteristics
2.3 g/mL
ug/g2
ug/g
167 (dry wt)
234 (dry Wt)
ug/g 3
ug/g 3
ug/g
376 ug/g, 511 (dry wy)
1246 (dry wt)
20 (dry wt)
PCBs --- below detection Suspended Solids --- several mg/L Pb,Cu,Cd --- below detection
following the method of NIOSH (Eller, 1984). These traps
were extracted with hexane and analyzed for PCBs; none were
detected. Therefore, a significant loss of PCBs by
volatilization during the DRET does not appear to occur.
4.5 Elutriate Test
4.5.1 Suspended Solids and PCB Concentration
Table 4.4 summarizes the results from elutriate tests
conducted at three target initial suspended solids (1, 5, 10
g/L) and two different aeration times (1 and 6 h); a
replicate of the 5 g/L target level actually yielded 4.7 g/L
due to changes in moisture content but this for all intents
was considered the same as 5 g/L. The settling time in each
experiment was 1 h. The parameters measured after the
elutriate test were suspended solids, PCBs in filtered and
unfiltered solutions, PCBs on filter, and metals (Cu, Pb,
and Cd) in filtered and unfiltered solution. Metals data
will be discussed separately in Section 4.5.4.The SS remaining after 1 h of settling ranged from 60 to 172
mg/L. Although SS remaining increased with initial sediment
concentration for the samples with 6 h of mixing, it was
less than proportional.
As shown in the Table 4.4, the PCB concentrations in
the unfiltered solution (6.3 - 15.8 ug/L) were always far
Initial SS (g/L)
Final SS
(mg/L)
Filtered Soln
(ug/L)
Unfiltered Soln PCBs on Filter (ug/L) (ug PCBs/L
Sorbed PCBs (ug/g)
soln filtered) Direct Method^ Indirect Method''
1 h Aeration, 1 h Settling
1
5 D
10
63 3.0
172 1.6
167 0.4
81 3.0
10.2 13.1 207.9 114.3
15.8 U.8 86.1 82.6
13.6 12.5 75.0 79.2
10.2 7.8 96.3 88.9
6 h Aeration, 1 h Settling
1 60
4.7 104 5 111
10 125
1.1
2.4
2.5
6.3 - •
-8.2 6.4 61.5 68.3
12.8 11.5 103.6 93.7
7.7 9.9 79.3 41.4
a. Measured from fraction retained on filter.
b. Calculated by subtracting the filtered PCB mass from the unfiltered mass
c. Duplicate sample.
4^
ug/L). Since PCBs were not detectable in the water from pre-dredged conditions, the amount of PCBs found in the filtered
solution came entirely from the sediment. The measurement of
PCBs in the filtered solutions had some biases as the resultof COMSTAR validation (Table 4.1), since the overall peak
pattern did not match standard Aroclor mixtures exactly. It was clear that most of the PCBs remaining in the watercolumn were associated with suspended solids. However, since the soluble portion of PCBs in the elutriate test was
significantly higher than the EPA Water Quality Criteria
(1980) in sea water of 0.03 ug/L, the effect on the dredgingecosystem should be carefully estimated. A reasonable mass
balance was achieved for PCBs given that the difference between unfiltered and filtered PCBs should equal the PCBson the filter. This can be seen by inspection of columns 3
to 5 in Table 4.4.
The sorbed PCBs were calculated in two different ways. The direct method was extraction and analyses of PCBs from the solid fraction retained on the filter (sorbed PCBs),
while the other was by subtracting the filtered PCBs from
the unfiltered PCBs (indirect method). The sorbed PCBs were
in the range 62 - 104 ug/g, with the exception of one
outlier (208 ug/g). Most of PCBs on the filter were around
100 ug/g or less. With one exception these sorbed PCB
concentrations were lower than the sediment PCB
concentration (167 ug/g). The sorbed PCBs calculated by the
Although the sediment was mixed for 15 min for homogenizing,
the wide variation of sorbed PCBs might arise from the
heterogeneity of sediment. The data in Table 4.4 indicated
that increasing aeration time did not yield any significant
difference in the release of PCBs.
All Aroclor mixtures are characterized by low water
solubilities. The solubility of Aroclor 1242 and 1254 at 25
°C are 240 ug/L and 12 ug/L respectively (Erickson, 1986).
In this work, the total PCBs was represented by the sum of
Aroclor 1242 and Aroclor 1254. Table 4.5 summarizes the
concentrations of Aroclor 1242 and 1254 in the DRET. For
all samples, the concentration of PCBs in filtered solutions
was higher for Aroclor 1242 than for Aroclor 1254. This is
to be expected based on the higher solubility of Aroclor
1242. Inspection of the sorbed PCB data for Aroclor 1242 and
1254 in the Table 4.5 shows no clear trend of Aroclor 1254
being higher as would be consistent from solubility. The
sorbed concentrations of two PCBs were always within a
factor of two,
A simple equilibrium partitioning model was used to
predict the concentration of soluble PCBs in the DRET. The
assumption of equilibrium is conservative, because it has
been reported that PCB congeners containing up to four
chlorines approach equilibrium within 6 weeks and congeners
with greater than six chlorines may require months or years
to reach equilibrium (Coates and Elzerman, 1986). A mass
Initial SS
(g/L)
Final SS
(mg/L)
Filtered Soln Unfiltered Soln PCBs on Filter (ug/L) (ug/L) (ug PCBs/l
soln filtered)
Sorbed PCBs <"3^9>
Direct Method'a Indirect Method
Aroclor Aroclor Aroclor Aroclor Aroclor Aroclor Aroclor Aroclor Aroclor Aroclor 1242 1254 1242 1254 1242 1254 1242 1254 1242 1254
1 h Aeration, 1 h Settling
1 63
5 172
5 D *^ 167
10 81
2.0 1.0 6.2 4.0 10.3 2.9 163.5 46.0 66.7 47.6
1.6 ND*^ 9.8 6.1 8.6 6.3 50.0 36.6 47.7 35.5 0.4 NO 9.0 4.6 8.6 3.9 51.5 23.« 51.8 27.5 1.8 1.2 6.5 3.7 4.1 3.8 50.6 46.9 58.0 30.9
6 h Aeration, 1 h Settling
1
4.7
5
10
60 - - 3.2 3.1 - - -
-104 0.9 0.2 3.5 4.7 3.1 3.3 29.8 31.7 31.9 36.4
111 1.2 1.2 7.7 5.0 4.1 3.8 36.9 34.2 58.6 34.2 125 1.3 1.2 4.2 3.5 4.8 5.2 38.0 41.3 23.0 17.6
a. Measured from fraction on filter.
b. Calculated by subtracting the filtered PCB mass from the unfiltered PCB mass.
c. Duplicate sample. d. ND = nondetectable
equilibrium from addition of sediment with sorbed PCBs is:
M^*q, = M^*C^ + M3*K *cyiOOO
(1) MsM,
^
Amount of sediment added in the DRET (g)
Sorbed PCBs on the soil (ug/g)Mass of Water (kg)
Concentration of soluble PCBs (ug/kg of
Water)Partition coefficient (g/g)
K is calculated by:
Kp = foc*Koc
foe
Koc
Fractional of sediment material that is
organic in nature
Partition coefficient based on solid phase
100 % organic carbon (g/g)
According to Karickhoff (1979), Koc is estimated by:
log Koc = log Kow - 0.21
Kow : Octanol-water partition coefficient (g/g)
Solving for C^ in Equation 1, the predicted soluble PCB
concentration from the DRET is :
C^ = (M3*q,)/(Mi + M3*Kp/1000) (2)
The predicted total PCB concentration (unfiltered PCBs) is
represented by:
C^ = (1 + SSf.^p/1000)*C^ (3)
Cj : Total PCBs in the water column (ug/L)
SS^ : Final suspended solid concentration (mg/L)
Initial SS F nal SS Filtered Soln" Unfiltered Soln*^ (g/L) (mg/L) (ug/L) (ug/L)
1 h Aeration, 1 h Settling
1.0 63 2.8 10.7
5.0 172 2.9 29.2
5.0 d" 167 2.9 28.4
10.0 81 3.0 13.8
6 h Aeration, 1 h Settling
1.0 60 2.8 10.2 4.7 104 2.9 17.7 5.0 111 2.9 19.9 10.0 125 3.0 21.3
a. Duplicate sample
b. Soluble PCBs c. Total PCBs
Assunptions 1. PCBs concentration in the sediment is 167 ug/L
and consists of 1:1 Aroclor 1242 and 1254.
2. The each lowest partition coefficients with the homolog is chosen.
3. foe in the sediment is 0.15.
4. Equilibrium condition is attained after mixing. 5. logKoc = logKow - 0.21 (Karickhoff,1979) 6. Kp = foe * Koc
7. Solid effect is not considered.
provided from Equation 2. The predicted total PCBs were
calculated from equation 3. The sediment PCBs (167 ug/g) are
from the liquid-liquid extraction and the PCB composition of
the mixture is 1:1 Aroclor 1242 and 12 54. The foe was
measured by a total organic carbon (TOC) analyzer (Model
700, O.I. Corporation). The analyzer oxidizes the TOC to COj
with sodium persulfate and analyzes the COj with an
infrared detector (APHA, 1981).
Selection of the appropriate Kow in these calculations
required an estimation procedure. The weight percentage of
each PCB homolog of standard Aroclor 1242 and 1254 mixture
is given in Table 4.7 (Onuska, 1983). The lowest Kow values
chosen within each homologous group appear in Table 4.8
(Erickson, 1986). Since the weight percentage and Kow values
of every congener in standard Aroclor 1242 and 1254 were not
available, the weight percentage and Kow values of each
homolog were used to predict the soluble PCBs. The lowest
Kow values among Kow values of each homolog were used to
predict the soluble PCBs. This will give the highest soluble
PCB concentration (least sorption to sediment).
Another problem in estimating Kp is the report from the
literature (O'Connor and Connolly, 1980) that Kp may not be
constant but instead inversely proportional to the
concentration of adsorbing solids (sediment). The dependence
of partition coefficient on SS concentration in aqueous
Homologous Group 1242 1254
Monochlorobiphenyl Dichlorobiphenyl Trichlorobiphenyl Tetrachlorobiphenyl Pentachlorobiphenyl Hexachlorobiphenyl Heptachlorobiphenyl
1.0 0.05
16.0 0.1
43.0 0.5
27.0 10.0
9.0 70.0
4.0 14.0
-5.35
Homologous Group Log Kow
Monochlorobiphenyl 4 .56" Dichlorobiphenyl 5 02
Trichlorobiphenyl 5 64
Tetrachlorobiphenyl 6 67
Pentachlorobiphenyl 6,38
Hexachlorobiphenyl 7 12
Heptachlorobiphenyl 7 93
a. Lowest value within PCB homolog was chosen.
be significant (O'Connor and Connolly, 1980) and the range
of SS in the DRET was similar to that of laboratory (lO^-lo'^
mg/L) in which partition coefficients of PCBs are measured,
the solid effects was not considered.
The predicted amounts of soluble PCBs in the filtered
solution were all about 3 ug/L regardless of the amount of
solids added in the DRET (Table 4.6). PCBs are so strongly
sorbed to particles that very little is released to the
water at equilibrium. Thus for calculation purposes, the
initial sorbed PCB concentration (sediment PCBs) is equal to
the final sorbed PCB concentration.
The total PCBs ranged from 10.2 to 29.2 ug/L. They are
proportional to SS remaining in water column because the
calculation procedure is simply to multiply the sorbed PCB
concentration by the final SS concentration. For
calculation, the sorbed PCB distribution with particle size
was assumed independent of particle size. A more detail
analysis of the dependence of sorbed PCBs on particle size
follows in section 4.10. Comparisons of predicted and
experimental values of soluble and total PCBs are given in
Figure 4.2 and 4.3 respectively.
The equilibrium assumption and the use of the lowest
Kow values of each homolog yielded a maximum predicted fluid
phase concentration. Use of the initial PCB concentration in
the sediment (167 ug/g), instead of the mean concentration
measured in the DRET experiments (100 ug/g) also yielded a
ͣ o o D c E (D Q-X
«>*<><xx»<xx><x*»^^
(D E '"'"' .-KXXXXXXXXXXXXXXXi>»iXXXXX^
en 1 ,-v^$^88888888888888888^^
E^ c^18888888888888888888888^
eratio
Final
888888888888888888888888^
<•X
en COi^^^^m^88888^^^^88^^^^^
.5 c^8888888888888888888^
^^^^^S^^a^^^^^^^
1---1---1---1---1---1---i---i---i---1---1---1---1---1---1
T «
I ^ ID ^
J,
-I
? s
I "
i 5
I
T N
n
Ml "^
T 3
n n o Pn o A H o n ͣ d « ͣ p u •r( "O 4) M a ͣ p m n u A ͣ H o n IH o a o n •H M « 6 O O o 3 •rt 1^
o in O in o
•^ ro ro Csl CN
LD O in
o
o
d
ͣ o u C Q) CL X E c o.E < I en m
NXW>^»^6«WW»X^
K>oooooc>ooo<x>6wywH T _
J. '
1 «
6 S
7 S
i 5
T f^
^ C4
T S
n n u Pi Id ͣ P O ͣ P •O O ͣ P u •H ͣ d o u o, P n a o 0 ͣ p o ͣ p o (3 o 01 •H M Id 0, e o u o M 3 •H Cm
O in o in o tn o
explains that the predictions were higher than or equal to
the experimental values. Figure 4.3 indicates that the total
PCB concentration is proportional to the final SS
concentration, but the soluble PCB concentration is nearly
independent of the final SS concentration. This makes sense
considering that most of the PCB concentration is particle
associated.
4.5.2 Usefulness of Simple Ecmilibrium Partitioning Model
Research has shown no direct relationship between the
sediment PCB concentration and the soluble PCB concentrationreleased during the elutriate test (Lee et al., 1975). The
results obtained above with the simple equilibrium
partitioning model explain why this is reasonable. For
contaminants that are strongly sorbed to sediment particles,
this is good reason to question the "Jensen Criteria" (Lee
et al, 1976) as a basis for judging the potential
significance of chemical contaminants on water quality
during open water disposal: the amount of contaminants
sorbed to sediments is not a measure of their release to the
water unless the partition coefficients are known.
be made using in Eguation 2 if equilibrium partitioning and
resuspended solids concentration are assumed. This does not
require an elutriate test. The total PCBs in the column,however, depend on knowledge of the final SS (Equation 3)
resulting from the dredging operation. This emphasizes the need to predict the final suspended solids concentration from each dredgehead type reasonably well.This simple equilibrium partitioning model could be a good screening method to predict soluble and particulate
PCBs before dredging operations begin. This may be important
because the analysis of PCBs is complicated, expensive, time consuming and not easy to conduct for most ordinarylaboratories.
4.5.3 Comparison of the Soluble PCBs with Previous Studies
Soluble PCBs found in elutriate tests of other U.S.
Army Corps of Engineers studies are presented in Table 4.9. Unfortunately, the same method of PCB analysis and
quantification were not used in previous research sponsored
by the Army Corps of Engineers. Therefore, these results cannot be compared directly to this study. Most values are an order of magnitude lower than the 2.0 + 1.0 ug/L found in
this study. The two exceptions are anomalously high (9.6 and
11.7 ug/L). These are not easily explained given the high
partition coefficient of PCBs. Sorbed PCB concentrations
Soluble Soluble
Type of Soluble PCBs Aroclor 1242 Aroclor 1254
Source Site Elutriate test (ug/L) (ug/L) (ug/L)
Ludwig and Sherrard Black Harbor Standard 3.18« 2 0.18 (1988)
ND^'" m'
Calumet River Standard NO
Jones and Lee Galveston Channel Standard 0.261
(1978) Upper Mississippi River Duwaniish River 2 Oakland Harbor 2 Stamford Harbor U •ailey Creek Los Angeles A7 Bay Ridge Channel Perth Amboy Channel HSC 2
Norwalk Harbor
Texas City Channel
HSC 1
0.011 0.033 0.026 0.081 0.034 0.036 0.086 0.069 0.872 0.104 9.619 11.755
This study New Bedford Harbor DRET 2.0 + 1.0
a. Assuming that soluble PCBs = Soluble Aroctor 1242 -•- Soluble Aroclor 1242
4.5.4 Release of Metals fCu. Pb. and Cd) in the DRET
The concentration of Cu, Cd, and Pb in both filtered
and unfiltered samples taken after 1 h of settling in
evaluation of the DRET are presented in Table 4.10.
Unfiltered Cu ranged from 3 4 to 105 ug/L and unfiltered Pb from 7 to 24 ug/L whereas unfiltered Cd could not be
detected. The concentrations of these metals in filtered
samples were below detection limits. These data suggest that
very little of the sorbed Cu and Pb are released in soluble
form for the DRET conditions evaluated (initial SS of 1 g/L,
5 g/L, and 10 g/L; aeration time of 1 h and 6 h; settling
time of 1 h). The maximum time allowed for desorption was 7
h, this being for an aeration time of 6 h and settling time
of 1 h. The concentration of unfiltered Cu and Pb were not
proportional to the final SS concentration (also shown in
Table 4.10) as one would expect. This might be caused by the
heterogeneity of sediment or lack of complete metal recovery
from the suspended solids by acid digestion, which is
required for atomic absorption spectroscopy.
Previous research on the SET by Jones and Lee (1978)
also showed that very little if any soluble metals (Cd, Cr,
Ni, Pb, Cu, Hg, and As) were present. Fe and Mn present in
reduced form in disturbed sediment were oxidized uponresuspension of the sediment material in the elutriate test
Initial Final
SS SS
(g/L) (mg/L)
Pb
Filtered Unfiltered (ug/L) (ug/L)
Cu
Filtered Unfiltered (ug/L) (ug/L)
Cd
Filtered Unfiltered (ug/L) (ug/L) 1 h Aeration, 1 h Settling
1.0 63 ND 16
5.0 172 NO 19
5.0 0 167 ND
-10.0 81 NO ND
6 h Aeration, 1 h Settling
1.0 60 NO ND
4.7 104 ND 24
5.0 111 NO 22
10.0 125 ND 7
NO 78
ND 101 14
-NO 38
NO 67
ND 71 13 105
ND 34
NO NO
ND ND
ND ND
1. Detection limit of Pb, Cu, Cd are 5, 10, 5 ug/L respectively
as sorption traps for metals. It appears that the
particulate-borne fraction of the trace metals constitutes
the major source of the metal contaminants in the water
column. The data in Table 4.10 indicated that increasing
aeration time did not yield any significant difference in
the release of Cu, Pb, and Cd.
4.6 Field Data from New Bedford Harbor
Samples were collected from the ports of each
dredgehead type (cutterhead, horizontal auger, and matchbox)
and the plume. The location of the plume samples is shown in
Figure 4.4. The plume data of PCB and SS concentrations that
were presented in the U.S. Army Corps of Engineers NED
Report (1989) were average values obtained from the
following stations (1-5; 6-10; and 11-15). These samples
were taken within about 100 feet of the dredge site and some
just inside the dredge area itself. Most samples were taken
during the dredging operation and the remainder within a
couple of hours after dredging had been completed (refer to
APPENDIX for the detail information). Neither of the samples
types - dredgehead nor plume - is a accurate representation
of the final conditions achieved in the DRET. Because