Sharif University of Technology
Scientia IranicaTransactions B: Mechanical Engineering http://scientiairanica.sharif.edu
Modeling particle deposition in the respiratory system
during successive respiratory cycles
H. Nemati, M.S. Saidi
, and V. Hosseini
Department of Mechanical Engineering, Sharif University of Technology, Tehran, P.O. Box 11155-9567, Iran. Received 19 April 2017; received in revised form 16 April 2018; accepted 16 February 2019
KEYWORDS Particle deposition; Respiratory system; Lung;
Lobe;
Successive respiratory cycles.
Abstract. This study uses a 5-lobe symmetric model to investigate total, lobar and generational particle deposition fractions in the lungs during successive cycles. It was found that for the particle size between 0.05 and 2 m and the tidal volumes greater than 1000 ml, the eect of successive cycles helped predict more deposition fraction per cycle up to about 16% than that of a single cycle. The mentioned range of tidal volumes corresponds to light or heavy physical activities. Therefore, it can be understood that people, when physically active, exposed to particulate matter within the mentioned size range are at higher health risk as compared to both the resting state and the same state calculations based on a single cycle. Finally, total and generational remaining mass fractions suspended in the respiratory tract after the completion of each cycle are calculated. This remaining mass fraction turned out to be negligible except for particles between 0.05 and 2 m. © 2020 Sharif University of Technology. All rights reserved.
1. Introduction
The investigation of the amount and pattern of particle deposition in the human respiratory system has drawn many researchers' attention during recent years. These studies are carried out with the objective of achieving two main goals: The rst one is to study and control the adverse eects of particulate matter air pollution on human health; the second one is to investigate and increase the deposition rate of aerosolized drug parti-cles in the respiratory system. To treat some diseases, specically pulmonary diseases, aerosolized drugs are prepared and inhaled. If the particles released from such equipment are in the proper amount and reach proper spots, the treatment can occur eectively.
*. Corresponding author. Tel.: +98 21 6616 5558 E-mail addresses: nemati52@hotmail.com (H. Nemati); mssaidi@sharif.edu (M.S. Saidi); vhosseini@sharif.edu (V. Hosseini)
doi: 10.24200/sci.2019.21269
So far, a lot of modeling has been done in the eld of particle deposition in the respiratory system. Some researchers have studied this problem locally, e.g., in the oral or nasal cavity. On the other hand, some others have developed the whole lung models or models that represent the whole respiratory system. One of the rst such studies was done by Yeh and Shcum [1]. They calculated the particle deposition in a single path of the respiratory tract. In addition to introducing a novel statistical model in their research series, Koblinger and Hofmann [2{6] simulated the particle deposition in the respiratory tract using empirical formulas according to Yeh and Schum [1]. Dastanpour et al. [7] modeled the whole lung particle deposition based on the statistical model using a Monte-Carlo method. They presented a novel technique to calculate the airow in each airway based on the position of the airway and the alveoli distal to it. Monjezi et al. [8] used a multi-scale method to develop the whole lung particle deposition model. They coupled a 3D model of the upper airways with an impedance model of the distal airways to calculate the ow in each airway. They also used a statistical
model to build up the geometric structure of the lungs. Moreover, recently, Georgakakou et al. [9] developed a simplied model based on perfect alveolar mixing. The results they derived for the pulmonary deposition were in good agreement with previous data for particles greater than 0.1 m. Asgharian and Price [10] used a multiple-path geometry based on the data presented by Raabe et al. [11] and Yeh and Schum [1] and calculated the particle deposition using the concentration equa-tion. Salma et al. [12] calculated the particle deposition under dierent physical activity conditions for dierent regions of Budapest using a statistical geometric model. Their results showed that, for the harder physical activities, the acinar deposition increased, while the tracheobronchial deposition fraction remained almost constant.
In the present study, the eect of successive respi-ratory cycles on the particle deposition is investigated as a more exact solution to the problem instead of a single cycle that has been studied widely so far. Total and generational deposition fractions and the remaining mass fraction suspended in the respiratory tract after successive cycles until the quasi-steady state of breathing are also calculated and discussed.
2. Methodology
In order to simulate the particle deposition in the respiratory system, three major steps must be taken. The rst step is the simulation of the geometry of the respiratory tract. Based on the challenge of each problem, the proper geometrical model among dierent presented geometrical models should be chosen, and one should build up the geometry of the respiratory tract. The second step is the calculation of the airow in each of the airways. It can be done by using proper hydrodynamic boundary conditions. Finally, the third step is the calculation of the particle deposition fraction in each airway based on the presented deposition formulas. Each of these major steps in this study will be explained in the following sections.
2.1. Geometry
In the present study, Yeh and Shum's 5-lobe geometric model [1] is used. In this model, the airways proximal to the starting point of the ve lobes are modeled as the asymmetric channels, each of which has its own geometric data. On the other hand, within each of the ve lobes, the bifurcations are considered to be sym-metric, and the airways in the same generation have the same geometric data. Although the respiratory tract is supposed to be symmetric in each lobe, each of the ve lobes has its own geometric data sheet.
Therefore, we can model each lobe separately and capture its own particle deposition pattern. In this model, for each lobe, the generation after which the
airways are in the alveolar region is determined. Based on a research by Weibel et al. [13], for the rst three generations of the alveolar region, it is supposed that 0.2, 0.4, and 0.7 of the lateral area of the airways is covered by the alveoli, respectively. For the next generations, this area fraction increases to unity. It is implied that, for the generations distal to the third alveolar generation, the lateral area is totally covered by the alveoli. The FRC, which stands for \Functional Residual Capacity", is considered equal to 2300 ml based on physiologic data. Following the application of the mentioned modications to the model according to Weibel et al. [13], the total number of alveoli is calculated to be about 450 million. Ochs et al. [14] studied the lung of six adults and presented 480 million alveoli, on average, for an adult. This shows that the implemented modication to the original geometric model that presented 300 million alveoli in number could make it closer to the real structure of the lung and, thus, make it more accurate. Although the statistical model, among the geometric models, can predict the uncertainties better than the other models, the current study used a 5-lobe symmetric model. Considering that the challenge of the present study is the eect of successive respiratory cycles, the application of a statistical model during successive cycles can lead to an enormous computational cost, which is out of our computational scope.
2.2. Flow calculation
In order to simulate the airow in the airways, at rst, we need to know the temporal breathing prole. In the primary research studies, as the rst approximation, the inhalation and exhalation ows were assumed to be constant with respect to time. Thereafter, based on the suggestion of other researchers [15,16], the sinusoidal prole was used frequently. This prole is more similar to the real breathing ow prole and, nevertheless, enjoys simplicity for the calculation algorithm to be run with reasonable time and energy cost.
The other challenge in the simulation of the airow is the ow division between the airways. Con-sidering the fact that the main reason for the ow creation is the expansion and contraction of the alveoli, this study calculated the ow share of each airway based on the number of the alveoli distal to it. This technique was also used by Henry and Tsuda [17] in 2010 and reused by Dastanpour et al. [7] in 2014. In the alveolar airways, a fraction of the lateral area is covered by the alveoli; therefore, a portion of ow goes into these alveoli and, in accordance, the output ow is somewhat less than the input ow.
In this study, based on the physiological data, the inhalation and exhalation time is considered to be 2 s, and the respiratory pause time (the time between the end of an exhalation and the start of the next
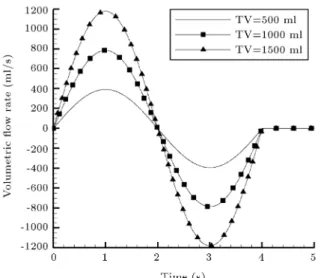
Figure 1. Volumetric ow rate versus time.
inhalation) is considered to be 1 s. The calculation is done for three dierent values of the tidal volume. A tidal volume of 500 ml is considered to simulate breathing in the normal mode, 1000 ml for the state of light physical activity, and 1500 ml for the state of heavy physical activities. The total air ow as a function of time is depicted in Figure 1 for three dierent values of the tidal volume.
2.3. The calculation algorithm
In this study, it is supposed that a subject is con-tinuously exposed to the particles. It is implied that the boundary condition at the inlet of the respiratory system is the constant concentration of particles during the inhalation and the escape boundary condition for the exited particles during the exhalation. This state can be considered in the case of air pollution calculation. In this problem, two types of numerical integrations are required. The rst one is integration on the mass of the particles entered into the oral or nasal cavity, and the second one is to track every group of particles in the respiratory tract. Each of these integrations has its own time step. For both of these numerical integrations, the time-step size study was done. For the integration on the mass of the entered particles, three dierent time steps of 0.05, 0.02, and 0.01 s were used and the results were close and in agreement. Thus, the problem was solved based on 0.05 s. For the integration to track every group of particles in the respiratory tract, a time-step between 0.001 s and 0.0001 s was chosen based on the geometry of each lobe. Thus, each lobe has its own time-step. For each of the ve lobes, the time-step decreased until the results changed negligibly after dividing the time-step by 2 and 4. Then, this time-time-step was considered for the corresponding lobe.
The general algorithm to solve the problem has the following four main steps:
1. At the beginning, it is supposed that the whole respiratory system is empty of particles. At this time, breathing begins in the air containing par-ticles. Unity is attributed to the total particle mass entering the respiratory system during the inhalation;
2. In each time step, with a proper understanding of the airow versus time, the mass fraction entering the respiratory system can be tracked in the res-piratory tract, and its deposition fraction in each airway is calculated. After exiting each airway, the remaining particles are divided into two parts and enter the distal airways based on the ow division between the daughter airways. This procedure continues until the rst inhalation ends;
3. At the end of the rst inhalation, part of the total particle mass is deposited in the airways, part of it enters the alveoli, and the rest is suspended in the airways. The mass entering the alveoli is partly deposited, and the rest is suspended in the alveoli. In the initial state before the inhalation begins, the alveoli contain a volume of air inside them. When the new particles containing air are sucked into the alveoli, this \polluted" air is partly mixed with the \clean" air that exists initially in the alveoli. This amount of mixture is introduced by \mixing factor". Koblinger and Hofmann [2] suggested the amount of 0.25 for this parameter based on best tting with the experimental results. In this study, this amount is considered for the mixing factor. During the exhalation, part of the suspended mass in the alveoli exits the respiratory system. However, the part that is determined by the mixing factor is mixed with the initial air in the alveoli and exits the alveoli gradually and with a delay to the main wave of the exhalation air. It is implied that the moment when the unmixed part of air exits the alveoli, the exiting process of the mixed part of air begins and lasts until the exhalation ends. This time delay is the reason why, at the end of the exhalation, the particles in the mixed part of the air cannot totally exit the respiratory system and part of it remains in the airways. This is the main mechanism that is responsible for the remaining mass in the respiratory tract at the end of the respiratory cycle. By integrating the time-steps of the rst respiratory cycle, the deposited fraction and the remaining fraction of particles mass can be calculated after the rst exhalation ends. During the pause time, part of the remaining mass is deposited and the remaining mass decreases slightly.
At this moment, the modeling of the rst respiratory cycle is completed, and the deposition fraction and pattern, the remaining mass fraction
and pattern, and the exited mass fraction after the rst respiratory cycle can be obtained;
4. When the second respiratory cycle begins, at rst, the location of the remaining mass fractions is tracked, and their own deposition and the re-maining mass fraction are calculated. Then, the calculation of the newly entered mass from the oral or nasal cavity is done similar to the rst cycle algorithm. The computational algorithm for the next cycles is exactly like the second cycle.
Finally, after a few respiratory cycles, the deposited fraction during each cycle and the remaining mass fraction in the respiratory tract will be accessible. The above computational algorithm was run by a computational code, and the results were extracted. The owcharts of the particle deposition algorithm in the tracheobronchial and alveolar regions in a typical lobe are presented in Appendix A.
For more clarication, the mass balance equation is presented below. For every stage of the geometry, namely a single alveolus, an airway, and the whole respiratory system, the mass is balanced based on Eq. (1):
mold
rem+ men= mdep+ mout+ mnewrem: (1)
In the above equation, mold
rem and mnewrem are the
re-maining mass fractions at the beginning and end of a typical respiratory cycle, men is the entered mass
fraction, mout is the exited mass fraction, and mdep is
the deposited mass fraction during the current cycle in each airway or alveolus. Since the aim of this study is to assess the eect of successive cycles that is basically due to the alveolar mixing, the mass balance equations in a single alveolus are presented below, specically.
men= mm+ mu= men mf + men (1 mf);
(2a) mdep= mm+ mu+ moldrem
df; (2b)
mout=mu (1 df)+mm
1 vmin ven
(1 df); (2c)
mnew
rem= moldrem (1 df) + mm vvmin
en (1 df):(2d)
In Eqs. (2a) to (2d), mf and df are the mixing factor and deposition fraction, respectively. Deposition fraction in each airway or alveolus is calculated based on formulas that are to be introduced in the following sections. mm and mu are the mixed and unmixed
parts of the entered mass to the alveoli, respectively. In addition, in these equations, vmin and ven are the
minimum volume and the volume of a typical alveolus
at a moment when the particle-containing air front enters the alveolus, respectively. The total minimum volume of alveoli calculated using FRC and the volume of the respiratory dead space that are considered to be 2300 ml and 150 ml, respectively, in this study. The minimum volume of each alveolus is calculated by dividing the total minimum volume of alveoli by their number (450 million) that gives the amount of 4.78e-12 m3. v
enis dierent for each alveolus, and its amount
is calculated computationally by tracking the particle-containing air front. Figure 2 depicts a schematic view of the deection of a typical alveolus and the entrance of the air front into it during a cycle. It may give a good conceptual sense of ven. In Figure 2, the areas
with a higher concentration of particles are shown to be darker. This spectrum has no quantitative basis and is depicted merely to clarify the computational algorithm for the reader. Figure 2 shows that the alveolar mixing increases the remaining mass fraction, which still exists from the previous cycle. When the respiration reaches a quasi-steady state, this increment decays and the remaining mass fraction experiences periodic variations along the respiratory cycles.
In the present study, deposition due to three ma-jor deposition mechanisms, e.g., impaction, sedimenta-tion, and diusion, is calculated. In the oral and nasal cavities, to the best of our knowledge, no research has been done to estimate the deposition fraction purely by sedimentation. Moreover, due to the small residence time of the particles in these cavities, the deposition by sedimentation can be neglected. Therefore, for the oral and nasal cavities, the deposition is calculated based
Figure 2. Schematic view of the variation of an alveolus volume during inhalation and exhalation.
on impaction and diusion. In the alveoli, due to the small velocity of the airow and, in turn, particles, the impaction is insignicant and the deposition is calculated based on diusion and sedimentation. 2.4. Nasal and oral cavities deposition
To calculate the deposition fraction in the oral and nasal cavities, mainly, the two mechanisms of im-paction and diusion are considered. Researchers have suggested dierent relations for the deposition fraction due to each of these mechanisms during the inhalation and exhalation. This study has tried to apply the most recent and reliable relations to calculate the deposition fraction in each part of the respiratory system. 2.4.1. Nasal deposition during inhalation
To calculate the deposition fraction due to impaction in the nasal cavity during the inhalation, the results of the research by Shang et al. were used [18]. They investigated the regional deposition of micro-particles in the nasal cavity and derived a diagram for the impaction deposition versus the inertial parameter. The inertial parameter is dened as I = d2Q, where
d is the particle aerodynamic diameter and Q is the volumetric airow rate. Their research was published in 2015 and is one of the most recent researches in its eld.
To calculate the deposition fraction in the nasal cavity due to diusion, Eq. (3) is used as suggested by Shi et al. [19]. This relation is based on the diusion parameter and Schmidt number.
= (0:568 0:69 ln )1=2Sc 1=6: (3)
Schmidt number in Eq. (3) represents the ratio of the momentum diusivity in the uid to the mass diusivity of the particles. The diusion parameter and Schmidt number are dened as = DL=(4Q) and Sc = = D, respectively. D, L, Q, are the diusion coecient, the airway length, the airow rate, and the kinetic viscosity of air, respectively.
2.4.2. Nasal deposition during exhalation
Compared to inhalation, little research has been done on oral and nasal deposition during the exhalation. The most recent and reliable relations for the nasal deposi-tion fracdeposi-tion during the exhaladeposi-tion were presented by NCRP [20] in 1997. These relations that are presented in Eqs. (4) and (5) predict the particle deposition fraction in the nasal cavity during the exhalation due to impaction and diusion, respectively. The subscript p represents the particles' properties.
imp=
1 + pd2pQ=2300
1:01 1; (4)
di = 1 exp
15 D1=2Q 1=8: (5)
These relations have been used for the exhalation particle deposition.
2.4.3. Oral deposition during inhalation
Golshahi et al. [21] in 2013 presented a new relation for the oral deposition fraction during the inhalation. In their experimental research, they made several replicas of the extrathoracic airways of a few adults and, by releasing micro-particles at the ow inlet, they measured the deposition fraction. Since their particle sizes were greater than 0.5 m, this study considered their results as the impaction deposition. Their results represent the particle deposition fraction as a function of Reynolds number and Stokes number. This study used their proposed relation as follows:
= 1 1 (1:5e5) Stk3:03Re0:25+ 1: (6)
Reynolds and Stokes numbers are dened as Re = 4Q=(D) and Stk = 2pd2pQCc=(9D3),
respec-tively, where p and dp are particle density and
diam-eter, respectively, Q is volumetric ow rate, and D is the airway diameter.
To calculate Cc, Cunningham slip correction
fac-tor, one may refer to [22].
Xi and Longest [23] suggested a relation that predicted the oral deposition due to diusion during the inhalation. Their research has been conducted recently and found to be more complete than the other related researches. It contains several geometric parameters of the oral cavity; for example, the total surface area and the hydraulic diameter of the inlet section are engaged. In this relation, similar to its counterpart for the nasal cavity, the deposition fraction is a function of Reynolds and Schmidt dimensionless numbers. This relation is presented in Eq. (7):
= 1 exp
0:1654AAsur
enRe
0:339Sc 0:661: (7)
In the above relation, the Reynolds number is calcu-lated based on the hydraulic diameter of the inlet and is dened as Re = UenDh=v. The subscripts en and h
represent \entrance" and \hydraulic", respectively. 2.4.4. Oral deposition during exhalation
Yu et al. [24] predicted that the impaction deposition in the oral cavity during the exhalation was negligible, considering the oral cavity geometry and the ow pattern. Therefore, this study neglected the oral deposition during the exhalation due to impaction. To calculate the oral deposition during the exhalation due to diusion, the relation based on NCRP [20] is used as follows:
= 1 exp 8:51 D1=2Q 1=8: (8)
2.4.5. Total deposition in the oral and nasal cavities Considering the fact that both impaction and diusion
mechanisms take part in the deposition in the oral and nasal cavities, the addition law of probability is used to obtain the overall deposition fraction as follows:
tot= d+ i di: (9)
2.5. Deposition in the tracheobronchial airways
Dierent researchers have studied the deposition in the tracheobronchial airways. Yeh and Schum [1] proposed the relations based on the experimental data for the deposition fraction in the tracheobronchial airways. These relations were used by Koblinger and Hofmann [2] and Salma et al. [25,26]. The most comprehensive relation set to calculate the deposition fraction was suggested by NCRP [20] in 1997. However, Zhang et al. [27] presented even newer relations in 2008. These new relations are limited to a certain range of some parameters such as the particle size. Therefore, the present study used the newer relations in their own range of parameters; otherwise, the NCRP rela-tions [20] were used. In the tracheobronchial airways, three mechanisms of impaction, sedimentation, and diusion were considered to take part in the deposition. 2.5.1. Deposition due to diusion
The diusion phenomenon is a result of the well-known Brownian motion of the particles. The diusion coecient represents the diusivity of the particles. The deposition fraction of the particles in a typical volume is a fraction of the volume dimensions and the residence time of the particles, in addition to the particle's diusivity. The relation suggested by Zhang et al. [27], which is a function of the diusion parameter, is as follows:
pd= aexp(b c): (10)
The diusion parameter in Eq. (10) is dened in Section 2.4.1, except that the length and airow of the specic airway are used in the formula. In Eq. (10), a, b, and c are constants that are determined based on the value of the diusion parameter. For details, refer to Zhang et al. [27]. To calculate the deposition fraction due to diusion in the tracheobronchial airways, by default, Eq. (10) is used unless its limitations are not authenticated. In such situations, the NCRP [20] relation is used. This relation is represented in Eq. (11).
pd=1 0:819e 14:63 0:0976e 89:22
0:0325e 228 0:0509e 125:92=3
: (11) In the pause time, the deposition fraction is calcu-lated by Eq. (12), which has also been suggested by NCRP [20].
pd= 1 exp
23:136DtDrest2
: (12)
2.5.2. Deposition due to impaction
The impaction deposition is a result of the deviation of the particles from their initial streamline due to the curvature of the ow pattern. Larger and heavier par-ticles and sharper curvature of the ow path result in more deviation and, thus, more deposition fraction due to impaction. Eq. (13) that is presented by NCRP [20] shows the deposition fraction due to impaction as a function of Stokes number and the angle of bifurcation: pi=1 (2=) cos 1(Stk)+(1=) sin2 cos 1(Stk):
(13) 2.5.3. Deposition due to sedimentation
The deposition due to sedimentation is a result of gravity. NCRP presented the relation in Eq. (14) for this part of deposition. This equation is a function of the settling velocity, ow velocity, the dimensions of the airway, and the gravity angle.
ps= 1 exp
4
vset
U L Dcos(!)
: (14)
In Eq. (14), ! is calculated as ! = (=2) ', in which ' is the angle between the axis of the channel and the direction of the gravity eld. The settling velocity that is a function of the particle properties, the gravity acceleration, the viscosity of the uid, and Cunningham slip correction factor is calculated as follows:
vset= Ccpgd2p=(18):
Considering that the sedimentation deposition occurs because of gravity and is not dependent on the airow, it should be calculated during the pause time, too. In Eq. (14), the L=U ratio represents the residence time of the particles in the airway. Therefore, it can be replaced by tpause and used to calculate the
deposition during the respiratory pause time. The result is presented in Eq. (15):
ps= 1 exp
4
vset
D tpausecos(!)
: (15) 2.5.4. Total deposition in the tracheobronchial airways Koblinger and Hofmann [2] used a simple summation of the deposition fractions due to dierent mechanisms to obtain the total deposition fraction in each airway. However, since the three mechanisms are not indepen-dent, Goo and Kim [28] proposed the addition law of probability to calculate the total deposition fraction due to all the mechanisms, as presented in Eq. (16).
ptot= pd+ pi+ ps pdpi pdps pips+ pdpips:
(16) In this study, the total deposition in each airway is calculated based on Eq. (16).
2.6. Particles deposition in the alveolar ducts As mentioned in the geometry section, the geometric data based on Weibel et al. [13] is used to simulate the structure of the alveolar ducts. The other parameter eective in the alveolar deposition is the mixing factor. The mixing of the \new" air and the \old" air in the alveoli is responsible for the eect of the previous respiratory cycles on the next cycles. The mixing phenomenon is basically dependent on the respiration conditions and the particle size; however, Koblinger and Hofmann [2] suggested a constant value of 0.25 for the mixing factor. They presented this value based on the best tting of their simulation results with the experimental data. The method for the application of the mixing factor comes below in detail. After the partial deposition of the aerosol mass entering the alveoli, 0.25 fraction of the undeposited particle mass is mixed with the air that exists initially in the alveoli before the beginning of the inhalation; the rest totally exits the alveoli during the exhalation. The mass fraction that is mixed with the old air exits the alveoli gradually until the exhalation ends. The alveolar deposition is calculated based on proper relations, and the remaining mass fraction in each alveolus is saved for calculating the exhalation. When the exhalation begins, the unmixed part of the particles mass, after calculating its deposition, exits the alveoli just like its entrance, and, in the following, the mixed part exits the alveoli gradually until the exhalation ends. The unmixed part is tracked in the respiratory tract, and its deposition during the exhalation is calculated; nally, its residual fraction totally exits the respiratory system. Since the exiting of the mixed part of the particles lasts until the end of the exhalation, a typical particle of this mass fraction may stop at any point of the respiratory tract at the end of the exhalation. For this part, the deposition fraction of the mass fraction is calculated at the stopping point of the particles, and the remaining part of this mass fraction is saved at its geometric position for the calculation of the next respiratory cycle.
For the alveolar regions, the deposition fraction is calculated in two parts: The rst one is the alveolar part of the duct and the second one is the cylindrical part of it. The total deposition in an alveolar airway is obtained through a summation of these two deposition fractions. For this purpose, the presented relations by Koblinger and Hofmann [2] are used.
3. Results and discussion
In this study, the particle deposition in dierent regions of the respiratory system in each of the ve lobes and for dierent particle sizes is calculated. For each lobe, a symmetric pathway is considered based on the lobe-specic geometrical data, and the calculations are done
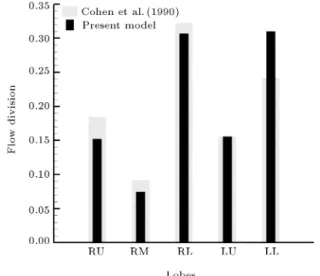
Figure 3. Flow division between the lobes.
for several successive respiratory cycles. The airow in each airway is determined based on the alveoli number distal to it. Therefore, the share of each lobe from the total airow is considered proportional to the number of the lobe alveoli. Figure 3 shows the share of each lobe from the total airow. It can be observed that the left lower lobe and the right lower lobe draw the most share, and the right middle lobe receives the least share of ow. In Figure 3, the obtained ow division is also compared to the results of Cohen et al. [29]. As is shown, the trend is the same, but some dierences can be detected. Cohen et al. [29] used the pressure outlet boundary condition to calculate the ow division. Therefore, the observed dierence results from dierent methods. Since the main reason for the airow is expansion and suction of the alveoli, it is more reasonable to calculate the airow based on the alveoli number, which is pursued in the present study.
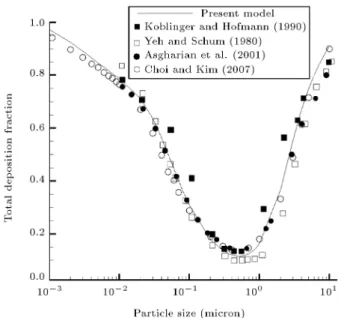
To calculate the deposition of each particle group in each airway, the ow of the airway at that specic moment is used. This technique generates more ac-curate computations than most of the previous studies that used the average ow rate in the calculations. The density of the particles is considered to be a standard value of 1 g/ml. Calculations are done for 37 dierent particle sizes ranging from 1 nm to 10 m. The total respiratory deposition of dierent particle sizes is shown in Figure 4.
When breathing begins, theoretically, a few breathing cycles are required for the total deposition per cycle to reach a quasi-steady amount. Based on the particle size and the tidal volume, the number of cycles to reach a quasi-steady state can be dierent. To examine the validity of the results, the total calculated deposition in a single cycle, for a tidal volume of 500 ml, is compared to the other researchers' results. This comparison shown in Figure 4 shows to be in proper agreement with other results found by Koblinger and
Figure 4. Total deposition fraction versus particle size for the 500 ml tidal volume.
Hofmann [2], Yeh and Schum [1], Asgharian et al. [30], and Choi and Kim [31].
The total deposition fraction during a single cycle is compared with the total deposition fraction per cycle in the quasi-steady state. Figure 5 shows this comparison for tidal volumes of 500, 1000, and 1500 ml. The variation of the total deposition fraction less than 1% is considered as the criterion for reaching a quasi-steady state.
As shown in Figure 5, for a particle size near 10 m and 1 nm, the total respiratory deposition is
Figure 5. Total deposition per cycle for the dierent tidal volumes.
close to unity. It means that these particles are almost totally deposited in the respiratory tract. The high deposition fraction of the particles near 10 m is due to their huge inertia that increases the impaction and sedimentation deposition in the airways. For a small particle near 1 nm, which is quite small in size, the dif-fusion coecient is so large that it causes high diusive deposition in the respiratory tract. For the particles between these two limit sizes, the total deposition fraction decreases until it reaches its minimum value for the particle size about 0.5 to 0.6 m. The particles in this size range are not massive enough nor small enough to be deposited totally in the respiratory tract. Therefore, there is a minimum for the total deposition fraction.
According to Figure 5, by increasing the tidal volume, the total deposition increases for all particle sizes. It can be observed that, for tidal volumes of 500, 1000, and 1500 ml, the minimum deposition fractions are about 0.1, 0.2, and 0.25, respectively. This increment results from an increase in the ow velocity in the airways and more penetration of the particles into the depth of the respiratory system. Moreover, it is obvious that by increasing the tidal volume, the dierence between total deposition in a single cycle and the cycle that has reached the quasi-steady state increases. By increasing the tidal volume, the air entering the alveoli increases and more particles enter the alveoli. Consequently, more particle mass fraction is involved in the alveolar mixing. Considering that the alveolar mixing is the main reason for the dierence between a single cycle and the cycle in the quasi-steady state, it is clear that this dierence widens with an increase in the tidal volume, leading to the increment of the alveolar mixing.
The increment of deposition per cycle in the quasi-steady state compared to a single cycle is shown in Figure 6 for three tidal volumes. The following facts can be inferred from the gure. For a tidal volume of 500 ml that corresponds to the breathing at rest, in the quasi-steady state, the deposition increment is obvious for the particles between 0.2 and 1 m; at the maximum, it reaches 5.7% for the 0.5 m particles. For tidal volumes of 1000 and 1500 ml, the maximum increment corresponds to 0.5 m particles and equals 12.4% and 15.5%, respectively. Moreover, it can be inferred that by increasing the tidal volume from 500 to 1500 ml, the particle size range that shows the dierence between the two mentioned states expands from 0.2 to 1 m corresponding to 500 ml and from 0.07 to 2 m corresponding to 1500 ml. This occurs because as the tidal volume increases, the alveolar mixing becomes more important and more particle sizes are engaged.
To evaluate the dierence between the results of geometric models, a comparison is made between the
Figure 6. Deposition per cycle increment.
results of the present study{done based on a 5-lobe symmetric geometric model{and the results according to MPPD©v2.1 software. MPPD©v2.1, whose name
is an acronym for \Multiple-Path Particle Dosimetry", was developed by Applied Research Associates, Inc. (ARA) in 2009. This software has the capability to calculate the total, lobar, regional and generational particle deposition in the dierent geometric models in the respiratory system during a respiratory cycle. For the sake of our purpose, this program is run based on two geometric models: the proposed 5-lobe symmetric model and the stochastic geometric model. Figure 7 shows the results of total deposition in a single cycle for a tidal volume of 1000 ml, which is quite close to the daily outdoor physical activity state for the two models by MPPD and the present study based
Figure 7. Total deposition fraction for the dierent geometric models.
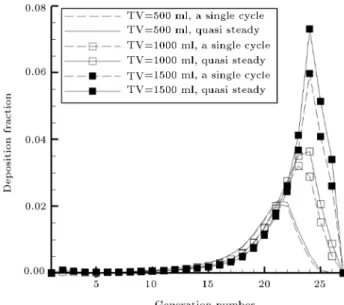
on the 5-lobe model. It can be observed that the results are quite in agreement. The dierence in the total deposition between the present study and the stochastic model by MPPD reaches 16% at most and pertains to 0.6 m particles. On the other hand, the dierence between the present study and the 5-lobe model by MPPD is of a lower percentage. Therefore, this investigation illustrates that a good estimate of the eect of successive respiratory cycles on the particle deposition can be achieved based on a 5-lobe symmetric model without any unacceptable deviation from the results of the more realistic stochastic geometric model. Figure 8 shows a comparison of the deposition and the generation number between a single cycle and the cycle after that reaches a quasi-steady state for three tidal volumes and 0.5 m particles. It is obvious that the deposition per cycle in the quasi-steady state is slightly more than that in a single cycle. This dierence is more sensible in the case of the last generations, because the alveolar mixing happens in the last generations that are connected to the alveoli. Therefore, the eect of the successive cycles is more obvious in the last generations. In addition, it can be seen that the maximum deposition generation number increases with an increase in the tidal volume because of the greater penetration of particles into the respiratory tract. Besides, for a tidal volume of 500 ml, it can be observed that there is a little dierence between a single cycle and the cycle in the quasi-steady state; by increasing the tidal volume, this dierence widens due to the greater mass fraction of particles that reach the alveoli, where the alveolar mixing occurs.
Besides the mixing factor, the other parameter that has a role in the dierence between the cycle in the quasi-steady state and a single cycle is the remaining
Figure 8. Deposition fraction versus generation number (0.5-micron particles).
Figure 9. Remaining mass fraction at the end of cycles (500 ml of tidal volume).
mass fraction of particles in the respiratory tract at the end of each respiratory cycle. Considering the whole particles mass entering the respiratory system, part of it is deposited, part of it totally exits the respiratory system during the exhalation, and nally part of it remains suspended in the respiratory tract after the exhalation due to the delayed exit from the alveoli after the main wave of the particles, caused by the alveolar mixing. This remaining part increases the deposition per cycle in the next respiratory cycles. In the present study, as mentioned before, it is supposed that, at the beginning of the rst respiratory cycle, the respiratory tract is totally empty of particles. At the end of the rst cycle, some particle mass fraction remains in the respiratory tract. At the end of the second cycle, this remaining mass amount, somewhat increases. After a few cycles, in the quasi-steady state, the remaining mass fraction after each cycle reaches a constant value. Figure 9 shows the total remaining mass fraction in the respiratory system for a tidal volume of 500 ml at the end of the successive respiratory cycles. It can be observed that, for this tidal volume, at the end of the rst respiratory cycle, the maximum remaining mass fraction corresponds to 0.5 m particles and equals 0.011 fraction of the total entered particle mass. As is depicted in the gure, following the successive cycles that have reached the quasi-steady state, the aforementioned fraction value reaches about 0.022 of the total entered mass.
Variations in the tidal volume can also change the amount of the remaining mass fraction at the end of the cycles in the quasi-steady state. Figure 10 shows the total remaining mass fraction at the end of the cycles in the quasi-steady state for three values of the tidal volume. As is shown in the gure, the increment of the tidal volume can increase the remaining mass
frac-Figure 10. Remaining mass fraction in the quasi-steady state.
tion due to stronger alveolar mixing. The maximum remaining mass fraction that increases from 0.02 for 500 ml tidal volume to 0.06 for 1500 ml tidal volume corresponds to 0.5 m particles. It is shown that, for this particle size, none of the deposition mechanisms is strong enough to prevent the particles from reaching the alveolar region.
Besides the total remaining mass fraction, it is important to investigate the remaining mass fraction versus the generation number. Figure 11 shows the generational remaining mass fraction after the succes-sive cycles for a tidal volume of 500 ml and a particle size of 0.5 m. It can be seen that, by passing the successive cycles and getting close to the quasi-steady state, the generational remaining mass fractions
Figure 11. Generational remaining mass fraction at the end of cycles (0.5 m particles, TV = 500 ml).
Table 1. The most required cycles to reach the quasi-steady state.
Tidal volume
(ml)
The most needed
cycles
Corresponding particle size
(m)
500 2 0.4-0.9
1000 4 0.5
1500 5 0.5-0.6
approach a certain prole. A maximum can be detected in this graph for the quasi-steady state. This maximum occurs at the 21st generation. As mentioned earlier, the alveolar mixing that is responsible for the dierence between a single cycle and that cycle in the quasi-steady state occurs in the last generations that are connected to the alveoli. Therefore, this is due to the strong eect of the alveolar mixing in this region. Of note, for the generational deposition fraction, the maximum appeared at the 21st generation, too.
Table 1 shows a large number of cycles required to reach the quasi-steady state and their corresponding particle sizes for three values of the tidal volume.
The criterion for reaching the quasi-steady state is considered when the total deposition fraction changes by less than 1% during a respiratory cycle. For medium-sized particles, a few respiratory cycles are required to reach the quasi-steady state. According to Table 1, by increasing the tidal volume, the number of needed cycles increases. This is due to the increment of the alveolar mixing. The highly required number of cycles corresponding to the particles around 0.5 m are 2, 4, and 5 cycles for the tidal volumes of 500, 1000, and 1500 ml, respectively.
According to Figure 10, it can be inferred that, for particles larger than 2 m and particles smaller than 0.05 m, calculations can always be carried out based on a single cycle with great precision, because the eect of successive cycles is practically zero for these particles. This occurs because, for these particles, the deposition mechanisms are so strong that can prevent the particles from reaching the alveolar region and taking part in the alveolar mixing. Fortunately, most of the aerosolized medications, such as the inhalers and the nebulizers, mainly work in the particle size range of 1 m and larger. Therefore, for the calculations corresponding to these medical equipment pieces, we can safely use the results of a single cycle with enough precision and no excess computational cost is necessary. To assess the sensitivity of the results to the amount of mixing fraction, total deposition fraction per cycle in the quasi-steady state is depicted in Figure 12 for dierent values of the mixing fraction. In this gure, total deposition fraction for the tidal volume of 1000 ml is assessed with dierent values of mixing factors varying from 0 (no mixing) to 1 (perfect mixing). For this amount of the tidal volume, the
Figure 12. Total deposition per cycle for the dierent mixing factors and TV = 1000 ml.
variation of the mixing factor from 0.25 to 1, at most, increases the deposition fraction by 12% and 25%, respectively, pertaining to 0.5 m particles; further to that, for the other amounts of particle sizes, this increment is less. It is obvious that the amount of the mixing factor is not so eective such that a variation makes a signicant dierence in the deposition fraction of too large or too small particles. This is another verication of the claim that the eect of successive cycles is negligible for large and small particles and is partly sensible for the medium-sized particles.
4. Conclusion
In this study, the particle deposition in the respira-tory system during the successive respirarespira-tory cycles was modeled. A 5-lobe symmetric geometric model was used, and the deposition formulas were applied according to dierent researchers to calculate the de-position fraction in each airway. Although the model did not fundamentally capture the physics of particle deposition process, its results were in good agreement with the experimental data. For three tidal volumes of 500, 1000, and 1500 ml and for particle sizes ranging from 1 nm to 10 m, the calculations were done and the results were extracted. The results of this work showed that, for dierent particle sizes and dierent values of tidal volume, a few cycles were required for deposition fraction to reach a quasi-steady state. Moreover, the comparison of the results of the present study for total deposition fraction and those of MPPD© v2.1 software showed that the dierence between the proposed 5-lobe model and the more realistic stochastic model was not unacceptable. This dierence for the typical tidal volume of 1000 ml turned out to be at most 16%. Thus, in this study, a model was developed
to make a good estimate of the eect of successive respiratory cycles on the total and generational particle deposition, though a 5-lobe symmetric model was used. The dierence between the cycle in the quasi-steady state and a single respiratory cycle resulted from the alveolar mixing and the remaining mass fraction at the end of each respiratory cycle. The results showed that, for particles smaller than 0.05 m and particles larger than 2 m, for all values of the tidal volumes, the remaining mass fraction was negligible due to the high deposition fraction, and the results of successive respiratory cycles were not dierent from those of a single cycle. For particles between 0.05 and 2 m, due to the high penetration of the particles into the alveolar region, there was a dierence between a single cycle and the cycle in the quasi-steady state. The maximum dierence appeared at a particle size of 0.5 m; as for this particle size, none of the deposition mechanisms was strong enough to avoid the particles to reach the alveolar region and became engaged in the alveolar mixing. For this particle size, the total deposition fraction in the cycle in the quasi-steady state was about 6, 12, and 16% greater than that in a single cycle for the tidal volume of 500, 1000, and 1500 ml, respectively. On the other hand, for low values of the tidal volume, due to the lower fraction of the particles reaching the alveolar region and weak alveolar mixing, the calculations of the cycle in the quasi-steady state were negligibly dierent from those of a single cycle; at high tidal volumes, this dierence became signicant. Therefore, keeping the aforementioned results in mind, for a wide range of applications, the results based on a single cycle can be used with reasonable accuracy to avoid unnecessary computational costs.
References
1. Yeh, H.-C. and Schum, G. \Models of human lung airways and their application to inhaled particle de-position", Bulletin of Mathematical Biology, 42, pp. 461{480 (1980).
2. Koblinger, L. and Hofmann, W. \Monte Carlo mod-eling of aerosol deposition in human lungs. Part I: Simulation of particle transport in a stochastic lung structure", Journal of Aerosol Science, 21, pp. 661{ 674 (1990).
3. Hofmann, W. and Koblinger, L. \Monte Carlo mod-eling of aerosol deposition in human lungs. Part III: Comparison with experimental data", Journal of Aerosol Science, 23, pp. 51{63 (1992).
4. Koblinger, L. \Analysis of human lung morphometric data for stochastic aerosol deposition calculations", Physics in Medicine and Biology, 30, p. 541 (1985).
5. Koblinger, L. and Hofmann, W. \Aerosol deposition calculations with a stochastic lung model", Acta Phys-ica HungarPhys-ica, 59, pp. 31{34 (1986).
6. Koblinger, L. and Hofmann, W. \Monte Carlo model
for aerosol deposition in human lungs", Annals of Occupational Hygiene, 32, pp. 65{70 (1988).
7. Dastanpour, R., Monjezi, M., Saidi, M.S., and Pishe-var, A. \Applying a realistic novel ventilation model based on spatial expansion of acini in a stochastic lung", Scientia Iranica, Transactions B, Mechanical Engineering, 21, p. 358 (2014).
8. Monjezi, M., Dastanpour, R., Saidi, M.S., and Pi-shevar, A. \Prediction of particle deposition in the respiratory track using 3D-1D modeling", Scientia Iranica, 19, pp. 1479{1486 (2012).
9. Georgakakou, S., Gourgoulianis, K., Daniil, Z., and Bontozoglou, V. \Prediction of particle deposition in the lungs based on simple modeling of alveolar mixing", Respiratory Physiology & Neurobiology, 225, pp. 8{18 (2016).
10. Asgharian, B. and Price, O.T. \Deposition of ultra-ne (nano) particles in the human lung", Inhalation Toxicology, 19, pp. 1045{1054 (2007).
11. Raabe, O., Yeh, H.-C., Schum, G., and Phalen, R.F., Tracheobronchial Geometry: Human, Dog, Rat, Hamster (1976).
12. Salma, I., Furi, P., Nemeth, Z., Balashazy, I., Hof-mann, W., and Farkas, A. \Lung burden and de-position distribution of inhaled atmospheric urban ultrane particles as the rst step in their health risk assessment", Atmospheric Environment, 104, pp. 39{ 49 (2015).
13. Weibel, E.R., Sapoval, B., and Filoche, M. \Design of peripheral airways for ecient gas exchange", Respira-tory Physiology & Neurobiology, 148, pp. 3{21 (2005).
14. Ochs, M., Nyengaard, J.R., Jung, A., Knudsen, L., Voigt, M., Wahlers, T., Richter, J., and Gundersen, H.J.G. \The number of alveoli in the human lung", American Journal of Respiratory and Critical Care Medicine, 169, pp. 120{124 (2004).
15. Inthavong, K., Choi, L.-T., Tu, J., Ding, S., and Thien, F. \Micron particle deposition in a tracheobronchial airway model under dierent breathing conditions", Medical Engineering & Physics, 32, pp. 1198{1212 (2010).
16. Tian, G., Longest, P.W., Su, G., Walenga, R.L., and Hindle, M. \Development of a stochastic individual path (SIP) model for predicting the tracheobronchial deposition of pharmaceutical aerosols: eects of tran-sient inhalation and sampling the airways", Journal of Aerosol Science, 42, pp. 781{799 (2011).
17. Henry, F. and Tsuda, A. \Radial transport along the human acinar tree", Journal of Biomechanical Engineering, 132, p. 101001 (2010).
18. Shang, Y., Inthavong, K., and Tu, J. \Detailed micro-particle deposition patterns in the human nasal cavity inuenced by the breathing zone", Computers & Flu-ids, 114, pp. 141{150 (2015).
19. Shi, H., Kleinstreuer, C., and Zhang, Z. \Dilute suspension ow with nanoparticle deposition in a representative nasal airway model", Physics of Fluids (1994-present), 20, p. 013301 (2008).
20. N. C. o. R. Protection, Measurements. (National Coun-cil on Radiation Protection and Measurements) (1997).
21. Golshahi, L., Noga, M., Vehring, R., and Finlay, W. \An in vitro study on the deposition of micrometer-sized particles in the extrathoracic airways of adults during tidal oral breathing", Annals of Biomedical Engineering, 41, pp. 979{989 (2013).
22. Hinds, W.C. \Uniform particle motion", In Aerosol Technology: Properties, Behavior, and Measurement of Airborne Particles, 2nd Edn., pp. 48{51, Wiley-Interscience Pub., New York, USA (1982).
23. Xi, J. and Longest, P.W. \Eects of oral airway geometry characteristics on the diusional deposition of inhaled nanoparticles", Journal of Biomechanical Engineering, 130, p. 011008 (2008).
24. Yu, C., Diu, C., and Soong, T. \Statistical analysis of aerosol deposition in nose and mouth", The American Industrial Hygiene Association Journal, 42, pp. 726{ 733 (1981).
25. Salma, I., Balashazy, I., Hofmann, W., and Zaray, G. \Eect of physical exertion on the deposition of urban aerosols in the human respiratory system", Journal of Aerosol Science, 33, pp. 983{997 (2002).
26. Salma, I., Balashazy, I., Winkler-Heil, R., Hofmann, W., and Zaray, G. \Eect of particle mass size dis-tribution on the deposition of aerosols in the human respiratory system", Journal of Aerosol Science, 33, pp. 119{132 (2002).
27. Zhang, Z., Kleinstreuer, C., and Kim, C.S. \Airow and nanoparticle deposition in a 16-generation tra-cheobronchial airway model", Annals of Biomedical Engineering, 36, pp. 2095{2110 (2008).
28. Goo, J. and Kim, C.S. \Theoretical analysis of parti-cle deposition in human lungs considering stochastic variations of airway morphology", Journal of Aerosol Science, 34, pp. 585{602 (2003).
29. Cohen, B.S., Sussman, R.G., and Lippmann, M. \Ul-trane particle deposition in a human tracheobronchial cast", Aerosol Science and Technology, 12, pp. 1082{ 1091 (1990).
30. Asgharian, B., Hofmann, W., and Bergmann, R. \Particle deposition in a multiple-path model of the human lung", Aerosol Science & Technology, 34, pp. 332{339 (2001).
31. Choi, J.-I. and Kim, C.S. \Mathematical analysis of particle deposition in human lungs: an improved single path transport model", Inhalation Toxicology, 19, pp. 925{939 (2007).
Appendix A Flowcharts
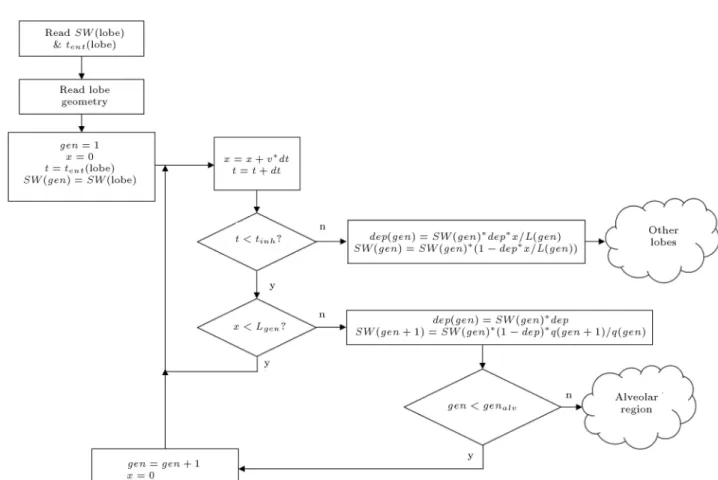
The owcharts are presented in this section. Fig-ure A.1. shows the deposition calculation owchart in a tracheobronchial airway of a typical lobe, and Figure A.2. shows the deposition calculation owchart
Figure A.2. Deposition calculation owchart in an alveolar airway of a typical lobe.
in an alveolar airway of a typical lobe. Their details are presented in the main text.
Biographies
Hossein Nemati received his BSc degree in Me-chanical Engineering specializing in Heat and Fluids from University of Isfahan, Isfahan, Iran in 2013 and MSc degree in Mechanical Engineering specializing in Energy Conversion from Sharif University of Technol-ogy, Tehran, Iran in 2016. His research interests are biological uid mechanics, biological modeling, aerosol technology, and computational uid dynamics. Mohammad Said Saidi is a Professor of Mechan-ical Engineering at Sharif University of Technology, Tehran, Iran. His research interests include, but not
limited to: CFD, micro and macro multiphase ows in human body, experimental design and mathematical modeling of microuidic systems, and transport of nano and microscale aerosol particles. He earned his PhD in 1978 from M.I.T., USA.
Vahid Hosseini is an Associate Professor of Mechan-ical Engineering at Sharif University of technology. He is working in the eld of combustion, internal combus-tion engine, and combuscombus-tion generated nanoparticles and their health eects. He is also active in the eld of air pollution studies ranging from atmospheric modeling to emission inventory and emission factor measurements. He earned his PhD from University of Alberta, Canada in 2008 and worked as a Researcher at the National Research Council of Canada before joining Sharif University.