TRANSIT ORIENTED DEVELOPMENT IN CHAPEL HILL’S NORTH-SOUTH CORRIDOR
Potential for Development around Bus Rapid Transit Corridor
by
Phillip P Hanson
A Masters Project submitted to the faculty of the University of North Carolina at Chapel Hill
in partial fulfillment of the requirements for the degree of Master of City and Regional Planning
in the Department of City and Regional Planning
Chapel Hill
2015
Approved by:
___________________________________________________________________________________
1
Phil Hanson
University of North Carolina
Department of City and Regional Planning
Master’s Project
TRANSIT ORIENTED DEVELOPMENT
IN CHAPEL HILL’S NORTH-SOUTH
CORRIDOR
2
Table of Contents
Executive Summary... 3
Project Purpose and Description ... 4
Background ... 4
Defining Transit-Oriented Development ... 4
Role of Transit in Land Development ... 6
Case Study – Eugene, OR ... 8
Health Benefits of TOD ... 9
Local Context ... 10
Land Development Analysis ... 11
Study Area ... 11
Methods... 12
Statistical Estimation of Current Development Levels ... 12
Zoning Scenarios ... 13
Land Development Analysis ... 14
Sensitivity Analysis ... 15
Results ... 16
Baseline – Current Zoning ... 16
Scenario One – Mixed Use Village ... 17
Scenario Two – Transit Oriented Development “Low”... 17
Scenario Three – Transit Oriented Development “High” ... 18
Sensitivity Analysis ... 18
Discussion and Limitations ... 19
Implications and Conclusions ... 20
Appendix A – Maps ... 23
Appendix B – Regression Models ... 43
Appendix C – Sensitivity Analysis Results ... 46
3
Executive Summary
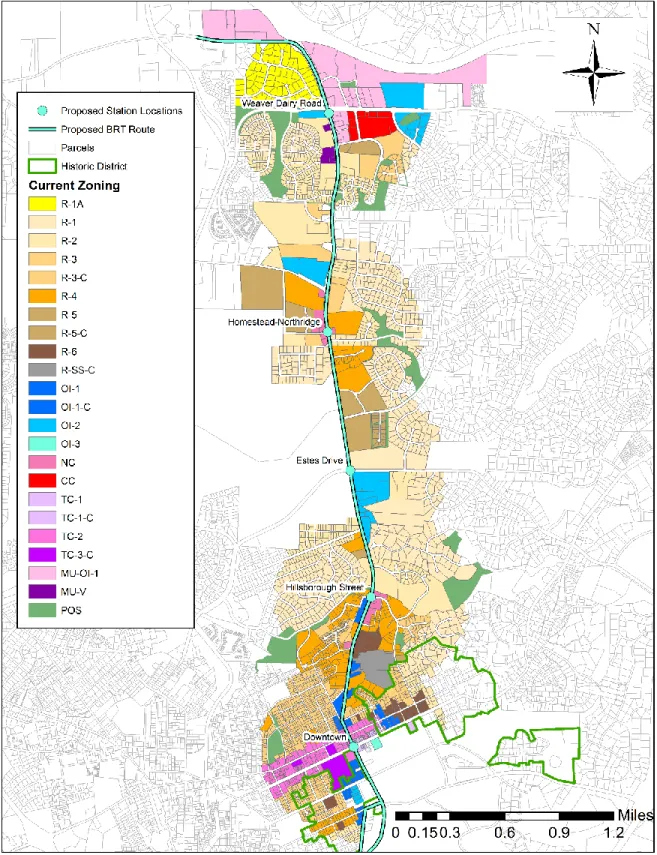
Transit-oriented development (TOD) in Chapel Hill presents an opportunity for the Town to capitalize on the future investment in transit improvements to the North-South Corridor. Chapel Hill Transit is currently completing a study of transit improvement alternatives for the Corridor, which runs from Southern Village north to Eubanks Road, following 15-501, Columbia Street, and Martin Luther King Jr. Boulevard. As one of the most heavily traveled corridors in the Town, and one of the most quickly developing, projected demand for transit service in the corridor is likely to require significant investment in the next 15-20 years. One alternative for improvements to the corridor is to implement a bus rapid transit (BRT) system, creating dedicated transit stations for a bus route running in dedicated lanes. The locally-preferred alternative for Chapel Hill may involve some or all of the traditional
characteristics of BRT. This study assumes that the creation of a BRT system is approved using currently proposed station locations.
Investment in BRT, although less studied than light rail or other transit alternatives, is likely to spur further development in the North-South Corridor. In order to properly control and capitalize on that development, the Town of Chapel Hill must consider implementation of transit-oriented
development zoning policies. TOD is intended to create dense, walkable, and mixed-use districts that are supportive of and connected to public transit. This produces both the effect of increasing transit use and encouraging development of the land surrounding transit stations. TOD has additional public benefits of creating a health-promoting environment that encourages physical activity and social interaction.
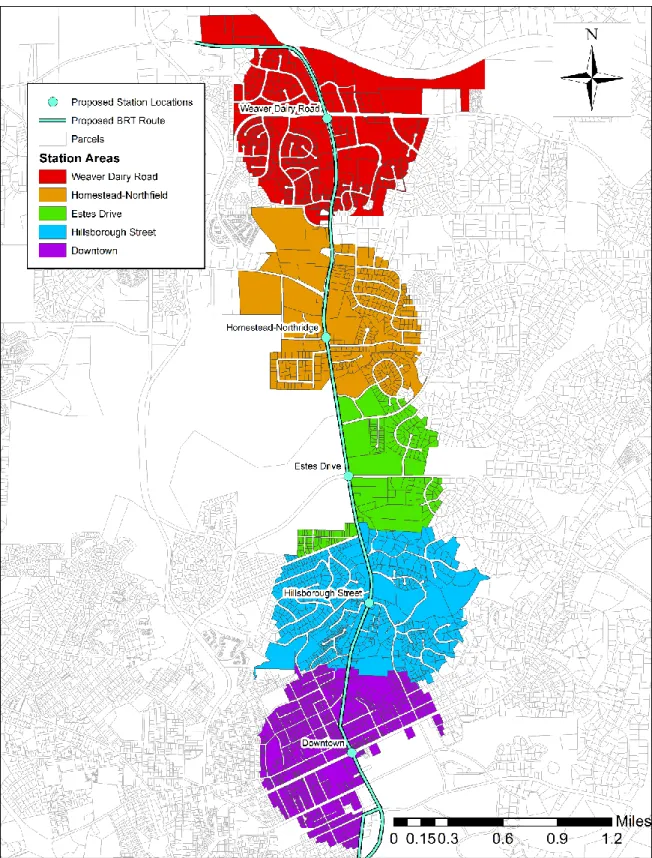
In order to project the impacts of that development in the North-South Corridor, this study was undertaken with the support of the Town of Chapel Hill and Chapel Hill Transit to demonstrate the potential effects of multiple TOD zoning scenarios. These scenarios were modeled around five proposed station locations, from Franklin Street to Weaver Dairy Road. The outputs of this analysis are potential increases in capacity for development (in square feet of built space), the value of that development, and the Town’s additional tax revenues.
This study demonstrated that significant development potential exists in the North-South Corridor under every scenario studied. Tax revenues to the Town, upon full development of TOD in 20 years and under a conservative estimation, are likely to fall between $20 to $25 million. Research and practice concerning the implementation of BRT systems and their impacts on development in the United States is limited, especially for communities comparable to Chapel Hill.
4
Project Purpose and Description
The purpose of this project is to study the impacts of implementing transit-oriented
development zoning at proposed station areas for a future bus rapid transit (BRT) route along the South Corridor in Chapel Hill. The results of the study will help to inform planning efforts in the North-South Corridor by modeling multiple transit-oriented development (TOD) scenarios. The objectives of the proposed study are three-fold:
1) To analyze the development potential of select BRT station areas assuming the preservation of current zoning.
2) To propose potential TOD zoning districts for select station areas based on review of current research and practice.
3) To model development scenarios to demonstrate potential impacts of rezoning station areas for transit oriented development.
In order to adequately promote development and increase property values along the BRT corridor, establishing supportive public policy will be critical for the Town of Chapel Hill. Existing zoning in Chapel Hill is not likely to promote the density and mix of uses that would support and capitalize on the implementation of a BRT system. This project attempts to contribute to the development of potential TOD zoning districts within the North-South Corridor that would promote economic
development. This report is intended to inform the Town of Chapel Hill’s Planning Department, Town Council, and the public, and is not intended to specifically contribute to the research literature in transit planning and TOD. However, the development of the proposed TOD models are based as much as possible in current literature and practice.
Background
Defining Transit-Oriented Development
The task of defining transit-oriented development is not a simple one. Definitions vary
considerably between agencies, and these definitions have varied over time. Early TODs failed to truly integrate transit with surrounding land uses, and are now referred to as transit-adjacent developments (TAD) (Dittmar, 2004). While TADs typically promoted higher densities, there is little consideration given to site design or station access, and they ultimately lacked a connection between development and transit. That connection is not simple to achieve, however. Some examples of recent TOD development have been called transit adjacent rather than transit oriented by experts in the field, leading to a greater desire to define TOD more clearly (Cervero et al., 2004). The context-specific nature of TOD makes this difficult, but a few features have risen to the top as accepted components of TOD.
In Connecticut, TOD is legally defined as “the development of residential, commercial and employment centers within one-half mile or walking distance of public transportation facilities, including rail and bus rapid transit and services, that meet transit supportive standards for land uses, built
5
as “infrastructure improvements that are located within one-half mile of a transit station or transit-oriented facility that promotes transit ridership or passenger rail use” (Shinkle, 2012). These definitions vary widely across their focus on the pedestrian environment, the inclusion of land use mix
requirements, the size of the area, and even requirements of minimum investment.
In an effort to provide a more concrete and universal framework for TOD than the disparate legal definitions of states, municipalities, and transit agencies, the Center for Transit-Oriented Development (CTOD) has advanced a definition of TOD. According to CTOD, TOD is “a type of community development that includes a mixture of housing, office, retail, and/or other commercial development and amenities integrated into a walkable neighborhood and located within a half-mile of quality public transportation” (Center for Transit-Oriented Development, 2014). A few key
characteristics are true of any TOD: 1) there is a mix of uses that locates residences near employment locations, services, and amenities, 2) public transportation is centrally featured and accessible from the entire area 3) design elements promote pedestrian activity/walkability, and 4) the area typically features a higher density than surrounding development to encourage the use of the transit system (Belzer et al., 2006; Freilich, 1999). These characteristics have come to be accepted by many as the core elements of TOD, but there is likely still debate to be had about whether current and future TOD projects will meet these criteria.
While the CTOD uses a half-mile as the maximum distance from transit to define TOD, and it is generally accepted as the standard practice, there is some dispute about what distance is appropriate for TOD implementation. The half-mile standard has become accepted primarily because it corresponds to the distance someone can walk in 10 minutes, at a speed of 3 miles per hour (Guerra, Cervero, & Tischler, 2012). In a study of 832 heavy rail (HRT), 589 light rail (LRT), and 36 bus rapid transit stations, Guerra et al. found very little impact of distance from transit on predicting ridership (2012). However, when predicting ridership based on the proximity of jobs and population, they found that “a quarter-mile radius best predicts ridership as a function of jobs, while the half-quarter-mile radius works best for population” (Guerra, Cervero, & Tischler, 2012). The study notes that “this is far from definitive and researchers should continue to test the appropriate boundaries when possible,” but it does point to a potentially useful concept for municipalities seeking to implement TOD (Guerra, Cervero, & Tischler, 2012). The authors do not go so far as to suggest that these results should inform specific approaches to planning for TOD, but their results do raise an important consideration for transit station planning in areas planned for significant redevelopment. If planners are able to use TOD planning to design (or redesign) the land use of a station area, there may be a benefit to concentrating job-creating uses such as office and commercial in the quarter-mile “core” of the station area, and promoting higher levels of residential use within the quarter- to half-mile band on the perimeter. Of course, a mix of uses
throughout the area is critical to creating true transit-oriented development, and the results of this one paper are not enough to generalize to all TOD planning efforts, but they highlight areas for additional consideration.
6
is able to be established through that planning process, rather than determined by existing
development. The CTOD has defined several “TOD Place Types” in their station area planning guide: Regional Center, Urban Center, Suburban Center, Transit Town Center, Urban Neighborhood, Transit Neighborhood, and Special Use/Employment District (Center for Transit-Oriented Development, 2008). Each of these place types has specific characteristics, such as a predominance of certain land uses, the frequency of transit service, density, and types of retail and employment available (Center for Transit-Oriented Development, 2008). Using these place types as a starting framework, planners implementing prospective TOD can design station areas to meet the needs and vision of their community.
Role of Transit in Land Development
As the number of public transit trips taken in the United States continues to rise each year, and demand for housing within walking distance of transit is projected to grow from 6 million households in 2000 to 16 million in 2030, municipalities across the country have begun to promote increased transit service to meet this demand (American Public Transit Association, 2014; Belzer et al., 2006). Public transit has served an important role in providing access to employment for many years. As the form of cities has shifted away from a concentration of employment in the central business district, sprawl and suburbanization have created new and dispersed employment centers (Belzer et al., 2011).
This movement of jobs away from the cores of cities has required that public transit serve a larger land area and greater number of destinations. However, the access provided by transit also helps to shape the growth and location of employment centers. Policies such as transit-oriented development (TOD) have increasingly been implemented in order to both serve existing employment corridors and promote density around transit corridors to diminish the effects of sprawl (Belzer et al., 2011). However, transit does not attract all forms of employment equally. Even across transit corridors, the density of development affects the type of employment attracted. “Knowledge-based industries compose 45 percent of jobs in transit zones with very high employment density, compared to only 15 percent in very low density transit areas” (Belzer et al., 2011).
Research literature also demonstrates that transit service produces higher land values in the surrounding area, in particular when combined with supportive public policy and when transit provides an alternative for highly congested traffic (Fogarty, Eaton, Belzer, & Ohland, 2008). A report by the National Conference of State Legislatures cites the development of 10,000 housing units and 5.4 million square feet of office and retail space within two blocks of a streetcar line within ten years of its
completion, totaling an investment of $3.5 billion (Shinkle, 2012). In many areas, the supportive policies that allow for this kind of development take the form of transit-oriented development. Because
consumers are expressing greater preference for higher density and mixed use, urban style housing with access to transit, implementation of quality TOD zoning around a strong transit system will help to promote development that will meet that demand, that will generate higher tax revenues for local governments (Fogarty et al., 2008).
7
100 feet from the station to as large as a half mile from the station, and the premiums found ranged from 1% to 167% (Fogarty, Eaton, Belzer, & Ohland, 2008). Additionally, the majority of these studies focused on light rail or commuter rail systems, and predominantly in large cities with well-established transit networks. There is certainly reason for hesitation when using these outcomes to predict another municipality’s potential premium, especially for a BRT system.
Of the studies summarized in CTOD’s report, three studied a half-mile area, and five studied a quarter mile area, with the remaining studies focusing on areas of 100 to 1,000 feet from stations. Of these studies within a quarter- and half-mile radius, all studied light rail or rapid transit, and none studied the impacts of BRT. Available studies on BRT’s property value premium have primarily been conducted in Bogotá, Colombia. Across five studies performed in Bogotá, four found a premium to property values related to proximity to the BRT system, including a range of 6.8% - 9.3% for residential properties for every five minutes walking time closer to a BRT station, and between 15% and 20% for properties near BRT relative to control areas (Rodriguez & Mojica, 2008; Rodriguez & Mojica, 2009; Munoz-Raskin, 2010, Rodriguez & Targa, 2004; Perdomo et al., 2007; Cervero & Duncan, 2002). The applicability of these studies to Chapel Hill is limited due to the dramatic differences in size,
demographics, and culture between Chapel Hill and Bogotá, but there is certainly promise that BRT can be an effective tool for increasing property values in the surrounding area.
Robert Cervero and his colleagues outlined three factors that impact the potential premiums of TOD on property values; 1) good economy and healthy real estate conditions, 2) supportive public policy, and 3) traffic congestion (2004). Considering these three factors in the context of Chapel Hill, the case could well be made that the economy is improving quickly and the real estate market has seen an increase in demand, as development continues to increase across the Town. While traffic is certainly a concern in certain corridors, particularly along 15-501/Fordham and the NC 54 corridors, it is less of a concern along the Martin Luther King Jr. Boulevard corridor, where the proposed BRT will be
8
Case Study – Eugene, OR
The case of Eugene, Oregon provides perhaps the best comparison to Chapel Hill for this study. The City of Eugene had an estimated population of 159,190 people in 2013, approximately 100,000 more than Chapel Hill (U.S. Census Bureau, 2013c). However, compared to most other communities which have implemented BRT, Eugene is quite small and similar to Chapel Hill. Also similar to Chapel Hill, Eugene is home to the University of Oregon, a large public university, and is constrained by an urban growth boundary. Currently, both municipalities have no rail transit, although a LRT system is currently in the planning stages to connect Chapel Hill with its neighbor Durham. All in all, Eugene provides a good example for implementation of both BRT and TOD.
Eugene completed the Emerald Express (EmX) BRT system in 2007, with routes connects downtown Eugene with Springfield, Oregon and extending north-south from the Springfield Station to the Sacred Heart Medical Center (Nelson, 2013). Along 60% of its route, the EmX system has dedicated bus lanes (Nelson, 2013). A recent analysis of economic impacts of the EmX system found that from 2004 to 2010 (three years before and three years after completion of the first route connecting Eugene and Springfield) employment increased by approximately 10% within a quarter mile of the station areas, remained stable between a quarter mile and half mile of station areas, and fell by approximately 5% outside of the half mile radius of station areas (Nelson, 2013). This is notable in particular because of the timing of this research, as the recession of 2008-2009 caused significant job losses in the metropolitan area, but the results of the analysis show that jobs were maintained and returned to areas more proximal to the BRT route.
Nelson et al. went on to study the shift in types of employment within the BRT station areas. Although their findings were somewhat mixed, the analysis showed that certain employment sectors “appear to be attracted to BRT station areas as a whole, although especially within 0.25 miles of a station. These include Retail Trade, Transportation and Warehousing, Finance and Insurance, Real Estate and Rental & Leasing, and other services” (Nelson, 2013). They also found that while 710 jobs shifted into the half mile buffer of the station area, but only 12 of those jobs fell in the quarter mile to half mile band, indicating that jobs attracted to the BRT line were highly attracted to locate within close proximity (Nelson, 2013). Further, a recent report on development impacts of transit corridors also found that Eugene has seen an investment of $3.96 in development for every dollar invested in the transit system (Institute for Transportation & Development Policy, 2013). While Eugene’s return on their transit investment lags well behind top performers like Cleveland’s HealthLine ($114.54 of development per dollar spent on transit), it is comparable to the $3.74 per dollar of Portland’s MAX Blue Line LRT and the $3.59 per dollar of Pittsburgh’s Martin Luther King, Jr. East Busway, an even outperforms the Los Angeles Orange Line BRT, which has seen only $0.83 of development per dollar spent on transit (Institute for Transportation & Development Policy, 2013).
The impact of TOD zoning was not directly studied as part of Nelson et al.’s analysis, but the implementation of TOD is part of their recommendations, and seems to be implicit in their
9
Health Benefits of TOD
It should be noted that the benefits of TOD extend beyond increases in ridership, transit revenues, and economic development. Health impacts of TOD are increasingly documented, and should not be ignored as a motivator for implementing robust TOD systems. Many of the health benefits of TOD are directly related to transit use, as research has found that users of transit walk a median of 19
minutes for transit-related activities, and 29% of transit users meet or exceed the recommendation of 30 or more minutes of daily physical activity just as part of their walking to and from transit (Besser & Dannenberg, 2005). Many transit trips begin and end with walking trips, but it is certainly the case in many transit systems that passengers may drive to transit and only have to walk a short distance from their car to access transit. The supportive land uses and pedestrian or bicycle improvements that are central to TOD are likely to encourage more users of transit to walk to and from transit.
A study of the impacts of the LRT system in Charlotte, NC found that use of the LRT was correlated with a decrease in body mass index (BMI) and a decrease in the odds of becoming obese, while controlling for characteristics such as race, education, employment, and existing neighborhood conditions (MacDonald, Stokes, Cohen, Kofner, & Ridgeway, 2010). Two recent reviews of the research literature have focused on the physical activity impacts of urban design and land use policies, and found that density, mix of uses, connected sidewalks, and safety and aesthetic improvements were related to significant increases in physical activity (Guide to Community Preventive Services, 2004; Saelens & Handy, 2008). Local planners implementing TOD zoning and design guidelines should work to create not only the density desired to support new development, but also the improvements to pedestrian
infrastructure, traffic calming measures, aesthetic improvements, and mix of uses that will encourage an active and vibrant district. If successfully implemented, residents, employees, and users of transit are likely to see the health benefits of increased physical activity.
While there are concerns over whether these built environment and transit improvements are changing the behavior of sedentary individuals, or simply attracting previously active individuals to locate in these areas, there is growing evidence that the environment impacts physical activity of local residents. However, there is also evidence that the investment in transit and TOD in many communities has sparked gentrification as property values around transit rise (Kahn, 2007). As low income individuals are priced out of station areas, they lose access to the many benefits provided by a mixed-use
pedestrian-friendly environment. In Saint Paul, Minnesota, a health impact assessment of the proposed TOD policies for their Central Corridor LRT ultimately resulted in five policy recommendations “to ensure equity and the maximization of positive healthy outcomes,” three of which specifically promoted the development of affordable housing through inclusionary zoning, density bonuses, and writing a
commitment to housing diversity in the zoning ordinance (Malekafzali, & Bergstrom, 2011). If the health and economic benefits of TOD are to be shared by low- and high-income populations alike, these types of policies will be critical to incorporate in local TOD plans.
10
natural gas or hybrid diesel fuel systems (Vincent & Jerram, 2006). These reductions in emissions benefit not only the local community’s air quality but also the global effort to reduce climate change.
Local Context
Chapel Hill’s location within the Research Triangle region and the presence of the University of North Carolina provides a large number of students and a greater concentration of “knowledge-based” employment. The Town of Chapel Hill is home to approximately 59,635 individuals as of 2013, according to the United States Census Bureau, and the University of North Carolina had a total student enrollment of 29,127 students in 2013 (U.S. Census Bureau, 2013b; University of North Carolina, 2013). In 2011, Chapel Hill was home to 45,278 jobs, 44.4% of which are categorized as Educational Services and 24.1% of which are categorized as Health Care and Social Assistance (U.S. Census Bureau, 2013a). Additionally, approximately one third of workers in Chapel Hill have a bachelor’s degree or other advanced degree (U.S. Census Bureau, 2013a). These two employment sectors and the high education of the Town’s workforce reflect the high proportion of those “knowledge-based” industries that increasingly locate near and demand transit access.
In order to determine a locally preferred alternative for increasing transit service along one of the Town’s major arterials, the Town of Chapel Hill has recently undertaken the North-South Corridor Study (NSCS), led by Chapel Hill Transit (CHT) in conjunction with project consultant URS. The study aims to evaluate transit alternatives for the study corridor, which runs approximately 7.3 miles along Martin Luther King, Jr. Boulevard, South Columbia Street, and US 15-501 South. The study is intended to provide a transit solution that will meet increasing traffic demand in the corridor, as well as increasing ridership, connectivity, and mobility across key locations throughout the corridor (Chapel Hill Transit Partners, 2014). While the NSCS will provide an extensive process for evaluating transit alternatives and developing a locally-preferred option, the study is not designed to predict impacts of transit
improvements on surrounding land uses or economic development in the corridor.
A survey of transit agencies conducted by the Transit Cooperative Research Program revealed that for providers of transit, increasing ridership, promoting economic development, raising revenues, and increasing livability were the primary goals of implementing TOD (Cervero et al., 2004). In Chapel Hill, the transit system became entirely fare-free in January 2002, at which point ridership increased significantly, rising 36% on weekdays and 131% on weekends from 2001 to 2005 (Town of Chapel Hill, 2007). For a system with no fares and consistently high ridership (due in large part to the Town’s large student population), TOD may serve to further increase ridership, but is likely to serve more as a means for economic development.
11
Because research related to TOD around bus systems is limited compared to rail corridor TOD, there are limited examples from which to draw in support of the success of TOD for bus corridors (Cervero et al., 2004). Studies of bus TOD across San Diego, Portland, and Washington County, Oregon have shown residential density thresholds for TOD in bus corridors to be consistently lower than for light rail corridors, potentially providing more comparable data (Cervero et al., 2004). However, each of these municipalities is significantly larger than Chapel Hill, and caution should still be taken in making direct comparisons. Because of the suburban character of much of the study corridor, the typical urban archetype for BRT and for TOD will be difficult to compare to Chapel Hill, and primary data collection and modeling will need to be done to forecast the impacts of TOD. However, this may serve as an advantage for the success of bus TOD compared to pursuing a light rail option, since Chapel Hill residents are likely to resist the high densities that would be required to support light rail, but may be amenable to the moderate densities needed to support BRT (Currie, 2006).
Each state or municipality implementing TOD must create their own definition that fits their local context. In Chapel Hill, the Town’s zoning ordinance outlines a definition of TOD as encouraging “a mixture of residential, commercial, and employment opportunities within identified light rail station or other high capacity transit areas” and “a safe and pleasant pedestrian and bicycle environment near transit stations by encouraging an intensive area of shops and activities, by encouraging amenities such as benches, kiosks, and outdoor cafes, and by limiting conflicts between vehicles and pedestrians and bicycles” (Chapel Hill Municipal Code, 2009). The ordinance goes on to define the area within a quarter mile of a transit station as the “transit oriented development core (TOD-C),” and the area between one quarter and one half mile from a transit station as “transit oriented development perimeter (TOD-P).” Not only does Chapel Hill’s ordinance allow for TOD districts to promote higher densities and a mix of uses that are supportive to transit, specifically excluding uses deemed not supportive to transit, it also allows for the Town to set minimum density levels in the district. However, there have not yet been any TOD districts implemented in the Town, and no specific densities, development standards, or allowable uses have been established. For this analysis, the model for TOD-C and TOD-P districts established by the Town has been applied to proposed BRT stations, with proposed densities assigned to those districts in three scenarios.
Land Development Analysis
Study Area
12
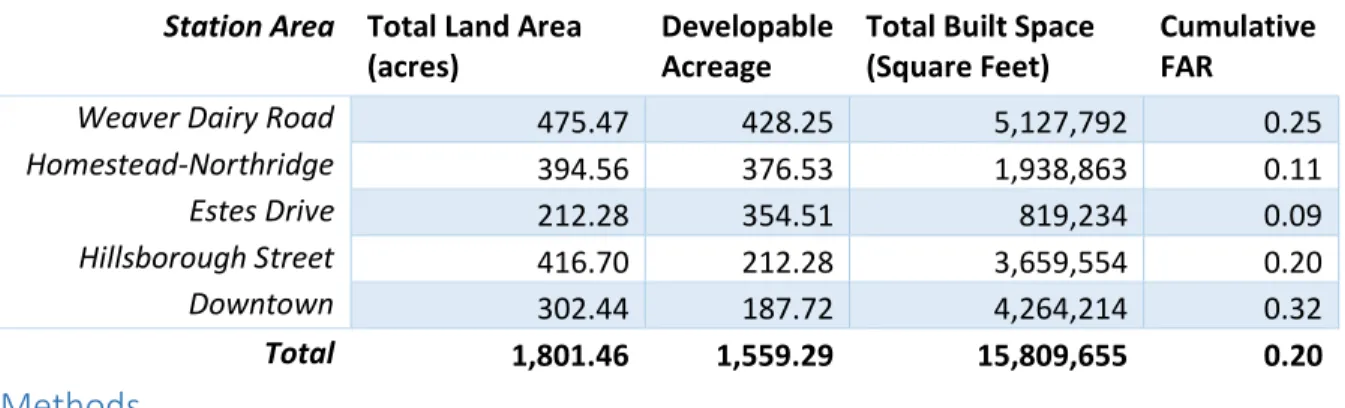
Table 1. Study Area Profile
Methods
Statistical Estimation of Current Development Levels
The analysis of economic development potential was completed based on a comparison of the current floor-area ratio of each parcel in the study area to the maximum FAR allowed under the parcels’ current zoning. In order to calculate current FAR, both the size of the parcel and total built square footage for each parcel are required. Unfortunately, the Town of Chapel Hill does not actively maintain a database of built square footage, but an incomplete dataset of buildings’ “finished area” was available from Orange County. In order to arrive at an approximation of built square footage, a regression analysis was performed to predict “finished area,” the best available equivalent for built square footage.
In order to perform the required analysis, ArcGIS was used to join parcel, building, and zoning layers together into a single data set. A significant amount of data cleaning and reasonableness checking was required to ensure that the data was satisfactory. Parcels which were part of a single development, but had been subdivided (e.g., into office or residential condominium units) were merged in order to reflect the true square footage and FAR of the development. Zoning data was spatially joined to parcel data, which required corrections to ensure that parcels falling within multiple zoning districts were correctly attributed to the proper zoning type. Multiple buildings on individuals parcels were also merged together to provide a total building footprint and finished area from which to build the
regression model. Finally, checks were made to ensure that the baseline data was reasonable, including eliminating finished area data from parcels where the current built FAR exceeds the maximum FAR allowable by zoning, and where finished area is less than the building’s impervious surface footprint. These conditions should be “impossible,” since the maximum FAR is strictly enforced by the zoning ordinance, and finished area should not be significantly less than the building’s impervious footprint.
Once the parcel, zoning, and building data were joined and adequately cleaned, regression models to predict buildings’ finished area were tested using building value, land value, maximum FAR, size of parcel, and building footprint, as well as squared terms for building footprint, parcel acreage, and maximum FAR. Only residential, office & institutional, and town center zoning types had sufficient sample sizes to create separate models according to type of zoning, requiring that parcels zoned for mixed use and other commercial zoning be combined in order to produce an acceptable model.
Independent regression models were produced for parcels zoned R-1, R-2, and R-3. Parcels zoned at any level of TC (town center) were combined into a universal TC model. Parcels with residential zoning of R-4, R-5, and R-6 were also combined to reach sufficient sample size. Finally, in order to estimate finished area for “other” zoning types that fell outside of these categories, a combined single
Station Area Total Land Area (acres)
Developable Acreage
Total Built Space (Square Feet)
Cumulative FAR
Weaver Dairy Road 475.47 428.25 5,127,792 0.25
Homestead-Northridge 394.56 376.53 1,938,863 0.11
Estes Drive 212.28 354.51 819,234 0.09 Hillsborough Street 416.70 212.28 3,659,554 0.20
Downtown 302.44 187.72 4,264,214 0.32
13
model was developed using dummy variables to control for zoning types which had separate models. In order to improve the fit of the model, parcels with acreages and building values exceeding three standard deviations of the mean were removed prior to the creation of the final model. The Stata output for each of the final regression models is presented in Appendix B.
Zoning Scenarios
In order to model the effects of implementing TOD zoning around these five BRT stations, specific scenarios were created. These scenarios were developed with consultation from a team of current development planners at the Town of Chapel Hill. The scenarios created are simplified zoning districts reflecting only a proposed change in FAR to allow for greater density in the station areas. Three scenarios were created to demonstrate the potential of increasing density at multiple levels.
For all zoning scenarios, any properties falling within a designated historic district were excluded from potential upzoning. An attempt was made to preserve existing neighborhoods by maintaining current zoning of neighborhood “cores,” only allowing upzoning of parcels near the edge of
neighborhoods and along main streets. This was an attempt to reflect the Town Council’s commitment to protecting and preserving neighborhoods, while accounting for the economics of future development in an area with such a limited supply of undeveloped land.
Scenario One was designed to demonstrate what would be possible if the Town did not create a new zoning designation for TOD, but instead selected an existing designation that provided the most similar characteristics available. The Town’s Zoning Ordinance includes Mixed Use-Village (MU-V) districts at three density levels which relate to the class of street which defines the district – arterial, collector, and local. The MU-V zoning permits vertical and horizontal mixed use, and encourages
pedestrian connectivity between land uses, as well as specifically requiring the provision of a bus stop at a mixed use development. Because of the similarities between this zoning district and a transit-oriented development zoning district, it was selected for modeling as a potential scenario. The MU-V districts were applied to the study area using a quarter-mile buffer around the station location to designate as MU-V Arterial, with the “outer ring” past that quarter mile extending to a half mile designated as MU-V Collector, mimicking the TOD-C and TOD-P guidelines in the Town’s zoning ordinance.
14
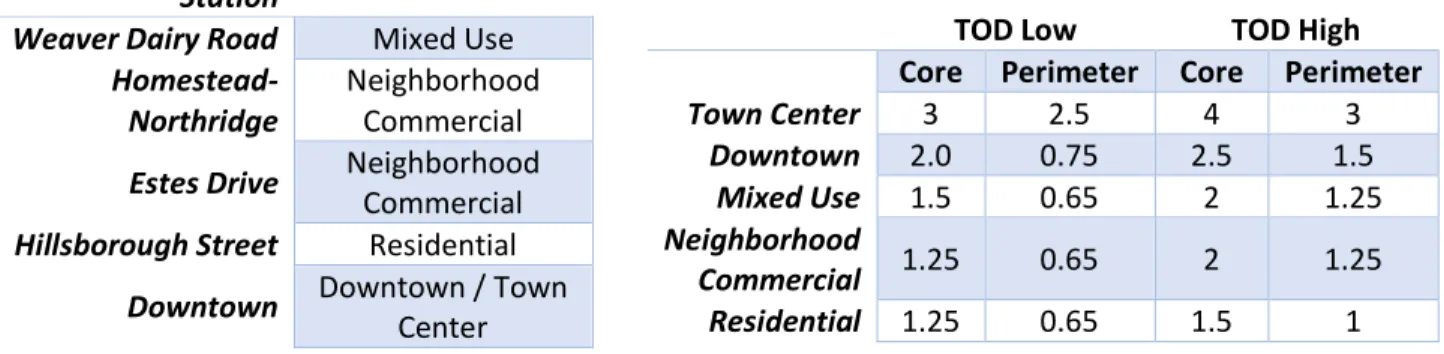
Table 2. Station Area District Designations Table 3. Transit Oriented Development Zoning Districts – FAR Values
The FAR values for the proposed TOD zoning districts were arrived at through study of existing TOD zoning guidelines in other municipalities, which are described above as Case Studies, as well as through conversations with planners at the Town and study of current zoning regulations to ensure as much consistency as possible with the character of Chapel Hill, while allowing for future development. Maps displaying the proposed zoning districts for all three scenarios can be found in Appendix A.
Land Development Analysis
Once the final finished area for all remaining parcels was imputed using the regression models described above, the dataset was once again cleaned to prevent “impossible” values. In cases where a parcel’s imputed finished area fell below the building footprint, or for which a negative finished area was imputed, the combined model was used to reach a final value, rather than the zoning-specific model. This most often occurred when building value data was missing, or when values for parcel size or building footprint were extreme. After careful cleaning, the final dataset was joined back into the ArcGIS parcel layer for spatial analysis and the application of the proposed zoning scenarios.
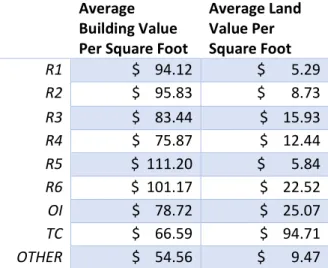
For each zoning scenario, the difference between the current FAR and proposed FAR for each parcel was calculated. Multiplication of that FAR difference and the size of the parcel yields the additional capacity of each parcel. That capacity was then converted into a value in dollars using an average building value per square foot for each zoning category (displayed alongside average land values in Table 4). An interesting note regarding average building values; buildings within Town Center zoning districts had, on average, the lowest value per square foot of all other building types. This may be a result of error in the regression models, leading to overestimation of building square footage, but an equally likely explanation is that these buildings are often older buildings, and their condition lowers their value compared to the newer apartment buildings and homes surrounding the station areas. While building values for Town Center properties were low compared to other zoning districts, land value for these properties is significantly higher than all other districts, indicating that the central location of these parcels in the Downtown provides a significant value. This has implications for the interpretation of the analysis performed on Town Center parcels. Because future value added is calculated based on the existing value, the low values in the Town Center will carry through to projected future values. It is likely that redevelopment of these parcels will, in many cases, preserve existing structures, but it should be anticipated that building values in this area may increase more relative to other locations in the study area. This concern should be the topic of future study.
Station
Weaver Dairy Road Mixed Use
Homestead-Northridge
Neighborhood Commercial
Estes Drive Neighborhood
Commercial
Hillsborough Street Residential
Downtown Downtown / Town
Center
TOD Low TOD High Core Perimeter Core Perimeter
Town Center 3 2.5 4 3
Downtown 2.0 0.75 2.5 1.5
Mixed Use 1.5 0.65 2 1.25
Neighborhood
15
Table 4. Average Building and Land Values
Average Building Value Per Square Foot
Average Land Value Per Square Foot
R1 $ 94.12 $ 5.29
R2 $ 95.83 $ 8.73
R3 $ 83.44 $ 15.93
R4 $ 75.87 $ 12.44
R5 $ 111.20 $ 5.84
R6 $ 101.17 $ 22.52
OI $ 78.72 $ 25.07
TC $ 66.59 $ 94.71
OTHER $ 54.56 $ 9.47
Building values were modified to account for inflation over a 20-year period, and a property value premium based on proximity to transit was added. Inflation was modeled at 2%, and the property value premium was modeled at an additional 2%. The basis for this value premium is described in more detail in the Role of Transit in Economic Development section, and a sensitivity analysis of that value is described in more detail below.
Finally, the future year value was multiplied by the Town of Chapel Hill’s current property tax rate of $0.524 per $100 of value to arrive at a projected tax revenue from the additional development allowed under each zoning scenario. It should be noted that the value of land was not included in this analysis, as the primary focus of this study is to project the value and tax revenue from new
development. Land values will change along with building values, at least at the rate of inflation, but that value and the tax revenue gain from that increase are not modeled here. Results from this analysis for each scenario, including a “no change” scenario where current zoning is maintained, are reported in the following sections.
Sensitivity Analysis
The land development analysis was performed under the assumption that the additional capacity that was allowed under these new zoning scenarios would be completely developed. However, it is not likely that 100% of the capacity allowed under any zoning scheme, regardless of its density or proximity to transit, would be developed. Therefore, a sensitivity analysis of varying “efficiencies” was conducted to demonstrate the effect of development at varying levels below the maximum capacity.
16
Additionally, in calculating the future value of development for the primary economic
development analysis, a 2% premium was placed on the value of property in the station areas. A more detailed discussion of premiums related to transit proximity is found in the Role of Transit in Land Development section above. It is difficult to predict the value that transit will add to nearby property, particularly for BRT systems, which are less common in both implementation and research. In order to account for this variability, a second sensitivity analysis was conducted to account for a range of premium values. For this analysis, future year values were analyzed at the level of a 0% premium, a 5% premium, and a 10% premium.
Each analysis was conducted for the total study area capacity and value, rather than for each station area. The results of this analysis create a wide variety of potential outcomes at different combinations of capacity levels and property value premiums. These analyses are relatively
straightforward, as the capacity and value for each scenario are only modified by percentage changes, but the ability to compare potential scenarios and understand a range of possibilities is important.
Results
Baseline – Current Zoning
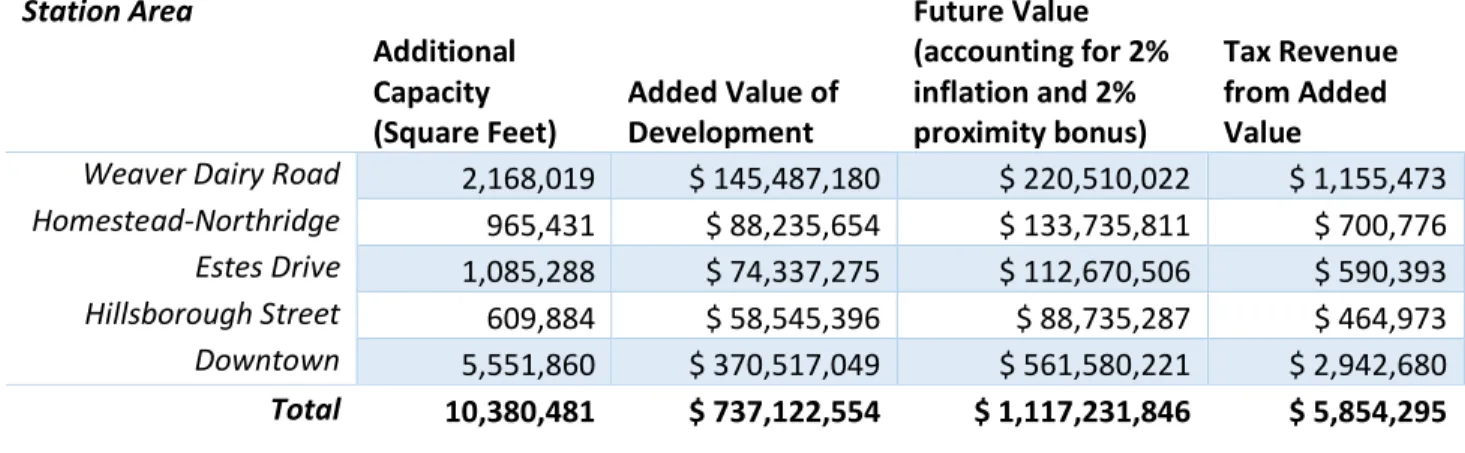
Across the five station areas, a total of 2,358 parcels were analyzed, totaling 1,801 acres. Currently, the cumulative floor-area-ratio across the entire study area is 0.20. Parcels were eliminated from further analysis if the calculated FAR for the parcel met or exceeded the allowable FAR. Parcels found to be vacant (and not categorized as Protected Open Space) or falling below the allowable FAR by current zoning were analyzed to determine the difference between existing and allowable FAR. The capacity, value, and tax revenue calculated for each station area are shown in Table 4, below. The greatest potential for development exists in the half-mile surrounding the Downtown station (53% of total capacity), due to the high density of existing zoning. The Weaver Dairy Road station also presents a great deal of potential for future development (21% of total capacity), mostly due to the large amount of undeveloped and underdeveloped land, which makes up for the relatively low density of the area.
Under current zoning, an additional 10,380,481 square feet of built space could be developed, resulting in a future value of over $1.1 billion, and nearly $5.9 million in additional tax revenue. This is, of course, assuming that 100% of the capacity is developed, which is unlikely. The section to follow reports on a sensitivity analysis that accounts for lower levels of development below the maximum capacity.
Table 5. Potential Development – Current Zoning
Station Area
Additional Capacity (Square Feet)
Added Value of Development
Future Value (accounting for 2% inflation and 2% proximity bonus)
Tax Revenue from Added Value
Weaver Dairy Road 2,168,019 $ 145,487,180 $ 220,510,022 $ 1,155,473 Homestead-Northridge 965,431 $ 88,235,654 $ 133,735,811 $ 700,776
Estes Drive 1,085,288 $ 74,337,275 $ 112,670,506 $ 590,393
Hillsborough Street 609,884 $ 58,545,396 $ 88,735,287 $ 464,973
Downtown 5,551,860 $ 370,517,049 $ 561,580,221 $ 2,942,680
17
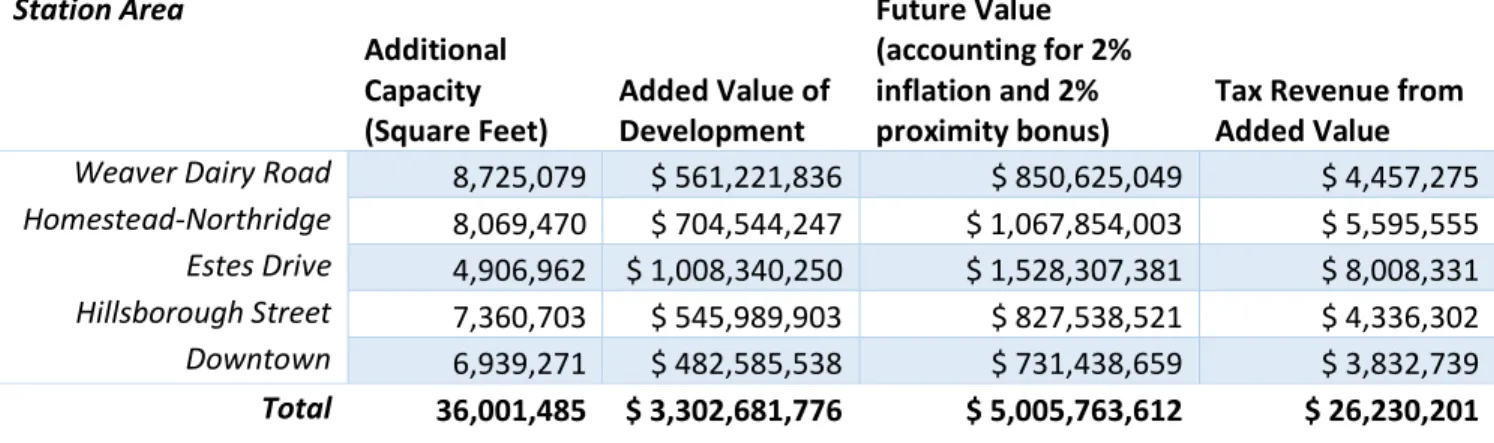
Scenario One – Mixed Use Village
In Scenario One, capacity at the stations north of Downtown increases dramatically. The Weaver Dairy Road, Homestead-Northridge, and Hillsborough Street stations present significant opportunities for development in this Scenario. Important to note, however, is the tremendous value of potential development at the Estes Drive station compared to stations that have greater capacity. This is primarily a result of the Shadowood and Timber Hollow Properties, which are very large lots (both approximately 17 acres), and currently zoned R-5, which has the highest average building value per square foot. More than likely, the true value of the capacity in the Estes Drive station area is somewhat lower, but there is certainly great potential for redevelopment of those lots and others under higher density. Capacity in the Downton station increased less significantly, primarily because much of the Downtown was already zoned for FAR levels higher than the maximum allowed by MU-V Arterial and Collector zoning. Those areas with existing FARs higher than that proposed as part of the MU-V zoning districts were maintained at their current zoning in this scenario.
The implementation of MU-V zoning in this scenario more than triples the potential capacity of the station areas, compared to current zoning. Under this scenario, the potential for increased tax revenue to the Town is $26,230,201, an increase of more than $20 million over the revenue that would be gained if development met the current capacity under today’s zoning.
Table 6. Potential Development –Scenario One (MUV Zoning)
Station Area
Additional Capacity (Square Feet)
Added Value of Development
Future Value (accounting for 2% inflation and 2% proximity bonus)
Tax Revenue from Added Value
Weaver Dairy Road 8,725,079 $ 561,221,836 $ 850,625,049 $ 4,457,275
Homestead-Northridge 8,069,470 $ 704,544,247 $ 1,067,854,003 $ 5,595,555
Estes Drive 4,906,962 $ 1,008,340,250 $ 1,528,307,381 $ 8,008,331
Hillsborough Street 7,360,703 $ 545,989,903 $ 827,538,521 $ 4,336,302
Downtown 6,939,271 $ 482,585,538 $ 731,438,659 $ 3,832,739
Total 36,001,485 $ 3,302,681,776 $ 5,005,763,612 $ 26,230,201
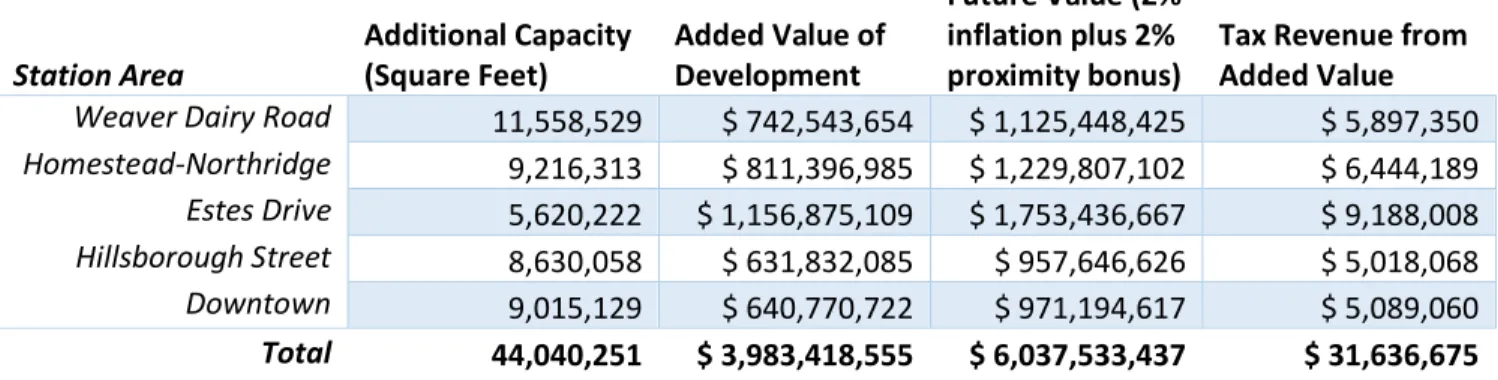
Scenario Two – Transit Oriented Development “Low”
18
Table 7. Potential Development – Scenario Two (TOD Low Zoning)
Station Area
Additional Capacity (Square Feet)
Added Value of Development
Future Value (2% inflation plus 2% proximity bonus)
Tax Revenue from Added Value
Weaver Dairy Road 11,558,529 $ 742,543,654 $ 1,125,448,425 $ 5,897,350
Homestead-Northridge 9,216,313 $ 811,396,985 $ 1,229,807,102 $ 6,444,189 Estes Drive 5,620,222 $ 1,156,875,109 $ 1,753,436,667 $ 9,188,008 Hillsborough Street 8,630,058 $ 631,832,085 $ 957,646,626 $ 5,018,068
Downtown 9,015,129 $ 640,770,722 $ 971,194,617 $ 5,089,060
Total 44,040,251 $ 3,983,418,555 $ 6,037,533,437 $ 31,636,675
Scenario Three – Transit Oriented Development “High”
Scenario Three, the highest density scenario, shows significant increases in capacity across all station areas, allowing more than 72 million square feet of additional capacity, which is nearly seven times the capacity under current zoning, and more than one-and-a-half times more capacity than Scenario Two. This capacity could provide additional tax revenues to the Town of more than $53 million, an increase of more than $21 million over Scenario Two.
Table 8. Potential Development – Scenario Three (TOD High Zoning)
Station Area
Additional Capacity (Square Feet)
Added Value of Development
Future Value (2% inflation plus 2% proximity bonus)
Tax Revenue from Added Value
Weaver Dairy Road 20,020,134 $ 1,285,280,191 $ 1,948,055,928 $ 10,207,813
Homestead-Northridge 16,743,680 $ 1,485,276,094 $ 2,251,182,987 $ 11,796,199
Estes Drive 10,075,869 $ 2,078,173,210 $ 3,149,817,191 $ 16,505,042 Hillsborough Street 12,185,107 $ 881,981,565 $ 1,336,789,774 $ 7,004,778 Downtown 13,499,368 $ 964,092,211 $ 1,461,242,116 $ 7,656,909
Total 72,524,157 $ 6,694,803,270 $ 10,147,087,996 $ 53,170,741
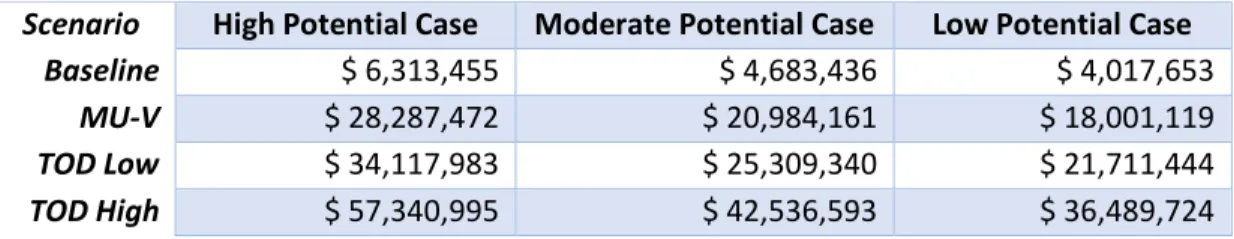
Sensitivity Analysis
The detailed results of these sensitivity analyses can be found in Appendix C. A summary of the range of possibilities is displayed below, in Tables 9-10. For each scenario, the “high potential” case, “moderate potential” case, and “low potential” case results are displayed to offer a sense of the range of possibilities. The best case scenario, although potentially unlikely, is development up to 100% of capacity, with a 10% value premium due to proximity to transit, while the worst case scenario is development up to just 70% of capacity with a 0% value premium. The moderate case presented is development at 80% of capacity, with a 2% value premium.
19
and a value premium increase of 0% to 2%. The consequences of this and discussion of how to promote these more positive outcomes are detailed in the Implications and Conclusions section to follow.
Table 9. Sensitivity Analysis Results
Value of Development - Range of Possibilities
Scenario High Potential Case Moderate Potential Case Low Potential Case
Baseline $ 1,204,857,874 $ 893,785,477 $ 766,727,738
MU-V $ 5,398,372,523 $ 4,004,610,890 $ 3,435,327,969
TOD Low $ 6,511,065,471 $ 4,830,026,750 $ 4,143,405,300
TOD High $ 10,942,938,035 $ 8,117,670,397 $ 6,963,687,840
Table 10. Sensitivity Analysis Results
Tax Revenue - Range of Possibilities
Scenario High Potential Case Moderate Potential Case Low Potential Case
Baseline $ 6,313,455 $ 4,683,436 $ 4,017,653
MU-V $ 28,287,472 $ 20,984,161 $ 18,001,119
TOD Low $ 34,117,983 $ 25,309,340 $ 21,711,444
TOD High $ 57,340,995 $ 42,536,593 $ 36,489,724
Discussion and Limitations
There are appropriate concerns to be had about the reliability of the data used in this analysis. The finished area data acquired by the County is not complete and contains errors, and must be taken with some amount of skepticism. Of the 2,152 parcels within the study area with finished area data, 1,070 had a building footprint (taken from the Town’s impervious surface data) that was greater than the finished area. Within a certain margin, this should be impossible, considering that the majority of any building’s footprint should equate to the same amount of finished space (with small allowances given for porches and similar structures that add impervious surface outside of the home’s finished area). Only parcels with finished area data greater than their building footprint were used in the regression analysis.
An added barrier to performing this sort of parcel analysis are the spatial relationships of parcel and building data. Building footprints often cross parcel lines, or large parcels are subdivided into individual lots for apartments or condominiums. Using ArcGIS, parcel and building data were joined, and parcels containing multi-family housing that had been subdivided were merged. This merging of parcels helped to eliminate extreme FAR values and more accurately reflect current development. However, the complicated nature of the data allows for some error even after significant data cleaning. Despite the concerns about the accuracy of the data used for this analysis, careful cleaning of the data helped to maximize the quality of the regression models created. While there is error inherent in the data, in particular the imputed data from the output of the regression models, great care was taken to accurately clean the data set, and numerous checks for data integrity and reasonableness were performed throughout the analysis.
0.78-20
0.92). Once aggregated to the level of the station areas, and the entire study area, these errors should be somewhat normally distributed. The outputs of this analysis should be viewed as a framework for understanding the impacts upzoning the station areas of the proposed BRT system. Within a reasonable margin of error, development in the corridor could reach the levels proposed by the analyses in this report. The comparison between scenarios is equally important as the revenues calculated, as that comparison will help to inform the benefits or drawbacks of implementing particular elements of a potential TOD zoning plan.
In addition to the concerns related to data validity and reliability discussed above, there are shortcomings of this analysis which should be addressed. The methods used for estimating the value and impact of development are fairly simple, only calculating potential development as a percentage of the maximum allowable square footage. A more detailed analysis could have considered more factors relating to current age, value, and condition of the properties within the study area and identified parcels that are more or less likely to redevelop. Further, there are multiple small area plans and currently approved developments in the study area which were not incorporated into this analysis. While the development of these projects under current zoning is no guarantee that they would not redevelop under a new zoning code, there should be some consideration given to approved projects in order to account for development that is likely to remain in the area for many years. A greater level of detail in considering characteristics of parcels and buildings may have led to the exclusion of certain areas due to their high value or recent development, or the prioritization of certain areas for redevelopment due to their poor condition or low value.
The calculation of property value and tax revenue used in this study was simplified by projecting it to occur at a single time point in 20 years. A more accurate representation of the value created would project development over a range of time, accounting for the generation of revenues over that time. Therefore, this analysis has the potential to underestimate total revenues for the Town by ignoring the duration of the build-out period for the station areas. Further study of development potential in the corridor should model the build-out of station areas beginning with the implementation of the TOD zoning code through multiple years of development. Predicting the expected duration of that build-out period may require, as described above, a more careful study of station areas on a parcel level. Parcels ripe for redevelopment due to low property values may be selected to be modeled as the first to redevelop and contribute new revenues, while more recently developed parcels may not turn over until much later, and their added revenue may not be received until all other properties in the area have redeveloped.
Implications and Conclusions
21
districts around the system’s station areas. The sensitivity analysis conducted, while somewhat simplistic, demonstrates that with relatively minor changes in the amount of development and the premium created by transit, significant changes in value added and tax revenue are to be had. An increase from development of 70% to 80% of total capacity, along with a 2% premium on property values, would yield nearly a 17% increase in tax revenues to the Town.
There is no clear formula for achieving these levels of development and ensuring a premium on property values, but careful planning that ensures the key elements of TOD are promoted and
implemented carefully can help to assure the kinds of positive outcomes described in this report. While this analysis demonstrates economic development potential, it fails to address the more nuanced implications of TOD station area planning, in particular the focus on pedestrian and bicycle
infrastructure and encouraging “transit supportive” uses. Incorporating components of other successful projects, such as the minimum FAR requirements and maximum setbacks implemented in the Eugene BRT corridor, can build on the lessons learned and successes of other municipalities.
A number of planning strategies have been successful at promoting robust TOD in other communities, and they should be considered for use in Chapel Hill (Environmental Protection Agency). The first of these is to ensure livability for all income levels by promoting affordable housing and preserving existing neighborhoods. The scenarios proposed in this study have made an effort to protect existing neighborhoods from development by excluding the cores of neighborhoods from upzoning, but a more detailed study of neighborhoods in the study area should be conducted to examine which areas may support redevelopment and which areas should be preserved. Areas with primarily renter-occupied housing are more opportune for redevelopment than areas occupied predominantly by home-owners. This study has demonstrated the tremendous potential for creation of additional value in the corridor, which presents a threat to existing low-income residents who may be priced out of the district as property values rise. Providing incentives for the creation and/or preservation of affordable housing and continuing to require affordable units as part of inclusionary zoning policies will be central to
maintaining the diversity and equality of these TOD districts.
The Town should also consider partnerships with organizations such as neighborhood
associations and community development corporations such as EmPOWERment, Inc., which focuses on providing affordable housing, home-owner education and counseling, community building, and
economic development in the Northside, Pine Knolls, Carr Court, and Lloyd Street communities
(EmPOWERment, Inc.) These organizations are able to gather community support and advocate for the existing residents of communities to ensure their needs are met, in addition to being able to help raise funds and support development efforts (EPA).
Regulations related to parking are often a contentious issue in the development process, and the provision of parking is expensive for developers, ranging from $20,000 to $40,000 per space in structured parking (EPA). In order to keep prices low and allow development to occur, many municipalities elect to forego traditional methods of setting parking requirements and set reduced requirements, or even maximums that would limit parking and further encourage alternative modes of transportation (EPA).
22
development process and creating a unified character for development. The opportunity to create TOD districts presents another opportunity for the implementation of form-based code, which may provide a more cohesive and appealing human scale and pedestrian environment (EPA).
23
Appendix A – Maps
24
25
26
Figure 4. Scenarios Two and Three (TOD) Proposed Zoning
27
28
29
30
31
32
33
34
35
36
37
38
39
40
41
42
43
Appendix B – Regression Models
Stata 13.1 statistical software was used to develop the regression model for predicting built square footage, using data available from the Town of Chapel Hill’s Planning and Sustainability Department. Stata output for the selected regression models are displayed below.
Combined Model
. regress finarea landval_1000 bldgval_1000 building_footprint footprint2 calc_acres acres2 max_far max_far2 r1 r2 r3 r456 tc
Source | SS df MS Number of obs = 1088 ---+--- F( 13, 1074) = 557.25 Model | 4.0153e+09 13 308871487 Prob > F = 0.0000 Residual | 595298875 1074 554282.007 R-squared = 0.8709 ---+--- Adj R-squared = 0.8693 Total | 4.6106e+09 1087 4241608.29 Root MSE = 744.5
--- finarea | Coef. Std. Err. t P>|t| [95% Conf. Interval] ---+--- landval_1000 | .4461127 .2023403 2.20 0.028 .0490856 .8431398 bldgval_1000 | 4.409055 .1772211 24.88 0.000 4.061316 4.756794 building_footprint | .5530051 .0652043 8.48 0.000 .4250628 .6809474 footprint2 | .0000254 6.95e-06 3.66 0.000 .0000118 .000039 calc_acres | 355.9882 142.9652 2.49 0.013 75.46545 636.5109 acres2 | -68.90586 42.66935 -1.61 0.107 -152.6306 14.81888 max_far | -3199.942 3092.092 -1.03 0.301 -9267.168 2867.284 max_far2 | 1285.082 2485.038 0.52 0.605 -3590.997 6161.162 r1 | -2120.106 448.01 -4.73 0.000 -2999.18 -1241.032 r2 | -1868.677 406.3025 -4.60 0.000 -2665.914 -1071.44 r3 | -1603.126 257.8353 -6.22 0.000 -2109.044 -1097.208 r456 | -885.0825 159.2008 -5.56 0.000 -1197.462 -572.7027 tc | -402.7943 4581.806 -0.09 0.930 -9393.101 8587.512 _cons | 2144.265 658.9509 3.25 0.001 851.2883 3437.243 ---
R1 Model
. regress finarea bldgval_1000 building_footprint calc_acres
Source | SS df MS Number of obs = 375 ---+--- F( 3, 371) = 461.10 Model | 194227540 3 64742513.3 Prob > F = 0.0000 Residual | 52091733 371 140408.984 R-squared = 0.7885 ---+--- Adj R-squared = 0.7868 Total | 246319273 374 658607.681 Root MSE = 374.71
44
R2 Model
. regress finarea bldgval_1000 building_footprint footprint2
Source | SS df MS Number of obs = 251 ---+--- F( 3, 247) = 405.23 Model | 140976332 3 46992110.8 Prob > F = 0.0000 Residual | 28642913.6 247 115963.213 R-squared = 0.8311 ---+--- Adj R-squared = 0.8291 Total | 169619246 250 678476.983 Root MSE = 340.53
--- finarea | Coef. Std. Err. t P>|t| [95% Conf. Interval] ---+--- bldgval_1000 | 3.782719 .3193151 11.85 0.000 3.153791 4.411647 building_footprint | -.2047794 .1279962 -1.60 0.111 -.4568826 .0473237 footprint2 | .0001994 .0000199 10.03 0.000 .0001602 .0002386 _cons | 1103.744 144.0765 7.66 0.000 819.9689 1387.519 ---
R3 Model
. regress finarea bldgval_1000 building_footprint footprint2 calc_acres acres2
Source | SS df MS Number of obs = 254 ---+--- F( 5, 248) = 184.24 Model | 201767014 5 40353402.8 Prob > F = 0.0000 Residual | 54317259.1 248 219021.206 R-squared = 0.7879 ---+--- Adj R-squared = 0.7836 Total | 256084273 253 1012190.8 Root MSE = 468
--- finarea | Coef. Std. Err. t P>|t| [95% Conf. Interval] ---+--- bldgval_1000 | 3.059278 .3440398 8.89 0.000 2.381666 3.736891 building_footprint | .1606761 .164432 0.98 0.329 -.1631852 .4845373 footprint2 | .000093 .0000288 3.23 0.001 .0000362 .0001498 calc_acres | 1104.659 462.752 2.39 0.018 193.2335 2016.084 acres2 | -803.1958 447.4104 -1.80 0.074 -1684.404 78.01278 _cons | 824.3644 139.253 5.92 0.000 550.095 1098.634 ---
R456 Combined Model
. regress finarea bldgval_1000 building_footprint
Source | SS df MS Number of obs = 136 ---+--- F( 2, 133) = 816.05 Model | 1.9432e+09 2 971587357 Prob > F = 0.0000 Residual | 158350423 133 1190604.69 R-squared = 0.9246 ---+--- Adj R-squared = 0.9235 Total | 2.1015e+09 135 15566852.9 Root MSE = 1091.1
---45
TC Model
. regress finarea bldgval_1000 building_footprint footprint2 calc_acres acres2
Source | SS df MS Number of obs = 43 ---+--- F( 5, 37) = 29.13 Model | 386286845 5 77257369 Prob > F = 0.0000 Residual | 98136312.3 37 2652332.76 R-squared = 0.7974 ---+--- Adj R-squared = 0.7700 Total | 484423157 42 11533884.7 Root MSE = 1628.6
46
Appendix C – Sensitivity Analysis Results
Additional Capacity (Square Feet)
Scenario 100% Capacity 90% Capacity 80% Capacity 70% Capacity
Baseline 10,380,481 9,342,433 8,304,385 7,266,337
MU-V 36,001,485 32,401,337 28,801,188 25,201,040
TOD Low 44,040,251 39,636,226 35,232,201 30,828,176
TOD High 72,524,157 65,271,742 58,019,326 50,766,910
Value of Development - Base Year
Scenario 100% Capacity 90% Capacity 80% Capacity 70% Capacity
Baseline $ 737,122,554 $ 663,410,299 $ 589,698,043 $ 515,985,788
MU-V $ 3,302,681,776 $ 2,972,413,598 $ 2,642,145,421 $ 2,311,877,243
TOD Low $ 3,983,418,555 $ 3,585,076,699 $ 3,186,734,844 $ 2,788,392,988 TOD High $ 6,694,803,270 $ 6,025,322,943 $ 5,355,842,616 $ 4,686,362,289
Value of Development – Future Year, 0% Premium Bonus
Scenario 100% Capacity 90% Capacity 80% Capacity 70% Capacity
Baseline $ 1,095,325,340 $ 985,792,806 $ 876,260,272 $ 766,727,738 MU-V $ 4,907,611,384 $ 4,416,850,246 $ 3,926,089,108 $ 3,435,327,969
TOD Low $ 5,919,150,428 $ 5,327,235,386 $ 4,735,320,343 $ 4,143,405,300
TOD High $ 9,948,125,486 $ 8,953,312,937 $ 7,958,500,389 $ 6,963,687,840
Value of Development – Future Year, 2% Premium Bonus
Scenario 100% Capacity 90% Capacity 80% Capacity 70% Capacity
Baseline $ 1,117,231,846 $ 1,005,508,662 $ 893,785,477 $ 782,062,292 MU-V $ 5,005,763,612 $ 4,505,187,251 $ 4,004,610,890 $ 3,504,034,528
TOD Low $ 6,037,533,437 $ 5,433,780,093 $ 4,830,026,750 $ 4,226,273,406
TOD High $ 10,147,087,996 $ 9,132,379,196 $ 8,117,670,397 $ 7,102,961,597
Value of Development – Future Year, 5% Premium Bonus
Scenario 100% Capacity 90% Capacity 80% Capacity 70% Capacity
Baseline $ 1,150,091,607 $ 1,035,082,446 $ 920,073,285 $ 805,064,125