INVESTIGATING BRASS GRANULAR MEDIA FOR POINT-OF-USE WATER TREATMENT: MICROBIAL INACTIVATION, AND COPPER AND LEAD REMOVAL
John Gilles
A thesis submitted to the faculty of the University of North Carolina at Chapel Hill in partial fulfillment of the requirements for the degree of Masters of Science in Public Health in the
Environmental Science and Engineering department.
Chapel Hill 2015
Approved by:
Orlando Coronell Mark Sobsey
ii © 2015 John Gilles
iii
-Abstract:
John Gilles: Investigating Brass Granular Media for Point-of-Use Water Treatment: Microbial Inactivation, and Copper and Lead Removal
(Under the direction of Orlando Coronell and Mark Sobsey)
iv
TABLE OF CONTENTS
LIST OF TABLES ... vi
LIST OF FIGURES ... vii
1. INTRODUCTION ...1
1.1 Background ...1
1.2 Framing the problem ...2
1.3 Establishing a potential technology for investigation ...6
1.4 Experimental objective ...10
2. METHODS ...11
2.1 Chemicals, Reagents, and Stock Solutions ...11
2.2 Brass Media ...11
2.3 Test Microbes...12
2.4 Test set-up for batch experiments ...13
2.5 Test set-up for column experiments ...15
2.6 E. coli enumeration ...17
2.7 MS2 bacteriophage enumeration ...18
2.8 Microbial control and metal control ...19
2.9 Metals analyses ...19
2.10 Experimental Design and Data Analysis ...20
3. RESULTS AND DISCUSSION ...22
v
3.2 Contributions of brass media and metal ions to microbe inactivation ...25
3.3 Effect of pH on reduction of microbes and removal of dissolved metals by brass media... 28
3.4 Effect of brass dose on reduction of microbes and removal of dissolved metals by brass media...31
3.5 Effect of mixing on microbial inactivation and metal removal ...34
3.6 Microbe reduction and lead removal by brass in column configuration ...38
3.7 Copper removal by brass in column configuration ...42
3.8 Comparison to other research on microbial inactivation and metal removal with copper and brass...43
3.9 Implications for point-of-use water treatment ...45
3.10 Suggested future development ...48
4. CONCLUSION ...49
APPENDIX 1: pH for batch experiments ...51
APPENDIX 2: Metal and Microbial controls ...52
APPENDIX 3. Data related to figures ...53
vi
LIST OF TABLES
Table 1. WHO targets for microbial reductions of household water treatment options ...4
Table 2.List of experimental batch vessels ...15
Table 3. Challenge waters for flow through column configuration ...17
Table 4. Reaction rate constants for microbial inactivation and metal removal for brass ...23
Table 5. Reaction rate constants for microbial inactivation by metal ions ...27
Table 6. Reaction rate constants for microbial inactivation and metal removal by brass at pH 6.5 and pH 8.5 ...30
Table 7. Reaction rate constants for microbial inactivation and metal removal for two brass doses ...33
vii
LIST OF FIGURES
Figure 1. Picture of brass granular media ...11
Figure 2. Picture of batch test set-up ...14
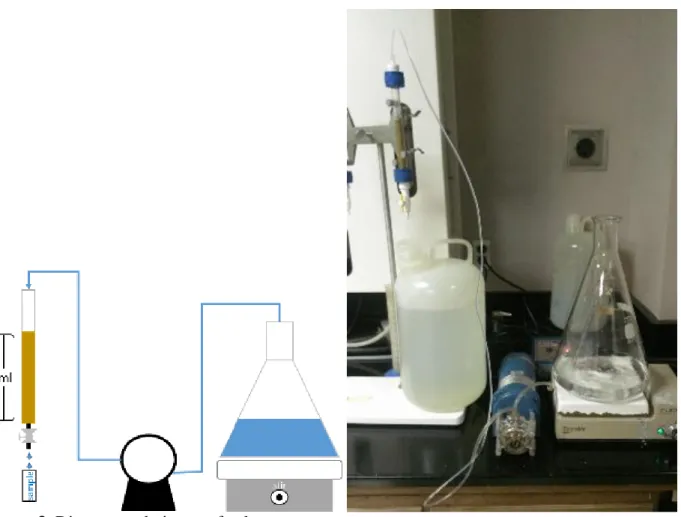
Figure 3. Diagram and picture of column test set-up ...17
Figure 4. Removal of microbes by brass media ...22
Figure 5. Removal and release dissolved metals by brass media ...24
Figure 6. Stepwise addition of copper and zinc to imitate ions release by brass ...26
Figure 7. Microbial inactivation of copper and zinc ions ...27
Figure 8. Reduction of microbes by brass media at a pH of 6.5 and a pH of 8.5 ...29
Figure 9. Removal and release dissolved metals by brass media at a pH of 6.5 and a pH of 8.5 ...30
Figure 10. Reduction of microbes by 2 g/L and 20 g/L brass dose ...32
Figure 11. Removal and release dissolved metals by 2 g/L and 20 g/L brass dose ...33
Figure 12. Reduction of microbes by brass media with and without mixing ...35
Figure 13. Removal and release of dissolved metals by brass media with and without mixing ...36
Figure 14. Reduction of microbes by brass media in column configuration ...39
Figure 15. Removal of lead and copper and zinc release by brass media in column configuration ...41
Figure 16. Removal of copper by brass media in column configuration ...42
1
1. Introduction
1.1 Background
Drinking untreated water can lead to many adverse health effects if the water is
contaminated (Prüss et al. 2002). In locations where treated piped water systems do not exist or where piped water has the potential of being contaminated due to inadequate treatment or compromises in the distribution system, one option to remove contamination is point-of-use (POU) water treatment. While many solutions exist for treating drinking water at POU in the home, they are often too expensive, inaccessible or unreliable for use in low resource settings. However, many POU solutions have been tailored directly for low resource, low income settings. These technologies include ceramic pot filters, POU membrane filters, biosand filters, solar disinfection (SODIS), boiling, and chlorine disinfection. These solutions have generally turned out to be “Yes but” solutions; i.e. solutions that have positive attributes but also have
disadvantages that limit their effectiveness and widespread uptake and sustained use.
Yes, you can provide clean drinking water with a variety of POU technologies as listed above (Sobsey et al. 2008) but there is a review that suggests that the POU technologies are not ready for scale-up (Schmidt and Cairncross 2009). Yes, chlorine can kill microbes (Levy et al. 2014) but the taste of chlorine is often unappealing to people (Reller et al. 2003; Luoto et al. 2011; Roma, Bond, and Jeffrey 2014) and it needs to be purchased regularly, so use can decrease over time when there are other expenses (Sobsey et al. 2008). Yes, ceramic pot filters can remove pathogens, and be produced locally and inexpensively (Rayner 2009; Lantagne and Clasen 2012), but they break easily, clog, fail to remove viruses and/or fail to gain acceptance because of slow water production (Lantagne 2001). Yes, SODIS can reduce bacterial loads in water at
2
behavior changes, the handling of many bottles the provide only limited amounts of water for daily use and a lot of time waiting for the water to be ready to drink (Tamas and Mosler 2011; Mäusezahl et al. 2009). Yes, boiling can be effective and has achieved the greatest acceptance (Brown and Sobsey 2012; Rosa and Clasen 2010), but the volumes of water produced for daily use are limited, soot from fires can be harmful to health and the energy costs can be expensive (Clasen, McLaughlin, et al. 2008; Clasen, Do, et al. 2008; Saldiva and Miraglia 2004). Yes, POU membranes can remove both viruses and bacteria (Peter-Varbanets et al. 2009), but they are expensive and hard to use (Boisson, Sophie Schmidt, Wolf Peter, Berhanu, Tsegahiwot,
Gezahegn, Henock, Clasen 2009), supply chains may be limited and effective performance may be unreliable (Murray et al. 2014). Yes, biosand filters can be inexpensive and do not require much behavior change (Fabiszewski de Aceituno et al. 2012; Aiken et al. 2011), butthey exhibit poor virus removal, can be hard to transport, and can have high variability in microbial removal performance (Sobsey et al. 2008; Young-Rojanschi and Madramootoo 2014).
There is strong evidence that all currently available POU technologies have limitations that make them hard to use, produce, distribute and implement, thereby limiting coverage and sustained use. Therefore, there is need for further research on potential POU solutions that provide high performance at low cost.
1.2 Framing the problem
According to the 2014 report by the World Health Organization(WHO)/UNICEF Joint Monitoring Program, about 748 million people worldwide lack access to improved drinking water sources, putting them at risk for waterborne illnesses, such as diarrheal disease
3
pathogens. A multi-country study (Kotloff et al. 2013) found that a majority of diarrheal disease could be attributed to four pathogens, namely rotavirus, E. coli, Shigella, and, Cryptosporidium. These pathogens can be grouped into three categories based on microbial characteristics: viruses (rotavirus), bacteria (enterotoxic Escherichia coli (E. coli) and Shigella) and protozoa
(Cryptosporidium). Removing different classes of pathogens poses different challenges to a
POU water treatment device. Viruses are generally small and can pass through some size exclusion treatment solutions such as ceramic pot filters and biosand filters (Lantagne 2001; Young-Rojanschi and Madramootoo 2014). UV radiation is less efficacious in disinfection capability with viruses, resulting in low virus reductions using SODIS (Fisher, Iriarte, and Nelson 2012). Protozoa are larger and therefore are likely removed by filtration (Bielefeldt et al. 2010); however, they are generally more resistant to chemical disinfection by chlorine (Korich et al. 1990). Bacteria are for the most part able to be removed to some extent by all of POU
treatment types (Sobsey et al. 2008), but can foul filtration membranes (Ines et al. 2013) and can easily recontaminate water after it is treated.
Other factors need to be considered besides the class of pathogen when devising technical solutions to prevent diarrheal disease from drinking water. Because microbial pathogens often disproportionately impact children under 5 (WHO, 2004) the need to provide consistently safe water to children must to be considered in the design and use of any water treatment device. Furthermore, the level of microbial contamination is highly variable and depends on water source (Shaheed et al. 2014), season (Levy et al. 2009), geography, land use and a host of other variables (Widmer et al. 2013; Pachepsky et al. 2014).
4
that are based on health based targets (World Health Organization 2011a). For a household water treatment device to be considered highly protective it must remove or inactivate greater than 4 Log10 bacteria and protozoa and remove or inactivate greater than 5 Log10 viruses. The EPA guidelines for testing microbiological water purifiers are slightly different with microbial reduction requirements of greater than 6 Log10 for bacteria greater than 4 Log10 viruses and greater than 3 Log10 for protozoa (US Environmental Protection Agency (US EPA) 1987).
Table 1. WHO targets for microbial reductions of household water treatment options.
Target
Log10 reduction required:
Bacteria
Log10 reduction
required:
Viruses
Log10 reduction
required:
Protozoa
Highly Protective ≥ 4 ≥ 5 ≥ 4
Protective ≥ 2 ≥ 3 ≥ 2
Minimum Protection
Achieves “protective” target for two classes of pathogens and results in health gains
In addition to microbial contaminants, drinking water can have chemical contaminants which can occur naturally in the environment or can come from various sources of pollution. These contaminants include lead, copper, arsenic, nitrate, fluoride and many others. Of the many chemical contaminants copper and lead are of particular interest. Both the United States
5
Human Services 2007). High doses of copper can result in gastrointestinal symptoms such as, nausea, abdominal pain, vomiting and diarrhea ((ATSDR), Agency for Toxic Substances and Disease Registry 2004). According to the WHO, plumbing and distribution systems are the most common sources for both lead and copper contamination (World Health Organization 2011b; World Health Organization 2011c), although other anthropogenic sources have been shown to cause significant contamination.
In low resources settings copper and lead from anthropogenic contamination may be a larger issue when governments have less of an ability to regulate against chemical
contamination. For example, in a study in Karachi Pakistan 90% of groundwaters and 86% of surface waters were contaminated with lead concentrations over the WHO guidelines (Ul-Haq et al. 2011). There is also growing evidence that copper and lead are common contaminants found in groundwaters near landfills, mining operations, and electronics recycling sites in the
6
2012; Nikovskaya, Godinchuk, and Samchenko 2012; Rangsivek and Jekel 2005). Many of these solutions are achievable in the developed world; however, they are too expensive or require materials not available in low income settings.
1.3 Establishing a potential treatment technology for investigation
Brass granular media has the potential be a low cost solution that could inactivate microbial contaminants and remove chemical contaminants in water at the point-of-use in low resource settings. Brass is an alloy of zinc and copper and is sold as a granular medium that could be ideal for point-of-use water treatment. Brass media costs about $8 per pound
(Amazon.com 2014) which could result in the development of inexpensive POU devices. Brass has the potential to both remove microbial and metal contaminants from drinking water.
Brass removal of chemical contaminants from water is possible through reduction and oxidation (redox) reactions. The half reactions for copper lead and zinc can be written as (MHW 2005; Hayes 1993)
Zn(𝑎𝑞)2+ + 2𝑒− → Zn
(𝑠)
0 Ev = - 0.760 V, (1)
Cu(𝑎𝑞)2+ + 2𝑒− → Cu(𝑠)0 Ev = 0.339 V, (2)
and
Pb(𝑎𝑞)2+ + 2𝑒− → Pb(𝑠)0 Ev = - 0.126 V, (3)
where Ev is the redox potential of the half reaction. The half reactions can then be added together to give the full redox reactions for copper and lead as
Cu(𝑎𝑞)2+ + Zn(𝑠)0 → Cu(𝑠)0 + Zn(𝑎𝑞)2+ Ev = 1.099, (4)
7
Pb(𝑎𝑞)2+ + Zn(𝑠)0 → Pb(𝑠)0 + Zn(𝑎𝑞)2+ Ev = 0.634, (5)
respectively.
It should be noted that in both of these reactions copper and lead are going from a soluble state Cu2+(𝑎𝑞) and Pb(𝑎𝑞)2+ to an insoluble state Cu(𝑠)0 and Pb(𝑠)0 . In both cases the Cu2+(𝑎𝑞) and Pb(𝑎𝑞)2+
contaminants are being replaced in a 1:1 ratio with Zn(𝑎𝑞)2+ which is a less toxic chemical. In both reactions the redox potential is positive which means that they are thermodynamically favorable (MHW 2005).
Some zinc is required in a healthy diet and zinc is only classified as a secondary
contaminant by the EPA having a much higher acceptable limit of 5 mg/L1 compared to those of copper (1.3 mg/L) and lead (0.015 mg/L) (US Environmental Protection Agency (US EPA) 1991). Furthermore, zinc has therapeutic activity against diarrheal disease and is promoted for this purpose in the developing world (Bajait and Thawani 2011).
The use of redox chemistry to remove undesirable metals from solution is a commonly known process. The recovery of heavy metals from waste streams by passing the stream over a metal with lower reduction standard potential is called cementation (Ibanez, JG, Lopex-Mejia, E, Echevarria-Eugui 2008). Processes that use metals, such as zero-valent zinc, to remove
contaminants from water or recover high value metals from waste streams via cementation have existed for decades (Nosier, SA, Sallam 2000; Mubarak, El-Shazly, and Konsowa 2004; Zarraa 1992; Zaghib, Chainet, and Nguyen 1997). Brass being an alloy of copper and zinc has the potential to remove metal contaminants by redox reactions as pure zinc does. Unpublished studies have explored the removal kinetics of copper and lead with brass granular media. These
1 Even though the EPA limit is 5.0 mg/L it should be noted that zinc can give water an undesirable taste and
8
studies examined the kinetics of copper and lead removal by brass in a batch treatment
configuration for short contact times (~1-4 hours) and in a column configuration (C. Wang et al. 2014; Catenacci 2014).
In addition to brass having the potential to remove toxic metals from solutions, brass also has antimicrobial properties. Certain metals have been known to have antimicrobial properties and have been studied for disinfection purposes since the early 1900’s (Phelps 1905; Kraemer 1905). Recent studies have looked at the antimicrobial properties of copper and copper alloys. For example, studies have evaluated the use of copper and brass storage containers as a way to reduce microbial contamination in stored waters and achieved successful results (Sudha et al. 2012; Shrestha et al. 2009). In the study by Shrestha et al. (2009), brass, copper, and silver containers were shown to be able to achieve more than four logs reduction of Salmonella
paratyphi, Shigella spp., multidrug resistant E. coli, E. coli, Vibrio cholerae and Klebsiella spp. within 48 hours. The antimicrobial properties of copper have been studied in many settings (Borkow and Gabbay 2005). For example, in hospital settings copper and copper-alloy surfaces have been demonstrated to have antimicrobial properties and the mechanism of microbial inactivation has been investigated (Quaranta et al. 2011; Salgado et al. 2013). Copper, zinc and silver in various forms have been examined for their microbial inactivation properties (Thurman, Gerba, and Bitton 1989; Loo et al. 2013; Y. Liu et al. 2009; Borkow and Gabbay 2005). Witsil (2014) studied microbial inactivation in stored waters supplemented with porous mesh pouches containing metal particles (copper, zinc and silver). They found the pouches could reduce E. coli
9
As a POU water treatment solution, brass granular media2 is commercialized by the trade name KDF-55 and KDF-85 (KDF Fluid Treatment Inc 2014), with four different types of brass being sold: two copper to zinc ratios (55:45 and 85:15) and two size variations (a finer particle size and a coarser particle size). The manufacturers claim (KDF Fluid Treatment Inc 2014) that “KDF water filter media supplement or replace existing technologies to dramatically extend system life, reduce heavy metals, microorganisms, scale, lower total cost, and decrease maintenance.” In their patent, they also claim that KDF brass removes nitrogen compounds, aluminum, arsenic, barium, cadmium, chromium, copper, gold, iron, lead, mercury, selenium and silver (Heskett 1987). KDF media can be found in a few commercial products including
showerhead filters (Pure Earth Technologies Inc 2014) and carbon adsorption devices (Pentair Inc. 2015). However, to date there is no published, peer-reviewed scientific literature verifying KDF Fluid Treatment Inc’s claims or characterizing the kinetics and mechanisms of brass in its ability to remove chemical and microbial contaminants from water.
Brass granular media could be a promising material for both microbial inactivation and metal removal from drinking water at the POU. However, research is needed to characterize the performance of brass for microbial inactivation and metal removal especially on a longer time scale. Characterization of brass’s ability to inactivate microbes and remove metals in controlled laboratory experiments could help determine if it is an appropriate technology for POU water treatment in low resource settings.
2 As a note: Lead is often added to brass to improve machining processes (Triantafyllidou and Edwards
10
1.4 Study Objectives
To address the knowledge gaps and need in the literature identified above, the objectives of this study were to: (i) characterize the microbial inactivation and copper and lead removal by brass granular media in batch and column configurations; (ii) determine the influence of the metal ions released from the brass on the disinfection kinetics; (iii) characterize the impact of brass dose, pH, and mixing conditions on the microbial inactivation and copper and lead removal kinetics. To achieve these objectives, experiments were performed examining the kinetics of microbial inactivation and metal removal in a batch configuration both simultaneously and separately over the course of 24 hours. Experiments were performed evaluating the amount of microbial inactivation attributed to copper and zinc ions. Finally, experiments were performed with brass in a flow through column configuration on to determine if the batch results translated to effective performance in such a configuration for POU treatment.
2.0 Methods
2.1 Chemicals, Reagents, and Stock Solutions
11
2.2 Brass Media
The source of brass for the experiments was KDF-55 (KDF Fluid Treatment, Inc Three Rivers, MI) (see Figure 1), a brass granular medium consisting of only copper and zinc. The KDF-55 granules had an advertised size range between 0.149 mm to 2.00 mm and were of varying shapes. Previous work (C. Wang et al. 2014) has determined the specific surface area of the brass media to be 0.0149 m2/g, the bulk copper to zinc ratio to be 1:1 (“KDF-55 MSDS” 1988), and the surface copper to zinc ratio to be 2.5:1. To ensure consistency in the condition of the surface of the brass for all experiments, the brass was washed in 100 g batches using dionized water and stirring with a glass rod for 5 minutes. The brass medium was then recovered by vacuum filtration (0.7 µm) and dried for 48 hours in a desiccator. The brass was then stored in a sealed container inside a desiccator until needed.
12
2.3 Microbes
The microbes tested were non-pathogenic Escherichia coli(E. coli) KO11 (ATCC
55124) and MS2 bacteriophage (ATCC 15597-B1). These microbes were chosen as surrogates of representative bacteria and virus pathogens. The E. coli KO11 bacterium was chosen for its similarities to bacterial pathogens and its established use as a test organism in the evaluations of point-of-use technologies (World Health Organization 2011a; Grabow 2001). MS2
bacteriophage was chosen as a representative virus because of its similarity in morphology to pathogenic viruses and its use as a test organism in performance evaluation of point-of-use treatment technologies (World Health Organization 2011a; Young-Rojanschi and Madramootoo 2014). Aseptic technique was used for all microbial work.
The E. coli KO11 stock suspension used to spike into the experimental vessels was
grown from a frozen E. coli KO11 stock for 20 hours at 37 °C in tryptic soy broth to reach the stationary phase. The E. coli KO11 stock was then diluted serially 10-fold and enumerated for colony count by the spread plate method 9215 C (Eaton, A. D., Clesceri, L. S., Greenberg, A. E., Franson, M. A. H., American Public Health Association., American Water Works Association. 2005).
13
suspended in 1.0 ml volumes and frozen at -80°C until use. Frozen stocks of the virus are stable and can be used over periods of many years.
2.4 Test set-up for batch experiments
Batch tests for evaluation of microbial inactivation and metal removal kinetics by brass media were performed in 500 mL amber glass bottles (see Figure 2). The glass bottles were washed overnight with a solution of 10% concentrated HCl, then rinsed with ultrapure water and dried at 70 °C in an oven for 2 hours. The bottles were then filled with autoclaved carbonate buffered stock solution until needed. Filling the bottles with carbonate buffered stock solution was found to result in more consistent lead levels after spiking.
Test water was prepared in bulk immediately before the experiment by adding the stock metal solutions as needed to the carbonate buffered stock solution to achieve the desired
dissolved metal concentrations and then adjusting the pH to the target experimental value (pH=6.5 or 8.5) using 0.1 M HCl and/or 0.1 M NaOH. The vessels were emptied and filled with the test solution. Next, vessels were placed on a stirplate with a 2.5 inch Teflon stirbar spinning at 250 rpm. E. coli KO11 and MS2 were added to the vessels to achieve 105.5 CFU/mL E. coli
14
sample was plated for microbial enumeration within 24hours. Samples for metal analyses consisted of 3 mL samples which were filtered through a 0.22 µm PES syringe filter and stored at 4 °C in 9 mL polypropylene vials until metals analysis was conducted. The contents in the vessels used for the batch experiments are summarized in Table 2.
Some vessels were tested to quantify the amount of microbial inactivation provided by the copper and zinc ions released from the brass. For this test, copper and zinc ions were spiked into vessels prepared the same way as mentioned above with 105.5 CFU/mL E. coli KO11 and 105.5 PFU/mL MS2. Every two hours, copper and zinc ions were added in quantities
corresponding to the release of the copper and zinc from brass media. Samples were taken at predetermined time points to monitor the microbe concentrations in the same way as described above.
15
Table 2. List of experimental batch vessels.
Vessel
(2mM NaHCO3 ultrapure water)
Microbial control pH 6.5 Microbial control pH 8.5
2 g/L brass + 105.5CFU/mL E. coli KO11 + 105.5PFU/mL MS2 2 g/L brass + 105.5E. coli KO11 + 105.5 MS2 + 180 µg/L Pb2+ pH 6.5
2 g/L brass + 105.5E. coli KO11 + 105.5 MS2 + 1,800 µg/L Cu2+ + 180 µg/L Pb2+ pH 6.5 2 g/L brass + 1,800 Cu2+ µg/L + 180 µg/L Pb2+ pH 6.5
Stepwise addition average Zn2+ + 105.5E. coli KO11 + 105.5 MS2 Stepwise addition average Cu2+ + 105.5E. coli KO11 + 105.5 MS2
Stepwise addition average Cu2+ and Zn2+ + 105.5E. coli KO11 + 105.5 MS2
Stepwise addition greatest released Cu2+ and Zn2+ + 105.5E. coli KO11 + 105.5 MS2 2 g/L brass + 105.5E. coli KO11 + 105.5 MS2 pH 8.5
20 g/L brass + 105.5E. coli KO11 + 105.5 MS2 + 180 µg/L Pb2+ pH 6.5
2 g/L brass + 105.5E. coli KO11 + 105.5 MS2 + 180 µg/L Pb2+ no mixing pH 6.5 20 g/L brass + 105.5E. coli KO11 + 105.5 MS2 + 180 µg/L Pb2+ no mixing pH 6.5
2.5 Test set-up for column experiments
The brass granular medium was also tested in a flow-through column configuration. The brass medium (8 mL) was poured into a glass column with an inside diameter of 1 cm and a polypropylene screen at the bottom to hold the brass. The column was gently tapped against the countertop to ensure the brass settled to the bottom of the column. The depth of the brass medium in the column was about 10 cm. Tests were run at 22°C in a room with low lighting. Test water solutions of 2mM NaHCO3, pH 7, were prepared in 7 liter batches. One liter of test water was pumped through the column to rinse the brass and flush the system of any loose brass particles from the column. To test the performance of the column two flow rates were used: 4 mL/min and 48 mL/min. These flow rates correspond to a 120 seconds and 10 seconds empty bed contact time (EBCT)3 and were chosen to represent fast flow (similar to flow rates seen at a
3 Empty bed contact time is a commonly used approach to measure contact time in water treatment. It is defined as
the amount of time it takes an amount of fluid equivalent to the volume of the media to travel through the bed. Since the void volume of the column is about 60% the contact times of water with the brass in the bed can be
16
pressurized tap) and slow flow (similar to what could occur in a gravity fed pour-through configuration).
After the column was flushed, the microbe and/or metal contaminants were added to the remaining 6 liters of test water to start the challenge of the column. A list of the challenge waters tested can be found in Table 3. Two samples (5 mL), one for microbial and one for metal analysis, were collected in 9 mL polypropylene vials before and after passing through the
17
Figure 3. Diagram and picture of column test set-up
Table 3. Challenge waters for flow through column configuration
Challenge Water (2mM HCO3; pH7) 10 EBCT 120 EBCT
105.5E. Coli KO11 + 105.5 MS2 X X
105.5E. Coli KO11 + 105.5 MS2 + 180 µg/L Pb2+ X X
180 µg/L Pb2+ X
2.6 E. coli enumeration
The concentrations of culturable E. coli KO11 in the samples was determined using the spread plate method (Eaton, A. D., Clesceri, L. S., Greenberg, A. E., Franson, M. A. H.,
18
dilution 3 plates were made. The petri dishes were then allowed to dry for 5 minutes, inverted and incubated at 37 °C for 16-24 hours. Bacterial colonies on each of the three plates of any given dilution plated were counted and averaged to get the colony forming units (CFU) per 0.1 mL for the given dilution. The CFUs of each countable dilution were then combined and normalized for volume to give the CFU per 1 mL of sample.
2.7 MS2 bacteriophage enumeration
19
given dilution plated. The PFUs of each dilution were summed then normalized based on sample volume to give the PFU per 1 mL of sample.
2.8 Microbial control and metal control
For each experiment a microbial control was run alongside the experimental vessels (see Appendix 2). The microbial control was a vessel with 2 mM NaHCO3 at the experimental pH with 105.5 E. coli K011 and 105.5 MS2 and no brass or metals. Samples were taken for E. coli KO11 and MS2 enumeration at the same time as samples from the experimental vessels. For all experiments, the microbial counts in the control were within ± 1 log reduction of the initial concentrations. Microbial reductions in the control vessels were subtracted from the microbial reductions in the experimental vessels to get a net microbial reduction due to the presence of metal ions and/or brass.
To ensure that the copper and lead ions were soluble at the concentrations used in the experiment, a vessel was prepared with 2 mM NaHCO3 buffer at pH 6.5 with 1.8 mg/L Cu2+ and 0.15 mg/L Pb2+ and mixed for 24 hours with samples taken at 0 and24 hours. For both Cu2+ and Pb2+ the 24 hour concentration was within 5% of the initial concentration meaning that the metals are soluble at the concentrations and within the timeframe used in the experiments.
2.9 Metals analyses
The filtered samples were acidified with plasma pure plus grade nitric acid (SPS Science, Quebec, Canada) to 2%v/v. Metals analyses was conducted using an inductively coupled plasma mass spectrometer (ICP-MS) (Agilent 7500cx, Agilent Technologies, Santa Clara, CA)
20
dilutions made from copper, zinc, and lead 1000 ppm standards (High-Purity Standards, Charleston, SC). The ICP-MS was fed by an autosampler and counts were changed into concentrations using the calibration curves.
2.10 Experimental Design and Data Analysis
Experiments were run 3 times to determine the variability in the microbial inactivation and metal removal ability of brass. Samples in batch experiments were taken at time 0, 1, 3, 6, 12 and 24 hours for the first run of each experiment. For the second and third run of each experiment samples were taken at a time 0, and the last two times that had microbes above the limit of detection. Calculation, organization of the data and graphing was done using Microsoft Excel.
The metal removal kinetics were analyzed by fitting the data to a first-order reaction kinetics model as given by
dX/dt = - k1 * C * X (6)
Where X is the concentration of metals or microbes (ppb) k1 is the rate constant (gbrass * L-1 * hours-1)
C is the concentration of brass surface available for reaction/disinfection (gbrass* L-1) Integrated the equation becomes
Ln (X/Xo) = - k1 * C * T , (7)
21
C * T is the integral of concentration of brass available over time for reaction/disinfection (gbrass * L-1)
We assume the surface of the brass available for reaction does not significantly decrease during the experiment so C is constant and the equation becomes
Ln (X/Xo) = - k1 * C * t , (8)
where X is the dissolved metal concentration at time t (ppb), Xo is the initial dissolved metal concentration (ppb), k1 is the reaction rate constant (gbrass* L-1 * hours-1)
C is the concentration of brass surface available for reaction/disinfection (gbrass/L) and t is the time from start of experiment (hours).
The microbial inactivation kinetics were analyzed looking at the rate log10 reduction of the microbes over time. This was done by fitting a line to the data in the form of
Log (N/No) = - k2 * t (9)
Where N is the concentration of viable microbes in solution at time t (CFU/mL, PFU/mL) No is the initial concentration of viable microbes in solution (CFU/mL, PFU/mL) k2 is the inactivation rate constant (hour-1) and
t is the time from the start of experiment (hours)
Statistical analysis was done using SAS JMP 10.0.1 (SAS Institute Inc, Cary, NC). Standard least squares regression was used with a y-intercept equal to zero to obtain rate
22
analysis if all three runs obtained microbial results that were above the limit of detection of the assay method.
3. Results and Discussion
3.1 Reductions of microbes and dissolved metals by brass media
Figure 4 presents the results corresponding to the inactivation of E. coli KO11 and MS2 by brass granular media both in the presence of metal contaminants and in the absence of metal contaminants. The corresponding rate constants, k, are presented in Table 4. First, the brass granular media at a concentration of 2 g/L in water at pH 6.5 was tested for microbial
inactivation in the absence of metal ions. With an initial concentration of 105.5 CFU/ml E. coli
and 105.5 CFU/ml MS2 the brass removed the E. coli with a rate constant (k2) of 0.31 ± 0.02 hr-1 and the MS2 at with a rate constant (k2) of 0.69 ± 0.05 hr-1.
Figure 4.E. coli (A) and MS2 (B) inactivation with brass at 2 g/L mixed in 2 mM NaHCO3
buffered water at pH 6.5. Reductions for: Brass (), Brass + 180 µg/L Pb2+ (), and Brass + 180 µg/L Pb2+ + 1,800 µg/L Cu2+(). The reductions shown correspond to the measured
reductions subtracted from reductions in the microbial control without brass. (––) is the limit of detection. Symbols correspond to the average results of a minimum of 3 runs, and error bars correspond to respective standard deviations.
-6 -5
-4 -3
-2 -1
0
0 6 12 18 24
Log
(N
t
/N
o
)
Time (hr)
A.
E. coli
-6 -5 -4 -3 -2 -1 0
0 6 12 18 24
L
og
(
Nt
/N
o
)
Time (hr)
B.
23
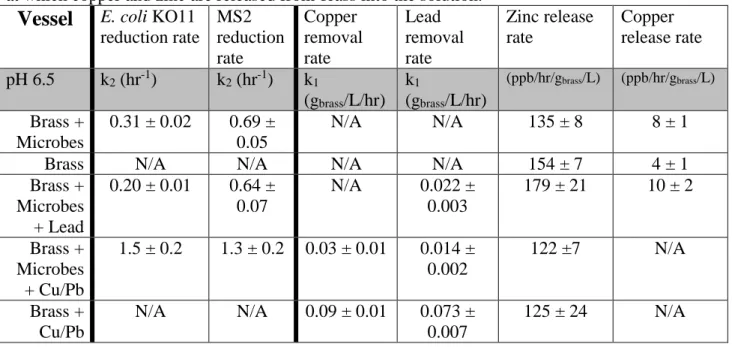
Table 4. Reaction rate constants for microbial inactivation and metal removal for brass, and rate
at which copper and zinc are released from brass into the solution.
Vessel
E. coli KO11reduction rate
MS2 reduction rate
Copper removal rate
Lead removal rate
Zinc release rate
Copper release rate pH 6.5 k2 (hr-1) k2 (hr-1) k1
(gbrass/L/hr) k1
(gbrass/L/hr)
(ppb/hr/gbrass/L) (ppb/hr/gbrass/L)
Brass + Microbes
0.31 ± 0.02 0.69 ± 0.05
N/A N/A 135 ± 8 8 ± 1
Brass N/A N/A N/A N/A 154 ± 7 4 ± 1
Brass + Microbes + Lead
0.20 ± 0.01 0.64 ± 0.07
N/A 0.022 ± 0.003
179 ± 21 10 ± 2
Brass + Microbes + Cu/Pb
1.5 ± 0.2 1.3 ± 0.2 0.03 ± 0.01 0.014 ± 0.002
122 ±7 N/A
Brass + Cu/Pb
N/A N/A 0.09 ± 0.01 0.073 ± 0.007
125 ± 24 N/A
Additionally, microbial inactivation was monitored in the presence of 180 µg/L lead, and in the presence of 1,800 µg/L copper and 180 µg/L lead. The results show that both E. coli KO11 and MS2 were inactivated by the brass media. In the instance where both copper and lead ions were in solution above the EPA limit, microbial inactivation was significantly faster than with just the brass alone. This result suggests that when there is copper and lead contamination, infectious microbes will not likely be found in the water. However, this would not be the case with just lead contamination as the rate of E. coli KO11 inactivation was lower for the vessel with 180 µg/L lead than for the vessel with no metal ions added (i.e., k2 = 0.20 hr-1 with lead ions in vessel versus k2 = 0.31 hr-1 without lead ions).
24
Figure 5: Copper (A), Lead (B) and Zinc (C) concentrations with brass at 2 g/L mixed in 2 mM
NaHCO3 buffered DI water at pH 6.5. Reductions for Brass + microbes (), Brass + 180 µg/L Pb2+ + 1,800 µg/L Cu2+ (◊) and Brass + 180 µg/L Pb2+ + 1,800 µg/L Cu2+ + Microbes (). Shown are average results of a minimum of 3 runs with standard deviations (error bars). (▪▪▪) MCL for the US EPA 1300 µg/L copper, 15 µg/L lead, 5000 µg/L zinc.
Figure 5 also shows that, in the vessels dosed with copper, the copper concentrations were reduced from 1.3 times the EPA MCL to below the MCL within an hour and to 7% of the MCL with 24 hours. For example, for one run of the vessel with brass, Cu2+, and Pb2+, the initial concentration of copper started at 1,722 µg/L and was reduced to 97 µg/L at 24 hours. As seen in Table 4 the rate constant (k) for the removal of copper was slower with the microbes present than without microbes (0.03 g/L/hr with microbes versus 0.09 g/L/hr without microbes). This result suggests that interactions between the microbes and the brass or microbes and the copper ions in
0 500 1,000 1,500 2,000
0 6 12 18 24
C op per C on ce nt ration (pp b) Time (hr)
A.
Copper
0 20 40 60 80 100 120 140 160 1800 6 12 18 24
L ea d C onc entra ti on (p pb) Time (hr)
B.
Lead
0 2,000 4,000 6,000 8,000 10,0000 6 12 18 24
Z inc C onc entra ti on (ppb) Time (hr)
C.
Zinc
Brass + Microbes Brass + Microbes + Pb2+ + Cu2+ Brass + Pb2+ + Cu2+
25
solution are reducing the rate of copper removal. The brass reduced the lead concentration from 10 times the MCL to below the MCL within 24 hours when microbes were not present. When the microbes were present the lead was reduced to 2.7 times the MCL. The lead reduction rates were also lower with microbes present than when microbes were not present (0.014 g/L/hr with microbes versus 0.07 g/L/hr without microbes).
The redox reaction that removes copper and lead from solution also releases zinc and copper into solution. Therefore the amount to zinc and copper released from the brass into the water was monitored. Release rates can be found in Figure 5 and Table 4. In all vessels not dosed with copper, the copper released from the brass was well below the EPA limit. The zinc released from the brass, however, exceeded the EPA limit after 12 to 24 hours on average with final concentrations at 0.7-1.8 times the MCL. Zinc concentrations after 24 hours were highly variable suggesting unknown factors influenced the final zinc concentration. However, zinc concentrations after 24 hours did not correlate directly with any of the removal rates for
microbes or metal ions. Zinc ions were released from the granular brass media at an average rate of 140 ppb/hr/g/L.
3.2 Contributions of brass media and metal ions to microbe inactivation
Studies in the peer-reviewed literature have shown that copper ions in solution can inactivate bacteria and viruses (Borkow and Gabbay 2005). In order to distinguish if the
26
manner every two hours to mimic the rate of release of copper and zinc ions from the brass (the concentrations of metals added can be found in Figure 6). Copper and zinc ions were added mimicking both the average and greatest release of copper and zinc from the brass described in Section 3.1. Inactivation rates of E. coli KO11 and MS2 from the vessels with just the microbes and the copper and zinc ions dosed in stepwise manner can be found in Figure 7 and Table 5.
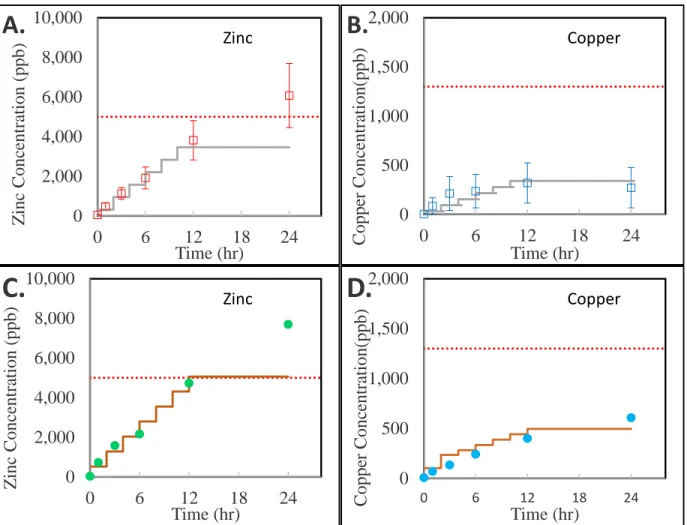
Figure 6. Zinc (A) and copper (B) added to mimic the respective average amounts of ions
released by the brass during the experiments described in section 3.1 (–).
Also, zinc (C) and copper (D) added to mimic the respective maximum amounts of ions released by the brass during during the experiments described in section 3.1 (–).
(▪▪▪)MCL for the US EPA 1300 µg/L copper, 15 µg/L lead, 5000 µg/L zinc.
0 2,000 4,000 6,000 8,000 10,000
0 6 12 18 24
Z inc C onc entra ti on (ppb) Time (hr)
A.
Zinc 0 500 1,000 1,500 2,0000 6 12 18 24
C oppe r Conc entra ti on(pp b) Time (hr)
B.
Copper 0 2,000 4,000 6,000 8,000 10,0000 6 12 18 24
Z in c C on ce nt ra ti on (ppb ) Time (hr)
C.
Zinc 0 500 1,000 1,500 2,0000 6 12 18 24
27
Figure 7:E. coli inactivation (A, C) and MS2 inactivation (B, D). Comparing 2 g/L brass
particles (●), to equivalent amounts of copper and zinc ions added stepwise to imitate Zn2+ (x), Cu2+ (), Cu2+ + Zn2+ (), Cu2+ + Zn2+ maximum released (+). 2 mM NaHCO3, pH 6.5. Symbols correspond to the average results of 3 runs, and error bars correspond to respective standard deviations. (––) is the limit of detection.
Table 5. Reaction rate constants for microbial inactivation by metal ions
Vessel
E. coli KO11 reduction rate MS2 reduction ratepH 6.5 k2 (hr-1) k2 (hr-1)
Brass + Microbes 0.31 ± 0.02 0.69 ± 0.05
Zn2+ + Microbes 0.049 ± 0.008 0.03 ± 0.01 Cu2+ + Microbes 0.106 ± 0.009 0.056 ± 0.006 Cu2+ + Zn2+ + Microbes 0.085 ± 0.005 0.072 ± 0.007
-6 -5 -4 -3 -2 -1 0
0 6 12 18 24
L og (N t /N o ) Time (hr)
A.
E. coli
-6 -5 -4 -3 -2 -1 0 10 6 12 18 24
L og (N t /N o ) Time (hr)
B.
MS2
-6 -5 -4 -3 -2 -1 00 6 12 18 24
L og (N t /N o ) Time (hr)
C.
E. coli
-6 -5 -4 -3 -2 -1 0 10 6 12 18 24
L og ( Nt /N o ) Time (hr)
D.
MS2
Brass + Microbes Average Zn2+ Detection Limit Average Cu2+
28
The results in Figure 7 and Table 5 show that both copper and zinc ions have the ability to inactivate both E. coli KO11 and MS2. The inactivation rate of the combined copper and zinc ions with no brass media (0.085 hr-1 for E. coli and 0.072 hr-1 for MS2) was significantly (p < 0.001) slower than the inactivation rate of the brass medium (0.31 hr-1 for E. coli and 0.69 hr-1 for MS2). This finding suggests that although some of the microbe inactivation during the experiments with brass can be attributed to the copper and zinc released into solution by the brass granules, over half the total inactivation observed is occurring from the presence of the brass granules, potentially at the surface the brass media. Additionally, even though the
inactivation of MS2 is faster than that of E. coli when the brass media is present, this is not the case when there is just copper and zinc ions in solution (in the absence of brass). This
observation suggests that the mechanism of inactivation associated with the brass particles has greater effect on MS2 than it does on E. coli.
3.3 Effect of pH on reduction of microbes and dissolved metals by brass media
29
Figures 8 and 9, respectively. The corresponding microbial inactivation and metal removal rate constants are summarized in Table 6.
Figure 8. E. coli inactivation (A) and MS2 inactivation (B) with brass at 2 g/L mixed in 2 mM
NaHCO3 buffered DI water at pH 6.5. Reductions for Brass + Microbes pH 6.5 (●) and Brass + Microbes pH 8.5 (). Symbols correspond to the average results of 3 runs, and error bars correspond to respective standard deviations. (––) is the limit of detection.
-6
-5
-4
-3 -2 -1 0
0 6 12 18 24
L
og
(N
t
/N
o
)
Time (hr)
A.
E. coli
-6 -5 -4 -3 -2 -1 0
0 6 12 18 24
L
og
(
Nt
/N
o
)
Time (hr)
B.
MS2
30
Figure 9: Copper (A), Lead (B) and Zinc (C) concentrations with brass at 2 g/L mixed in 2 mM
NaHCO3 buffered DI water. Reductions for Brass + microbes pH 6.5 (●), Brass + 180 µg/L Pb2+ + 1,800 µg/L + microbes pH 6.5 () Brass + microbes pH 8.5 (), Brass 180 µg/L Pb2+ + 1,800 µg/L Cu2++ microbes pH 8.5().Symbols correspond to the average results of 3 runs, and error bars correspond to respective standard deviations. (▪▪▪)MCL for the US EPA 1300 µg/L copper, 15 µg/L lead, 5000 µg/L zinc.
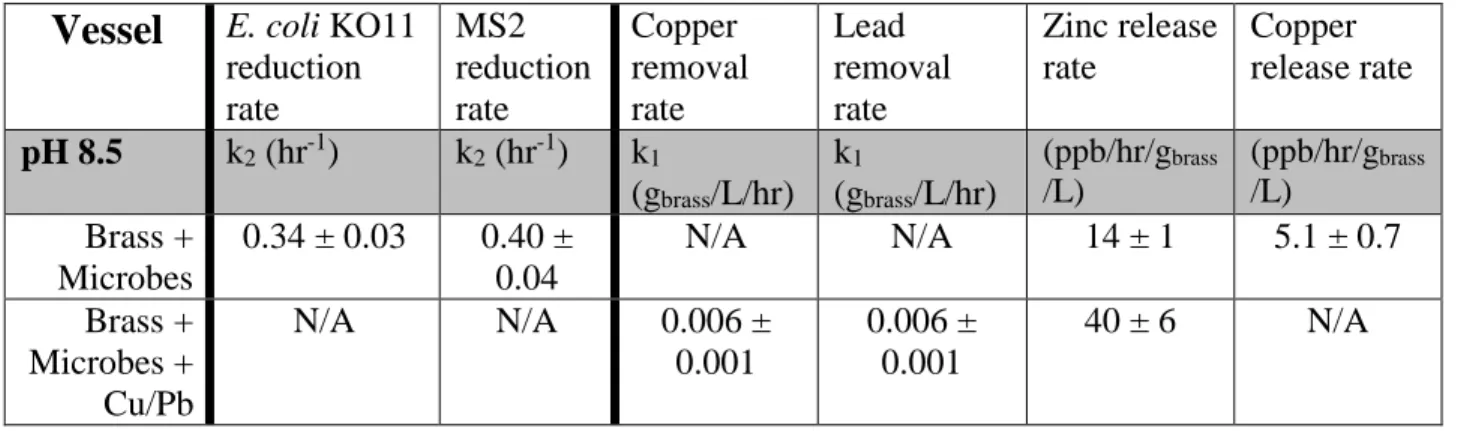
Table 6: Reaction rate constants for microbial inactivation and metal removal by brass at pH of
6.5 and pH 8.5, and rate at which copper and zinc are released by the brass granules into solution.
Vessel
E. coli KO11reduction rate MS2 reduction rate Copper removal rate Lead removal rate Zinc release rate Copper release rate
pH 8.5 k2 (hr-1) k2 (hr-1) k1
(gbrass/L/hr) k1 (gbrass/L/hr) (ppb/hr/gbrass /L) (ppb/hr/gbrass /L) Brass + Microbes
0.34 ± 0.03 0.40 ± 0.04
N/A N/A 14 ± 1 5.1 ± 0.7
Brass + Microbes + Cu/Pb
N/A N/A 0.006 ±
0.001
0.006 ± 0.001
40 ± 6 N/A
0 500 1,000 1,500 2,000
0 6 12 18 24
Co p p er Co n cen trat io n (p p b ) Time (hr)
A.
Copper
0 50 100 150 2000 6 12 18 24
L ea d C onc entra ti on (p pb) Time (hr)
B.
Lead
0 2,000 4,000 6,000 8,000 10,0000 6 12 18 24
Z inc C onc entra ti on (ppb) Time (hr)
C.
Zinc
pH 6.5; Brass + Microbes pH 8.5; Brass + Microbes pH 6.5; Brass+Microbes+Pb2++Cu2+
31
pH 6.5
Brass + Microbes
0.31 ± 0.02 0.69 ± 0.05
N/A N/A 135 ± 8 8 ± 1
Brass + Microbes + Cu/Pb
1.6 ± 0.2 1.3 ± 0.2 0.03 ± 0.01 0.014 ± 0.002
122 ±7 N/A
Figure 8 and Table 6 indicate that the E. coli inactivation at pH 8.5 and 6.5 were not significantly different (p = 0.25) with an inactivation rate constant in the 0.31-0.34 hr-1 range. MS2 inactivation was significantly slower (p < 0.001) at pH 8.5. This result suggests that granular brass media has microbial inactivation potential across the pH range that is found in a majority of natural water and in waters whose pH complies with the EPA secondary standard.
Figure 9 and Table 6 indicate that the removal of copper and lead from water was slower at pH 8.5 than at pH 6.5. At 24 hours and in the absence of microbes, copper had been reduced 96% at pH 6.5 and only 52% at pH 8.5. At pH 8.5, the brass media released less copper and zinc than at pH 6.5. This is unimportant in terms of copper release, since the copper released from the brass media was much lower than the EPA limit across both pHs tested; however, it is important in terms of zinc release. At pH 8.5 the zinc stayed well below the EPA MCL for the entire 24 hours while this was not the case at pH 6.5.
3.4 Effect of brass dose on reduction of microbes and dissolved metals by brass
media
The dose of brass in a point-of-use device could change based on the device
32
copper ions greatly increased the rate of inactivation. From unpublished experiments, the impact of brass dose on copper and lead removal found a linear relationship for both copper and lead (C. Wang et al. 2014). To examine the impact of brass dose experiments were performed using a brass dose of 20 g/L and an initial lead concentration of 180 µg/L. The results were compared to corresponding experiments using a brass dose of 2 g/L with the same initial lead concentration. The experiments were run at pH 6.5 the results can be found in Figures 10 and 11 and in Table 7.
Figure 10.E. coli (A) and MS2 (B) inactivation in 2 mM NaHCO3 buffered DI water at pH 6.5.
Reductions for 2 g/L Brass + microbes + 180 µg/L Pb2+ () and 20 g/L Brass + microbes + 180 µg/L Pb2+ (●). Symbols correspond to the average results of 3 runs, and error bars correspond to respective standard deviations. (––)is the detection limit.
-6 -5
-4 -3
-2 -1 0
1
0 6 12 18 24
L
og
(Nt
/No)
Time (hr)
A.
E. coli
-6 -5 -4 -3 -2 -1 0 1
0 6 12 18 24
L
og
(N
t/
No)
Time (hr)
B.
MS2
33
Figure 11. Copper (A), lead (B) and zinc (C) concentrations in 2 mM NaHCO3 buffered DI
water at pH 6.5. Reductions for 2 g/L Brass + microbes + 180 µg/L Pb2+ () and 20 g/L Brass + microbes + 180 µg/L Pb2+ (●). Symbols correspond to the average results of 3 runs, and error bars correspond to respective standard deviations. (▪▪▪) is theMCL for the US EPA 1300 µg/L copper, 15 µg/L lead, 5000 µg/L zinc.
Table 7. Reaction rate constants for microbial inactivation and metal removal for brass at two
doses (2 and 20 g/L), and rate at which copper and zinc are released by the brass granules into solution.
Vessel
E. coli KO11reduction rate MS2 reduction rate Copper removal rate Lead removal rate Zinc release rate Copper release rate
pH 6.5 k2 (hr-1) k2 (hr-1) k1
(gbrass/L/hr) k1 (gbrass/L/hr) (ppb/hr/gbrass /L) (ppb/hr/gbrass /L) Brass + Microbes + Lead
0.20 ± 0.01 0.64 ± 0.06
N/A 0.022 ± 0.003
179 ± 21 10 ± 2
10x Brass + Microbes + Lead
0.43 ± 0.004 0.59 ± 0.007
N/A 0.024 ± 0.002
18 ± 5 0.7 ± 0.2
0 500 1,000 1,500 2,000
0 6 12 18 24
Coppe r Conc ent ra ti on (ppb) Time (hr)
A.
Copper 0 50 100 150 200 2500 6 12 18 24
L ea d C onc entr ation ( ppb) Time (hr)
B.
Lead 0 2,000 4,000 6,000 8,000 10,000 12,000 14,0000 6 12 18 24
Z inc C onc entr ation (ppb) Time (hr)
C.
Zinc2 g/L Brass + Microbes + Pb2+ 20 g/L Brass + Microbes + Pb2+
34
Figure 10 and Table 7 indicate that the 20 g/L brass media dose resulted in 2 times faster (p <0.001) inactivation of E. coli KO11 than for a 2 g/L dose of brass media. A ten-fold increase of brass media did not correlate to a ten-fold increase in E. coli disinfection rate. In the case of simultaneous microbe and lead removal (see Figure 11 and discussion below), the E. coli
reduction rate constant k2 was 0.20 hr-1 for 2 g/L brass and 0.43 hr-1 for 20 g/L brass. Regarding MS2 inactivation, the results also indicate that the rate of MS2 inactivation with brass doses of 2 g/L and 20 g/L were not significantly different (p = 0.5) after 6 hours of contact time.
Figure 11 and Table 7 indicate that copper release was relatively low always resulting in a dissolved copper content below the EPA secondary limit with no significant difference in the amount of copper ions release at brass doses of 2 g/L and 20 g/L. The results also show that lead removal increased with brass dose. A ten-fold increase in brass media dose resulted in
approximately a ten-fold increase in lead removal (k = 0.022 gbrass/L/hr for 2 g/L brass k = 0.024 gbrass/L/hr for 20 g/L brass). Regarding zinc release, Figure 11(C) shows that for a brass dose of 20 g/L the measured dissolved zinc concentration initially increased relatively fast but then decreased. This could be because zinc started precipitating out of solution which is consistent with the cloudy appearance of the test water that was observed visually after 24 hours. The overall results in Figures 10 and 11 therefore indicate that the magnitude of microbial inactivation does not scale quantitatively with brass dose whereas lead removal does.
3.5 Effect of mixing conditions on microbial inactivation and metal removal
35
media in the bottom of a container without mixing. This configuration was tested in previous research on the use of pouches of metal granular media for microbial inactivation in stored water (Witsil 2014). Therefore, experiments were conducted to compare the effect of mixing on the microbe inactivation and metal removal by batch treatment with brass medium. Results for such experiments performed with and without mixing are presented in Figure 12 and 13 and in Table 8.
Figure 12.E. coli (A) and MS2 (B) inactivation in 2 mM NaHCO3 buffered DI water at pH ?.
Reductions for 2 g/L Brass + microbes + 180 µg/L Pb2+ with mixing (), 2 g/L Brass + microbes +
180 µg/L Pb2+without mixing (∆), 20 g/L Brass + microbes + 180 µg/L Pb2+ with mixing (●), 20 g/L Brass + microbes + 180 µg/L Pb2+ without mixing (). Symbols correspond to the average results of 3 runs, and error bars correspond to respective standard deviations. (––)is the
detection limit
-6 -5 -4 -3 -2 -1 0 1
0 6 12 18 24
L
og
(
N
t/No)
Time (hr)
A.
E. coli
-6 -5 -4 -3 -2 -1 0 1
0 6 12 18 24
L
og
(
N
t/No)
Time (hr)
B.
MS2
Mixing; 2 g/L Brass + Microbes + Pb2+ Mixing; 20 g/L Brass + Microbes + Pb2+ Not mixing; 2 g/L Brass+Microbes+Pb2+ Not mixing; 20 g/L Brass+Microbes+Pb2+
36
Figure 13. Copper (A), Lead (B) and Zinc (C) concentrations with brass in 2 mM NaHCO3
buffered DI water. Reductions for 2 g/L Brass + microbes + 180 µg/L Pb2+ with mixing (), 2 g/L Brass + microbes + 180 µg/L Pb2+ without mixing (∆), 20 g/L Brass + microbes + 180 µg/L Pb2+ with mixing (●), 20 g/L Brass + microbes + 180 µg/L Pb2+ without mixing (). Symbols correspond to the average results of 3 runs, and error bars correspond to respective standard deviations. (▪▪▪)is the MCL for the US EPA 1300 µg/L copper, 15 µg/L lead, 5,000 µg/L zinc.
Figure 12 shows that without mixing there was significantly (p < 0.001) less microbial inactivation than with mixing. After 24 hours without mixing the vessels with brass media did not have significantly different of E. coli concentrations than the control (p > 0.05)). For MS2, there was a 2 log10 inactivation in 24 hr without mixing, but with mixing there was 3.5 log10 inactivation at 6 hours and inactivation was beyond the detection limit of 5 log10 at 24 hr. These microbial log10 reduction results support the conclusion from Section 3.2 that a large portion of
0 500 1,000 1,500 2,000
0 6 12 18 24
Coppe r Conc ent ra ti on (ppb) Time (hr)
A.
Copper
0 50 100 150 200 2500 6 12 18 24
L ea d C onc entra ti on (p pb) Time (hr)
B.
Lead
0 2,000 4,000 6,000 8,000 10,000 12,000 14,000 16,0000 6 12 18 24
Z inc C onc entra ti on (ppb) Time (hr)
C.
Zinc
Mixing; 2 g/L Brass + Microbes + Pb2+ Mixing; 20 g/L Brass + Microbes + Pb2+Not mixing; 2 g/L Brass + Microbes + Pb2+
Not Mixing; 20 g/L Brass + Microbes+Pb2+
37
the microbial inactivation is taking place at the surface of the brass media and mixing facilitates the contact between microbes and brass.
Figure 13 shows that lead removal was also significantly (p < 0.001) slower when there was no mixing in the vessels. At a brass dose of 20 g/L the lead removal had a reaction rate constant of k=0.0010 gbrass/L/hr without mixing and k = 0.024 gbrass/L/hr with mixing. This result is consistent what was seen in the microbial inactivation. The rates of copper and zinc release from the brass were much smaller without mixing than with mixing. The average peak zinc concentration for a brass dose of 20 g/L was 7500 µg/L with mixing while it was only 1800 µg/L in the vessel with no mixing. Overall, the results suggest that without extensive contact between the water and the brass there is little to no microbial inactivation or metal removal.
Table 8. Reaction rate constants for microbial inactivation and metal removal for brass, and rate
at which copper and zinc are released by the brass granules into solution in test water at pH 6.5.
Vessel
E. coliKO11 reduction rate MS2 reduction rate Copper removal rate Lead removal rate Zinc release rate Copper release rate
pH 6.5 k2 (hr-1) k2 (hr-1) k1
(gbrass/L/hr) k1
(gbrass/L/hr)
(ppb/hr/gbrass/L
) (ppb/hr/gbras s/L) Brass + Microbes 0.31 ± 0.02 0.69 ± 0.05
N/A N/A 135 ± 8 8 ± 1
Brass N/A N/A N/A N/A 154 ± 7 4 ± 1
Brass + Microbes + Lead 0.20 ± 0.01 0.64 ± 0.06
N/A 0.022 ± 0.003
179 ± 21 10 ± 2
Brass + Microbes + Cu/Pb
1.5 ± 0.2 1.3 ± 0.2 0.03 ± 0.01 0.014 ± 0.002
122 ±7 N/A
Brass + Cu/Pb
N/A N/A 0.09 ± 0.01 0.072 ± 0.007
125 ± 24 N/A
Zn2+ + Microbes
0.049 ± 0.008
0.032 ± 0.01
N/A N/A N/A N/A
Cu2+ + Microbes
0.106 ± 0.009
0.056 ± 0.006
N/A N/A N/A N/A
Cu2+ + Zn2+ + Microbes
0.085 ± 0.005
0.072 ± 0.007
N/A N/A N/A N/A
38 Microbes +
Lead
0.04 0.07 0.002
10x Brass + Microbes + Lead; No Stirring
0.02 ± 0.01
0.11 ± 0.02
N/A 0.0010 ± 0.0001
4.2 ± 0.5 0.17 ± 0.03
pH 8.5
Brass + Microbes
0.35 ± 0.03
0.40 ± 0.04
N/A N/A 14 ± 1 5.1 ± 0.7
Brass + Microbes + Cu/Pb
N/A N/A 0.006 ±
0.001
0.006 ± 0.001
40 ± 6 N/A
Brass + Cu/Pb
N/A N/A 0.018 ±
0.002
0.018 ± 0.002
28 ± 4 N/A
3.6 Microbe reduction and lead removal by brass in column configuration
For POU applications, a simple and user friendly design would be to have the water treatment medium in a flow through configuration. The POU device could then be plumbed into a faucet or the user could pour water into or over a bed of media. To test the how the brass
performed in a flow-through configuration brass medium column tests were performed in the lab. Column experiments were conducted at two empty bed contact times (EBCT = 10
39
Figure 14. E. coli (A, C) and MS2 (B, D) inactivation in 2 mM NaHCO3 buffered DI water at
pH 7.0 and 22 oC. Reductions for EBCT = 10 seconds (A, B) and EBCT =120 seconds (C, D).
E. coli + MS2 + 180 µg/L Pb2+ (), E. coli + MS2 (∆).Shown are average results of 3 runs with
standard deviations
As shown in Figure 14 an EBCT of 10 seconds in the column had virtually no microbial inactivation (< 1 Log10) of E. coli or MS2 bacteriophage. At the longer contact time, EBCT of 120 seconds, microbial reductions were observed within the first 250 bed volumes (1.3 Log10 for
E. coli and 4.0 Log10 for MS2); however, those reductions decreased to nearly zero after 500 bed
volumes of water had passed through the column. A likely explanation of this phenomenon is that over time the bacteria, viruses and organic matter in the test water fouled the brass surface reducing the interaction between the microbes in the water and the brass surface. For both E. coli
-4.0 -3.0 -2.0 -1.0 0.0 1.0
0 250 500 750
L
og
(Nt/
No)
Bed Volumes
A.
E. coli-5.0 -4.0 -3.0 -2.0 -1.0 0.0 1.0
0 250 500 750
L
og
(
N
t/No)
Bed Volumes
B.
MS2-4.0 -3.0 -2.0 -1.0 0.0 1.0
0 250 500 750
L
og
(
N
t/No)
Bed Volumes
C.
E. coli
-5.0 -4.0 -3.0 -2.0 -1.0 0.0 1.0
0 250 500 750
L
og
(
N
t/No)
Bed Volumes
D.
MS240
and MS2, the microbial reductions were greater when lead ions were not present. This
observation is consistent with what was observed in the batch experiments where the presence of lead ions also resulted in a lower rate of microbial inactivation.
In addition to the microbial reductions, the extent of copper and zinc release and lead reduction of the brass granular media in column configuration were examined. The metals results can be found in Figure 15. The concentration of copper released from the brass was observed to be well below the EPA limit for all column experiments. The concentration of zinc in the effluent water also was observed to be typically well below the EPA limit in all cases, except at the beginning of the column runs with an EBCT of 120 seconds. In all test conditions, the concentration of zinc in the effluent water was greater at the beginning of the column runs and stabilized to a fairly constant value after 250 bed volumes. This observation could also be an indication that the microbes and organic matter in the test water foul the brass surface. However, other reasons could explain why zinc release could decrease over time; such as the surface of the brass could initially contain more zinc oxide which is more readily dissolved (Franklin et al. 2007) at the beginning of the experiment.
41
Figure 15: Zinc(A, D) and Copper (B, E) release and Lead (C, F) reduction in 2 mM NaHCO3
buffered DI water. Metal concentrations for 120 EBCT (A, B, C) and 10 EBCT (D, E, F). E. coli + MS2 (), E. coli + MS2 + 180 µg/L Pb2+ (○), and 180 µg/L Pb2+ (x). Shown are average results of 3 runs with standard deviations (error bars)
0.0 2000.0 4000.0 6000.0
0 250 500 750
Z inc (pp b) Bed Volumes
A.
Zinc
120 EBCT
0.0 500.0 1000.0 1500.00 250 500 750
C op per (ppb ) Bed Volumes
B.
Copper
120 EBCT
0.0% 20.0% 40.0% 60.0% 80.0% 100.0%0 250 500 750
L ea d (% re moval) Bed Volumes
C.
Lead
120 EBCT
0.0 2000.0 4000.0 6000.00 250 500 750
Z inc (ppb) Bed Volumes
D.
Zinc
10 EBCT
0.0 500.0 1000.0 1500.00 250 500 750
Coppe r ( ppb) Bed Volumes
E.
Copper
10 EBCT
0.0% 20.0% 40.0% 60.0% 80.0% 100.0%0 250 500 750
L ea d (% re moval) Bed Volumes
F.
Lead
10 EBCT
42
3.7 Copper removal from test waters by brass in a column configuration
Unpublished data collected by Chuan Wang.
The removal of copper by the brass granular medium in column configuration was previously investigated in an unpublished study by a former student, Chuan Wang (C. Wang et al. 2014). The results showed that brass was very effective (>99%) at removing copper from water (see Figure 15) even at short contact times. The ability of brass to remove copper from water was sustained for over 10,000 bed volumes before it gradually declined to near zero by 56,000 bed volumes (see Figures 15 and 16). The combined results from the previous study and this study therefore indicate that brass is much more effective at removing copper than lead from water.
Figure 16: Copper removal by brass granular media for influent copper concentration of 1000
43
Figure 16: Percent removal of copper by brass granular media from 2 mM carbonate buffered
water at pH7 with inlet concentration of 1,500 µg/L. Data from Chuan Wang
3.8 Comparison to other research on microbial inactivation and metal removal with
copper and brass
Much research has been done investigating the antimicrobial properties of copper and copper ions; however, to our knowledge very little research has been done examining metals in the form of granular media specifically for antimicrobial and metal removal properties. Witsil (2014) found that pouches containing 28.85 grams of brass at the bottom of a 4 L vessel achieved little to no microbial inactivation. This result is similar to what was found in the batch
experiments in this study in the absence of mixing of the contents in vessel. However, Witsil reported about 2 log10 E. coli reduction and 3 log10 reduction of MS2 in 48 hours without mixing when mixtures of copper, zinc and silver granules were used as the form of combined metal particles in pouches at a quantity of 28.85 grams per 4 liters of test water
In contrast to the scarce literature on microbe and metal removal by granular metal media specifically, there has been much work on the antimicrobial properties of copper. A previous study (Mathews et al. 2013) has suggested that microbial inactivation of copper surfaces is greatly influenced by direct contact with the surface instead of the ions released by the surface.
0% 20% 40% 60% 80% 100%
0 20000 40000 60000
%
C
oppe
r
R
emoval
Bed Volumes
44
In the study by Matthews et al. on the inactivation of Enterococcus hirae on dry copper surfaces, it was found that a pure copper surface inactivated 106 bacteria in 30 minutes. However, when they put a barrier over the copper to prevent direct contact between the surface and the microbes, the microbes were only reduced by 1 log10 in 3.5 hours even though the copper ions released into the droplet containing bacteria was the same. This report is consistent with what was found in Section 3.2 where vessels with brass granular media in them had significantly greater microbial reductions than vessels spiked with the equivalent amount of copper and zinc ions released by brass.
Other researchers (Shrestha et al. 2009; Thomas et al. 2015; Phelps 1905) have also suggested copper and copper alloys for water treatment. Brass, copper and silver pots have been shown to achieve 4 log10 reduction of bacteria in 48 hours (Shrestha et al. 2009). Additionally, Thomas et al. (Thomas et al. 2014) suggested using copper microparticles in an alginate matrix for reducing bacteria concentrations in decentralized waste water systems. They found that the copper loaded alginate beads were able to reduce bacterial loads by over 3 log10 in 90 minutes when added to an agitated solution at a copper concentration of 1 g/L. When mixed in a swirl flow reactor with high shear rates they found E. coli reductions of over 6 log10 in 15 minutes with the same copper loaded alginate beads (Thomas et al. 2015). These studies suggest that copper and copper alloys can reduce bacterial loads in water as was demonstrated in this present study. However, we are unaware of any examples of copper or copper alloys being used in for microbial reduction at the POU in field use conditions over long periods of time.
45
found lead and copper reduction of the devices to be in the 80% to mid-90% range. Additionally, this magnitude of reduction was sustained for all of the devices tested for up to 120% of their capacity. In a similar study (Gulson et al. 1997) investigating a pour-through BRITA filter, lead removal was reported to range from 60-80% over 250 liters and copper removals to be above 80%. The brass granular media had higher rates of copper removal (>95% for 10,000 bed volumes) but lower rates of lead removal (~20% after 750 bed volumes) than these current studies.
Removal of copper and lead from wastewater through redox reactions has been examined for both zero valent iron and zinc (Rangsivek and Jekel 2005; Li and Zhang 2007; Mubarak, El-Shazly, and Konsowa 2004; Nosier, SA, Sallam 2000). Many of the studies are conducted under much different conditions than the conditions at which the brass was tested (low pH, much higher (~100 ppm) copper or lead concentration). However, a study by Rangsivek and Jekel (Rangsivek and Jekel 2005), examined copper and zinc removal from wastewater by zerovalent iron at pH 6 and a copper concentration of 1 mg/L. Under those conditions they found the copper removal rate constant (k) to be 0.2 giron/L/hr. This rate constant is only slightly faster than what was found in in this study (section 3.1) for copper removal (0.09 gbrass/L/hr).
3.9 Implications for point-of-use treatment
In this study, the inactivation of E. coli KO11 and MS2 and the removal of copper and lead by treatment with granular brass particles was investigated in batch and column