Complex Systems Informatics and Modeling Quarterly CSIMQ, Issue 2, April, 2015, Pages 46-55
Published online by RTU Press, https://csimq-journals.rtu.lv http://dx.doi.org/10.7250/csimq.2015-2.04
ISSN: 2255-9922 online
Tool Capability in Visual EAM Analytics
Dierk Jugel1,2, Christian M. Schweda1, Alfred Zimmermann1 and Sandra Läufer1
1 Reutlingen University, Reutlingen, Germany 2Rostock University, Rostock, Germany
{dierk.jugel, christian.schweda, alfred.zimmermann, sandra.laeufer}@reutlingen-university.de
Abstract. Enterprise Architectures (EA) consist of a multitude of architecture elements, which relate in manifold ways to each other. As the change of a single element hence impacts various other elements, mechanisms for architecture analysis are important to stakeholders. The high number of relationships aggravates architecture analysis and makes it a complex yet important task. In practice EAs are often analyzed using visualizations. This article contributes to the field of visual analytics in enterprise architecture management (EAM) by reviewing how state-of-the-art software platforms in EAM support stakeholders with respect to providing and visualizing the “right” information for decision-making tasks. We investigate the collaborative decision-decision-making process in an experiment with master students using professional EAM tools by developing a research study. We evaluate the students’ findings by comparing them with the experience of an enterprise architect.
Keywords: Enterprise architecture management, visual analytics, decision-making process, collaboration.
1 Introduction
Enterprises are complex and integrated systems of processes, organizational units, resources and technologies with a multitude of relations and interdependencies. Enterprise Architecture Management (EAM) aims at providing an integrated view on all these aspects of the organization to support business & IT-alignment, optimization scenarios, quick adaption to environmental changes and other purposes. Since EAs are complex structures, it is difficult to keep track and to work out relevant characteristics. In particular, changing an architecture element requires the evaluation of impacts on other elements. The affected elements have to be analyzed by different stakeholders from their individual perspectives. These perspectives (viewpoints) require that relevant information is prepared in an adequate manner. In practice, for this purpose EA visualizations, like landscape or cluster diagrams, are used. Matthes et al. [1] outline the basic functionality of visualization techniques in an EAM tool survey. The resulting visualizations of an architecture are according to the ISO Std. 42010 [2] called views, which conform to respective viewpoints. The viewpoints describe how the different views relate and which stakeholders’ concerns are addressed thereby. Viewpoints further define how views are constructed, interpreted and used. Concerns reflect the information needs of stakeholders. All stakeholders are experts in a particular area of the enterprise and require specific viewpoints to analyze an impact for their purpose.
47 the stakeholders’ concerns is crucial therefore. Work in the area of information logistics showed that information demands depend on the tasks and responsibilities (concerns) of an organizational role [3]. Thus, the key precondition for achieving demand-oriented information supply is to understand the roles’ and stakeholders’ concerns and information demands. In [2] Stakeholders are defined as “individual, team, organization, or classes thereof, having an interest in a system”. In contrast of stakeholders, roles are logical functions within an organization. Stakeholders fill one or more roles.
Furthermore, decision-making in EAM usually requires the collaboration of many stakeholders, which have different knowledge. The stakeholders communicate to discover possible impacts for an architecture change. The impacts are often not evident and can be only discovered by stakeholders communicating with each other. Lucke et al. outline in [4] critical issues in EAM elicited from a literature review in the field of enterprise architecting. Two issues identified by the authors relate to the field of visual analytics: identifying the “right” stakeholders in a given situation and fostering stakeholders’ communication.
This article contributes to the field of visual analytics in EAM by analyzing how state-of-the-art EAM tools support this task. In pstate-of-the-articular, we review how the tools help to provide stakeholders with the “right” information and visualize it in a suitable way. This aligns with the definition of Thomas et al., who describe visual analytics as “the science of analytical reasoning facilitated by interactive visual interfaces” [5]. Both the adequate visualization and interaction models for the stakeholders [6] have to be assessed. With the mechanism of visual analytics, we seek to support social decision-making processes in EAM, which we regard as basis for well eligible and transparent architecture decisions.
The baseline of our analysis was an investigation of decision-making processes in EAM. We surveyed how master students with limited experience in the field analyze EAs with respect to a given decision scenario. Different student teams employed different EAM tools, which they could get acquainted with prior to the analysis experiment. For selecting EAM tools we used the tool classification of the EAM tool survey of Matthes et al. [1]. The authors distinguish the analyzed tools with respect to their approach along the spectrum of “flexibility vs. guidance” (c.f. [1] p. 344). Using this dimension EAM tools can be classified in “metamodel driven”, “methodology driven” and “process driven”. Each type uses a specific approach to support users in doing EAM.
“Process driven” EAM tools provide much guidance and rigid structures to perform different tasks in EAM. “Metamodel driven” tools, conversely, focus on EA information and offer only limited to no guidance for performing EAM tasks. While the “process driven” approach favors larger enterprises with well-established processes, the “metamodel driven” approach provides a maximum of ad-hoc flexibility for emerging management processes. Our hypothesis is that the result of the collaborative decision-making process is strongly dependent on the tool’s approach and the team structure. Hence, we selected the tools to broadly cover the different levels of “flexibility vs. guidance”. Further, we decided to use tools that have a substantial prevalence in practice. We are aware that the analysis’ results do not make a general point on the overall tool situation in the market. Furthermore, we reflected our findings by comparing them with the experience of an Enterprise Architect from a large company (in Germany) in the automotive industry.
48 in Section 5 by comparing them with experiences of an expert in practice. In Section 6 we conclude with a summary.
2 Related Work
In this Section we revisit related work on Visual EAM Analytics. Thomas et al. describe visual analytics as “the science of analytical reasoning facilitated by interactive visual interfaces” [5]. Keim et al. detail this definition of visual analytics in [7] as a combination of automated analysis techniques and interactive visualizations. The authors emphasize effective understanding, reasoning and decision-making as goals of visual analytics. Keim et al. describe the visual analytics process as “Analyze first, Show the important, Zoom, filter and analyze further”. This process entails an analysis phase prior to visualizing the information, which contrasts with information visualization techniques. This phase is used to reduce the amount of information displayed to prevent information overload.
In EAM practice, visualization techniques are prevalent (cf. Matthes et al. [1]), while techniques for visual analytics are scarce. The recent survey of Roth et al. [8] supports this claim and outlines typical visualization techniques, i.e. viewpoint types like “Cluster Map” or “Flow Diagram”, and investigates the visualization capabilities of EAM tools. However interactive functionalities in combination of automated analyzing techniques to enable visual analytics are not covered in the survey. Hanschke provides an operationalization of EA analysis and planning via so-called “patterns”. These patterns are described in the appendices A to C of [9]. While these patterns can be used to identify phenomena in an EA, further interaction functionality is not covered.
Buckl et al. describe in [10] an approach to automatically generate EA visualizations from an EA model. In [11] Schaub et al. describe a conceptual framework to automatically generate interactive EA views. The framework bases on the work of [10]. The interaction possibilities focus on interactive editing the underlying EA documentation. Therefore, functionality like transaction support is added to the approach.
In [12] Naranjo et al. present an approach to visually analyze enterprise models. Their focus lies on visualizing the overview without losing the context. The approach provides analysis mechanisms like topology analysis or metamodel specific analysis. The authors develop a framework named “PRIMROSe” that defines a process to string together different model transformations for automatically generated visualizations. Each step of the process produces specific knowledge, e.g. a result of an analysis or information needed to visualize that enriches the enterprise model.
Jugel et al. describe in [13] an interactive cockpit approach towards visual analytics. Thereby, they translate the cockpit approach, which is well established for activities like controlling power plants or space missions, to the field of EAM. A cockpit is characterized as a room, in which several screens simultaneously provide different viewpoints on the system under consideration. The authors describe requirements of such a cockpit in an abstract manner. One of the requirements is so-called “What-If analyses”, which provides automated analyses based on user interactions in the cockpit and the visualization of the results thereof. In [14] Jugel et al. detail the requirements by describing interactive functions and their conceptual realization.
3 Research Study
49 3.1 EAM Scenario
The participants of the study have to address a typical EAM scenario using the provided EAM tool. According to the studies setting, the participants are external consultants, who are employed to reveal optimization potential in an EA. In particular, the client enterprise is interested in potentials regarding the business support provided by the information systems, and the utilization of underlying technical components. Shorthanded, two distinct activities of EAM with detailing tasks are addressed:
T1. Technology management
T1.1. Analysis of technical components in architectural domains T1.2. Analyses of technical components’ usage by information systems T1.3. Identification of consolidation potential
T1.4. Identification of re-usable technology stacks T2. Landscape management
T2.1. Analysis of the information system landscape
T2.2. Identification of phenomena, like redundancies, inhomogeneities and missing business support
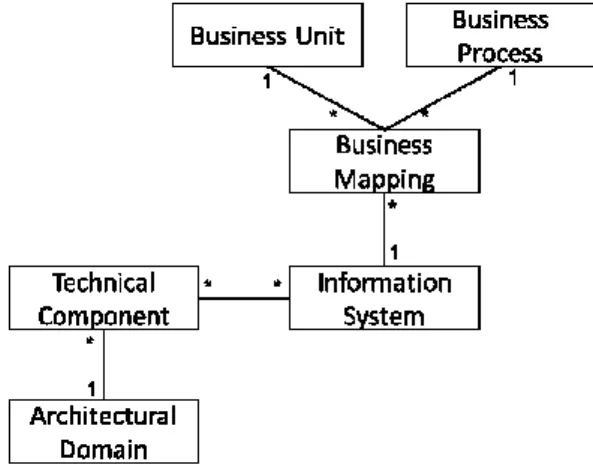
The exemplary EA description provides information for performing the different aforementioned tasks. The description’s metamodel covers the different aspects (see Figure 1). Thus each tool usually has a different naming and definitions for the metamodel concepts, we employ the terminology and definitions of Hanschke [9] as a common basis. For T1.1 the metamodel concepts Architectural Domain and Technical Component are needed, while performing T1.2 requires the concepts Technical Component and Information System. T1.3 and T1.4 are based on the tasks T1.1 and T1.2 and thus no additional metamodel concepts are needed. Lastly, T2.1 requires the concepts Information System, Business Unit, Business Process and a mapping between them named Business Mapping. T2.2 is based on T2.1 and therefore requires no additional concepts.
Figure 1. Metamodel of the EA description in our EAM scenario
50 3.2 Research Process
The master’s level course consists of 25 students. We form four groups (Group 1 to 4) using different EAM tools to perform tasks T1.1 to T2.2. Group 5 supervises the activities of the other groups and provides guidance and clarification, where requested. Group 1 to 4 are given the opportunity of get acquainted to their EAM tool of a period of four weeks. Similar tasks are handed to the students for this training phase to be performed on the showcase scenarios of the tool vendors.
The experiment takes place with groups 1 to 4 performing the tasks separately under observation of the lecturers and group 5. At the beginning of the experiment, a client representative (one student of group 5) presents the EAM scenario and answers open questions. Then, the teams get two hours to analyze the EA and to perform the tasks. Afterwards, each group presents their findings to the client and delivers an experience report.
4 Research Study Results
The results presented in this section are based on the observations of group 5 and on the experience reports of groups 1 to 4. The students’ experiences strongly depend on the used EAM tool. As described in Section 1 the tools have different approaches regarding flexibility and guidance. Table 1 describes the tools in more detail. Due to legal reasons we unfortunately have to anonymize the tool names. However, all tools have a substantial prevalence in practice.
Table 1. Description of EAM tools, which we evaluate
Name Description
Tool A A tool that targets small and medium sized companies, which want to have a small tool that is easy to use. The tool supports
the metamodel driven approach and is very data-centric.
Tool B It supports the methodology driven approach. The tool provides capabilities to manage the EA model as well as rich
visualization capabilities. It targets small and medium sized companies that have a clear method how they want to do EAM.
Tool C A very powerful tool supporting the process driven approach. It targets large companies that need governance processes and
workflows to manage the EA.
The fictional enterprise described in the EAM scenario is an enterprise with a small EAM department that hasn’t implemented complex guidance and decision-making processes. Moreover, the students aren’t experts in EAM and not part of the enterprise. Thus the students have struggled with complex tools with a great functionality in managing large groups in EAM.
All groups discovered various optimization potentials, yet have employed different ways for doing so. This indicates a usability conflict between flexibility and guidance. On the one side, tools with limited functionality are easy to use but are quickly stretched to their limits. On the other side, tools with much functionality and guidance aren’t easy to use and require a great induction effort. With such tools, the students became lost in the variety of different menus and they quickly lost the overall context they want to analyze.
The visualization capabilities are very different in the tools. Tool A provides system-side preconfigured visualizations that cannot be adapted to cover specific stakeholders’ information demands. In addition Tool A provides functionality to freely draw custom visualizations. Thereby the stakeholder can import architecture objects from the repository in which the stakeholder is interested in.
self-51 configured visualizations, had problems to satisfy their information demands. Thus the students had to use the predefined views from the vendor’s showcase.
Another aspect is the ability of displaying different views side-by-side. Only Tool C offers a dashboard capability that puts selected, mostly quantitative views, side-by-side. For more qualitative views displaying the dependencies between architecture elements, all tools were limited to one view at a time. Hence, the students had to follow navigation routines through several menus to switch between different views, loosing track in-between. Further, Tool B does not provide a mechanism for displaying the views in-line, but exports them to image files of various formats. Exporting capabilities and screenshots were used by all groups to put different views side-by-side for their in-depth analysis.
We disprove the statement in Section 2, that there are no visual analytics capabilities in EAM tools. In Tool A we identified visual analytics capabilities based on freely draw visualizations. There are different interactions for displaying dependencies to other objects or a drill-down functionality to get more information. However, these interactions only work with visualizations that are created manually in free drawing mode. Nevertheless the capabilities in EAM tools confine oneself to information visualization. In the other tools the interaction possibilities with views are very limited. We have only identified statically defined links between views and links to the documentation of the architecture element represented by a symbol.
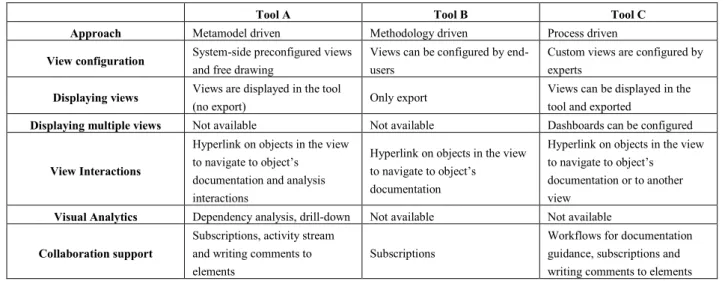
Lastly, the students have explored collaboration and communication functionalities. Tool A and Tool B provide a subscription mechanism to get notifications in case of model changes. Whereas Tool B sends e-mails with change notifications to subscribers, Tool A provides an activity stream. The activity stream has different modes to see (a) all changes in the model, (b) only changes of subscribed objects or (c) open topics. Users have the opportunity to discuss about architecture elements by adding comments. Comments can be classified as open topics. All architecture elements having a related comment classified as open topic are displayed in the activity stream in open topic mode. However, comments can only be added in the detail view of the element and not as a discussion result within views. Tool C does not provide an activity stream, but gives users the opportunity to write comments on architecture elements to discuss with other users about issues. Furthermore, Tool C provides a functionality to define tasks and assign them to users. Additionally, there is a workflow mechanism to realize complex documentation and approval processes in case of changing architecture elements. Table 2 summarizes the tool’s capabilities we explored.
Table 2. Comparison of tools we explored
Tool A Tool B Tool C
Approach Metamodel driven Methodology driven Process driven
View configuration System-side preconfigured views
and free drawing
Views can be configured by end-users
Custom views are configured by experts
Displaying views Views are displayed in the tool
(no export) Only export
Views can be displayed in the tool and exported
Displaying multiple views Not available Not available Dashboards can be configured
View Interactions
Hyperlink on objects in the view to navigate to object’s
documentation and analysis interactions
Hyperlink on objects in the view to navigate to object’s
documentation
Hyperlink on objects in the view to navigate to object’s
documentation or to another view
Visual Analytics Dependency analysis, drill-down Not available Not available
Collaboration support
Subscriptions, activity stream and writing comments to elements
Subscriptions
52
5 Evaluation
In this section we critically reflect on the findings of performing the research study described in Table 1. For this purpose we interviewed an Enterprise Architect from a large German company in automotive industry to compare the students’ results with the experience of an expert in practice. In addition, we want to derive suggestions how to improve the collaborative decision-making process.
We design an expert interview to answer the following research question: What is the state of practice in analyzing and planning Enterprise Architectures? Thereby we want to know which methods and tools are applied to plan an EA. In addition we ask in detail whether and how visualizations are used and what capabilities they provide. Next, we ask how decision-making processes look like and how communication and collaboration are supported. Lastly, we examine how decisions are captured and whether decisions of the past can be used to take better decisions in the future.
On the subject of capabilities to configure views we have identified different approaches. The big challenge with tools using system-side preconfigured or expert-based configured views is the missing ability to satisfy ad-hoc information demands of stakeholders. According to the survey and the interview, a collaborative decision-making process requires certain flexibility to define views dynamically. It isn’t possible to configure the set of needed views and reports before the stakeholders discuss about an issue, because the information demands of the stakeholders evolve during the discussion based on the findings thereof. A decision-making process is a knowledge-intense process that does not follow a predefined path yielding dynamic information demands that cannot be completely foreseen. The ability of free drawing is a beneficial to satisfy such dynamic information demands, although this technique is error-prone and time-consuming. The ability to dynamically configure views is also a mechanism to satisfy such information demands. However, end-user configuration mechanisms have to be realized in an intuitive way without confusing the users. The expert we interviewed confirmed that view configuration is a real challenge in practice. Missing possibilities to react dynamically to changing information demands leads to the situation that in practice spreadsheets with exported information are very common.
The lack of functionality for displaying views side-by-side is also a relevant topic. Only one tool has a functionality named dashboard. However, dashboards are subject to expert configuration. Therefore, ad-hoc dashboards are not possible. According to our study, displaying views in side-by-side is necessary for a collaborative decision-making process, because the stakeholders need different views to satisfy their information demands. The expert confirms that in practice displaying views in side-by-side is an unsolved challenge. Views are often considered one by one loosing the overall context in-between. The expert also pointed out that the dashboard approach is insufficient because of the limitations of a display. Furthermore, it isn’t adequate to only display views side-by-side. He emphasized that views have to be linked to each other to recognize interrelations between them. Enterprise Architectures consist of several layers like Business Layer, Application Layer and Technology Layer [15], with the EAM-tools confining views often to a single of these layers. But the relationships to other layers are of high importance during analyses. One group of stakeholders, for example, considers the information system landscape on application layer because they want to consolidate information systems. To answer the question which information systems can be consolidated, there is important information on other layers. The business support, for example, relates the information systems to the business layer to identify systems that provide similar business relevant functionality.
53 case, inconsistencies may arise in the discussion and the stakeholders have to care about this issue by checking and exporting the latest version of the view before they make decisions.
Moreover; we explored the interaction capabilities in working with views. Only Tool A provides basic functionalities, but do not provide comprehensive support for decision-making processes. Further interactions to annotate objects like graphical highlighting and filtering or adding notes as described in [14] may help stakeholders in analyzing and planning EAs. The other tools provide more limited interactions, like links between views. The expert confirms that limited configuration and interaction possibilities within views are the reason why in practice stakeholders often analyze with spreadsheets of exported information. Typically, stakeholders use views as a starting point to analyze an issue in a certain context. When the information demands increase, the stakeholders often switch to spreadsheets. The aforementioned drawbacks of exported views also apply to spreadsheets and hence impede effective collaboration with other stakeholders. Further, the comments of stakeholders are only accessible by the person who has access to the document. This situation is hindering the communication between stakeholders in a collaborative decision-making process. Furthermore, architecture changes in the document also have to be re-imported into the EA repository, which is a potential source of error and causes additional expenditures.
The last capabilities we explored are the communication and collaboration functionalities. In Tool A and Tool C we identified mechanisms to annotate architecture elements to document findings, open topics or decisions. However, these annotations are only accessible in the details view of an element and not on the graphical views. Thereby, stakeholders are likely to lose the context, if they analyze a graphical view. Mechanisms for accessing the comments also in the visualization are deemed beneficial. The comment functionality is further designed to support asynchronous communication. As a means for documenting decisions and findings in a face-to-face meeting of stakeholders, these mechanisms are not completely suitable. The expert confirmed that decisions and findings are usually recorded using textual protocols, which in turn lack a linkage to the architecture elements and views. Therefore, valuable knowledge about the reasons behind an architectural decision is lost, once the involved stakeholders leave the enterprise or change their organizational roles.
The activity stream, provided by Tool A, is a beneficial mechanism for keeping stakeholders up-to-date. However, such activity stream inherently bears the danger of information overload. To limit the displayed information stakeholders can subscribe to distinct architecture elements. While the advantages of such mechanism are evident, it limits the stakeholders’ center of attention to existing architecture elements. Future elements, which share characteristics that the stakeholders are interested in, cannot be targeted by the subscription mechanism.
A final challenge for EA decision-making is to identify stakeholders that should be involved in decision-making processes. Such information is not present in the tools, neither in the EAM documentation of the enterprises. More sophisticated subscription mechanisms, in which the stakeholders can express their interest in a particular part of the EA, could provide a basis for identifying relevant stakeholders. Further, enterprise social networks based on discussions between stakeholders in the past may help to find the right people for a particular decision. Additionally, a mechanism is needed to inform involved stakeholders automatically for example by using an activity stream with intelligent automated filter and subscription mechanisms. Nevertheless, the communication and collaboration capabilities provided by Tool A are the best among the analyzed tools.
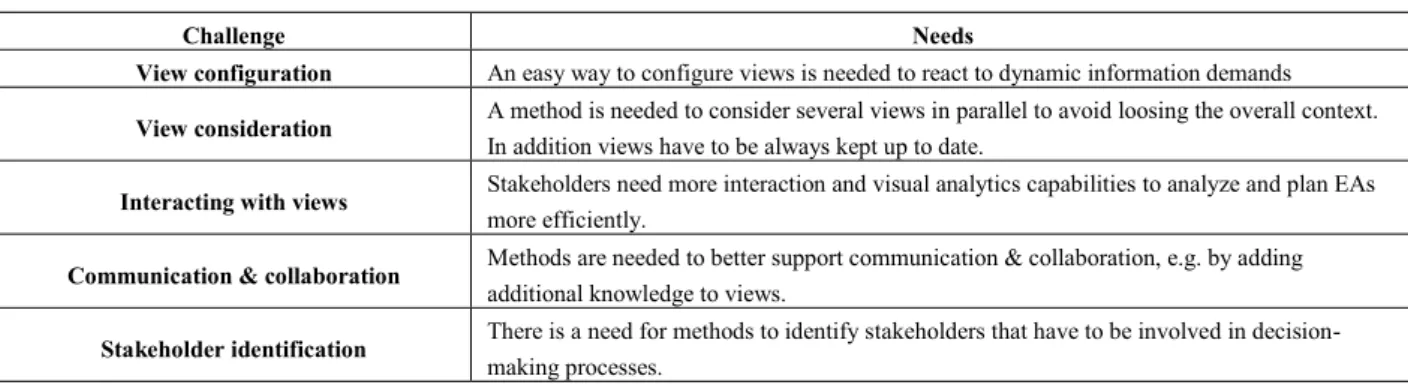
54 information. Another challenge concerns interaction capabilities with views. In the tools we have seen early approaches of interactions, like navigation to an object’s documentation. Only one tool provides visual analytics capabilities like a dependency analysis. The expert believes that missing interaction and visual analytics capabilities are a reason why in practice visualizations are only partly used in analyzing and planning EAs. We also share this opinion. Furthermore we have identified a challenge concerning communication and collaboration support. Stakeholders need capabilities to add additional knowledge about issues, findings and decisions. This knowledge has to be visible within views and should be accessible by all involved stakeholders. Stakeholders also need capabilities to keep track about current discussions and changes. Lastly, the stakeholder identification is a big challenge. Prior to start analyzing and planning an EA the stakeholders that are necessary have to be involved. Thereby there are stakeholders that are responsible for a part of the EA, which have to be analyzed, but there are also stakeholders that are experts in a specific field and can provide valuable information to take better decisions. Table 3 illustrates these challenges and needs we discovered.
Table 3. Challenges and needs in decision-making processes
Challenge Needs
View configuration An easy way to configure views is needed to react to dynamic information demands
View consideration A method is needed to consider several views in parallel to avoid loosing the overall context.
In addition views have to be always kept up to date.
Interacting with views Stakeholders need more interaction and visual analytics capabilities to analyze and plan EAs
more efficiently.
Communication & collaboration Methods are needed to better support communication & collaboration, e.g. by adding
additional knowledge to views.
Stakeholder identification There is a need for methods to identify stakeholders that have to be involved in
decision-making processes.
6 Conclusion and Future Work
In this paper we present a study investigating visual analytics capabilities in state-of-the-art EAM tools and the tools’ support for collaborative decision-making processes. In a first step, we employed master students for our study to get initial results. In addition we performed an expert interview with an enterprise architect of a large German company in automotive industry. Afterwards we matched both results and discover six challenges in analysis & planning decision-making processes. Our results show that visual analytics capabilities are not well supported by the investigated EAM tools and the use of visual analytics in EAM practice is not common. There is a need to support visual analytics capabilities to analyze and plan EAs more efficiently. Configuring views as well as the consideration of views in parallel are also big challenges. Furthermore, the provided support for collaboration between stakeholders in decision-making is scarce. This yields the impression that prevalent EAM tools focus on documenting EAs and not on supporting collaboration or decision-making. This is also mirrored in the workflow support provided by some tools, which is useful to facilitate clearly structured processes, like documentation or quality assurance. Knowledge-intense processes are contrariwise not well supported by the tools.
55 Future work in this area includes a broader study on visual analytics in EAM tools, involving a more sophisticated EAM scenario and a larger number of EAM tools. On the one side, we envision to employ enterprise architects with practical experience for external validation of the results. On the other side, we plan to repeat the study with more students at another university to contribute to an understanding how the students’ prior knowledge in EAM and enterprise modeling affects the results of such a study. In addition we want to repeat the expert interview with more experts to get a broader insight into the state of the practice. Finally, we use the results of the presented and subsequent studies to refine our approach presented in [13] and [14]. We seek to develop the approach to a comprehensive mechanism to support stakeholders in the decision-making process by using visual analytics, improving the stakeholders’ collaboration, and enhancing information identification.
References
[1] F. Matthes, S. Buckl, J. Leitel and C.M. Schweda, Enterprise Architecture Management Tool Survey 2008. Technical Report, Chair for Informatics 19, Technical University of Munich, 2008.
[2] International Organization of Standardization, ISO/IEC/IEEE 42010 - Systems and software engineering — Architecture description, Technical Standard, 2011.
[3] M. Lundquist, Demand and Use: Improving Information Flow within Small-scale Business Contexts. Licentate of Engineering, Department of Computer and Information Science, Linköpings Universitet, 2007. [4] C. Lucke, S. Krell and U. Lechner, Critical Issues in Enterprise Architecting - A Literature Review, in
Proceedings of Sustainable IT Collaboration Around the Globe, 16th Americas Conference on Information Systems (AMCIS), August 12-15, Lima, Peru, 2010, pp. 305-315.
[5] J. Thomas and K. Cook, Illuminating the Path: Research and Development Agenda for Visual Analytics, IEEE Press, Los Alamitos, 2005.
[6] D.A. Keim, F. Mansmann, J. Schneidewind, J. Thomas and H. Ziegler, Visual Analytics: Scope and Challenges, in Simoff, S.J., Böhlen, M.J., Mazeika, A., Eds. Visual Data Mining, Lecture Notes in Computer Science, Vol. 4404, Springer Verlag, Heidelberg, 2008, pp. 76-90. http://dx.doi.org/10.1007/978-3-540-71080-6_6
[7] D.A. Keim, G. Andirenko, J.-D. Fekete, C. Görg, J. Kohlhammer and G. Melacon, Visual Analytics: Definition, Process, and Challenges, in Kerren, A., Stasko, J.T., Fekete, J.D., North, C., Eds. Information Visualization. Lecture Notes in Computer Science, Vol. 4950, Springer Verlag, Heidelberg, 2008, pp. 154-175. http://dx.doi.org/10.1007/978-3-540-70956-5_7
[8] S. Roth, M. Zec and F. Matthes, Enterprise Architecture Visualization Tool Survey 2014, Technical Report, Chair for Informatics 19, Technical University of Munich, 2014.
[9] I. Hanschke, Strategisches Management der IT-Landschaft (3rd Edition), Hanser Verlag, Munich, 2013. http://dx.doi.org/10.3139/9783446435858
[10] S. Buckl, A.M. Ernst, J. Lankes, F. Matthes, C.M. Schweda and A. Wittenburg, Generating Visualizations of Enterprise Architectures using Model Transformation (extended version), in Enterprise Modeling and Information Systems Architectures – An International Journal, Vol. 2(2), Gesellschaft für Informatik (GI), 2007, pp. 3-13.
[11] M. Schaub, F. Matthes and S. Roth, Towards a Conceptual Framework for Interactive Enterprise Architecture Management Visualizations, in Modellierung, Bamberg, Germany, 2012.
[12] D. Naranjo, M. Sánchez, J. Villalobos, Towards a Unified and Modular Approach for Visual Analysis of Enterprise Models, in 18th International Enterprise Distributed Object Computing Conference Workshops and Demonstrations, IEEE Press, 2014, pp. 77-86. http://dx.doi.org/10.1109/EDOCW.2014.20
[13] D. Jugel, M. Falkenthal, C.M. Schweda, M. Pretz, A. Zimmermann, Von der Softwarekartographie zur Corporate Intelligence, in Horbach, M., Ed. Informatik 2013, Lecture Notes in Informatics, Vol. P-220, Gesellschaft für Informatik, September 16-20, Koblenz, Germany, 2013, pp. 1393-1407.
[14] D. Jugel and C.M. Schweda, Interactive functions of a Cockpit for Enterprise Architecture Planning, in 18th International Enterprise Distributed Object Computing Conference Workshops and Demonstrations, IEEE Press, 2014, pp. 33-40. http://dx.doi.org/10.1109/EDOCW.2014.14
[15] The Open Group, ArchiMate 2.1 Specification, Technical Standard, 2013.
[16] M. Lundquist, K. Sandkuhl and U. Seigerrroth, Modelling Information Demand in an Enterprise Context: Method, Notation and Lessions Learned, in International Journal Systems Modeling and Design, Vol. 2(3), IGI Publishing, 2011, pp.74-96. http://dx.doi.org/10.4018/jismd.2011070104
[17] K. Sandkuhl, Information Demand Patterns, in Proc. PATTERNS 2011, The Third International Conference