SOCIOECONOMIC STATUS AND OVERWEIGHT: USING A “FUNDAMENTAL CAUSE” PERSPECTIVE TO EXAMINE RELATIONSHIPS ACROSS TIME AND PLACE
Jessica Claire Jones-Smith
A dissertation submitted to the faculty of the University of North Carolina at Chapel Hill in partial fulfillment of the requirements for the degree of Doctor of Philosophy in the Department of Nutrition of the Gillings School of Global Public Health.
Chapel Hill 2010
ABSTRACT
Jessica Claire Jones-Smith:Socioeconomic Status and Overweight: Using a “Fundamental Cause” Perspective to Examine Relationships Across Time and Place
(Under the direction of Barry M. Popkin, PhD)
Historically, in lower income countries, women with lower socioeconomic status (SES) have had a lower risk of overweight compared to their higher SES counterparts. However, with increasing rates of overweight worldwide, contemporary data suggest that even in some developing countries, lower SES women now have a higher risk of overweight compared to higher SES women.
We use data from women (n=556,352) in 41 lower income countries to determine whether the prevalence of overweight has increased disproportionately among low SES women compared to high SES women during the last two decades. We also assess whether the direction of the relationship between SES and overweight has changed for women in these countries. Furthermore, we examine whether there are country-level contextual features that are saliently associated with comparatively faster overweight prevalence gains among low SES women.
We find that the relation between SES and overweight has changed direction from positive to inverse in only five countries. However, in approximately 30-50% of the countries, the increases in overweight prevalence over time have been faster in the lowest SES populations compared to the highest SES populations. Country-level economic development was positively associated with faster increases in overweight prevalence among the lower wealth women. The fastest gains in low SES populations were seen in countries that had relatively higher GDP and lower levels of income inequality.
Overall, this study indicates that, predominantly, in lower income countries, low SES women are still less likely to be overweight than high SES women. However, a shift in the burden of
ACKNOWLEDGEMENTS
This work would not have been possible without the input, advice, guidance and support of many people. Most importantly, I am grateful to my advisor, Barry Popkin, who has taught me to think deeply and critically about all scientific inquiry--my own as well as the work that informs mine. He has encouraged me to follow my research interests and has challenged me to hone my
hypotheses and situate them within the “bigger picture.” He’s always had an open mind about the direction that I decided to take, but has also rightly challenged me to defend my decisions and my thinking. In addition to being a great scientist, Barry has been a caring and generous human being who has understood my life challenges and obligations, and who has many times calmed me down when on the verge of freaking out.
I also am extremely grateful to all the members of my committee: Dr. Penny Gordon-Larsen for pushing me to be clear and succinct and to attempt to articulate the public health importance of any piece of research and especially for the intensive editing of my verbose manuscripts. Dr. Arjumand Siddiqi, for always suggesting another reading outside my own area that proves to be instrumental for my thinking and for having such thoughtful holistic comments. Dr. David Guilkey, revered by all who know him (or have even heard of him) for his mastery of all things econometric, for always being available to give such expert advice on all of my statistical questions. Dr. Linda Adair for always coming back to the research question and the appropriate interpretation and challenging me to think in this way. Dr. Ka He, for his honest critiques and attention to organization and detail.
This work would not have been possible without the programming expertise of Phil Bardsley, who lead the team in assembling all the data and who turned me on to advanced programming options that systematized much of my analysis. Also, to Diane Kaczor and Rick O’Hara for help in assembling the data sets.
TABLE OF CONTENTS
LIST OF TABLES ... xiii
LIST OF FIGURES ... xiv
I. Introduction ... 1
II. Specific Aims ... 3
III. Literature Review ... 5
A. Socioeconomic Status and Health: A Fundamental Cause Perspective ... 6
B. Empirical Tests of Fundamental Cause Theory ... 7
C. Socioeconomic Status and Overweight from a Fundamental Cause Perspective ... 9
D. Does Country-level economic development affect how SES is related to overweight? ... 11
E. The Social Shaping of Overweight during a period of rapid development in china ... 14
F. Summary ... 15
IV. Methods ... 17
A. Data Source and Study Population for Specific Aims 1 & 2 ... 17
B. Measurement of Key Variables for specific Aims 1 & 2 ... 18
Anthropometry ... 18
Socioeconomic Indicators ... 18
SES-Specific Overweight Prevalence Increases... 19
Slope Index of Inequality (SII) ... 20
Change in Slope Index of Inequality ... 21
Country-Level Economic Development ... 21
C. Data Source and Study Population for Specific Aims 3 ... 22
D. Measurement of Key Variables for specific Aim 3 ... 23
Calendar Time ... 23
Birth Cohort... 23
Urbanicity ... 23
Smoking ... 24
V. Is the burden of obesity shifting to the poor across the globe? Time trends among women in 41 lower- and middle income countries (1992-2007) ... 25
A. ABSTRACT ... 25
B. BACKGROUND ... 27
C. METHODS ... 29
Data Sources ... 29
Key Variables... 30
Statistical Analyses ... 31
D. RESULTS ... 33
Sample Characteristics ... 33
Wealth results ... 33
Education results ... 33
Comparing wealth and education results ... 34
Sensitivity Analyses ... 34
Country-level economic development ... 35
E. DISCUSSION ... 35
Conclusions ... 39
VI. Cross-national comparison of time trends in overweight inequality by socioeconomic status in 37 countries (1991-2007) ... 53
B. BACKGROUND ... 54
C. METHODS ... 56
Data Sources ... 56
Key Variables... 57
Statistical Analyses ... 59
D. RESULTS ... 62
GDP and SES-specific rates of increase in overweight prevalence... 63
Income inequality as a modifier of the relation between GDP and SES-specific rates of increase in overweight ... 64
Sensitivity Analyses ... 65
E. DISCUSSION ... 65
Economic Development ... 66
Income Inequality ... 68
Limitations ... 69
Conclusions ... 70
VII. The Emergence of a Disparity in Overweight Status in China (1989-2006) ... 87
A. ABSTRACT ... 87
B. BACKGROUND ... 89
C. METHODS ... 90
Study population ... 90
Dependent Variables ... 91
Independent Variables ... 92
Effect Measure Modifiers and Covariates ... 92
Statistical Analyses ... 93
D. RESULTS ... 97
BMI and Overweight Findings in Females ... 97
BMI and Overweight Findings in Males ... 98
Sensitivity Analyses ... 99
E. DISCUSSION ... 99
Conclusion ... 102
VIII. Synthesis... 121
A. OVERALL GOALS AND SUMMARY OF KEY RESULTS ... 121
B. SYNTHESIS OF KEY RESULTS ... 122
Emerging trends in social patterning of overweight in developing countries: testing the predictions of theory and experts ... 122
Overweight prevalence and trends in prevalence between low and high SES women: is the disease burden of overweight shifting toward those in with lower SES? ... 123
The double-edged sword of development ... 123
The long view: How does overweight prevalence become socially differentiated over time in the context of rapid development? ... 125
C. LIMITATIONS AND STRENGTHS ... 126
Study Sample ... 126
Representation of Socioeconomic Status ... 126
Cross-country comparability ... 127
D. IMPLICATIONS FOR POLICY AND RESEARCH ... 128
Changing disease burden among populations with low socioeconomic status in developing countries ... 128
“Health in All Policies” ... 128
E. Future Directions ... 130
LIST OF TABLES
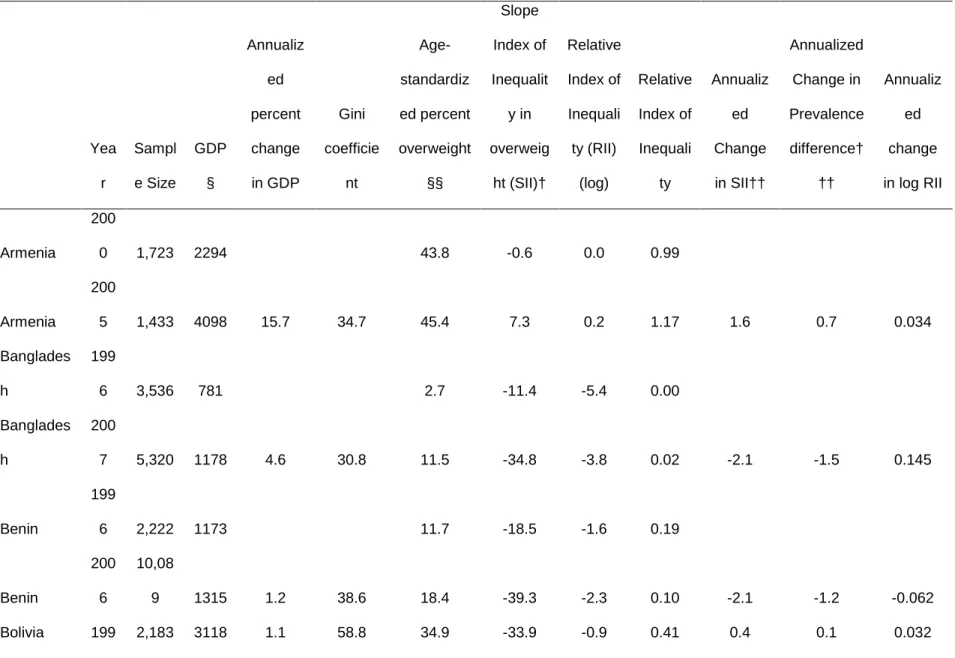
Table 1. Age-standardized overweight prevalence difference between lowest and highest wealth quintile† for each country in each year (country-year, N=103) and difference in annualized prevalence growth rate between lowest and highest wealth quintile over survey period in each country
(N=37)†† ... 41 Table 2. Age-standardized overweight prevalence difference between lowest and
highest education group† for each country in each year (country-year, N=111) and difference in annualized prevalence growth rate between lowest and highest wealth quintile over survey period in each country
(N=41) †† ... 45 Table 3. Comparison of difference in annualized prevalence growth rate† between
lowest and highest SES groups over survey period in each Asian country using standard BMI cutpoint (BMI≥25) to Asian-specific cutpoint for Asian
countries (BMI≥23) ... 50 Table 4. Countries included and years surveyed and selected country-level sample
characteristics. ... 72
Table 5 . Meta-regression of change in slope index of inequality for overweight on
GDP+ and percent change in GDP ... 81 Table 6. Selected Sample Characteristics for First and Last Survey Year by Sex
(1989 & 2006) ... 104
Table 7. Mean BMI, Prevalence of Overweight* and Unadjusted Odds Ratios for
Overweight for Women by Education and Year ... 106 Table 8. Mean BMI, Prevalence of Overweight* and Unadjusted Odds Ratios for
Overweight for Men by Education and Year ... 108
Table 9. Random effects linear regression models of the association between
education and BMI over survey period ... 110 Table 10. Random effects logistic regression models of the association between
LIST OF FIGURES
Figure 1. Annualized difference in overweight prevalence growth rate between lowest and highest wealth group by country-level GDP per capita (with
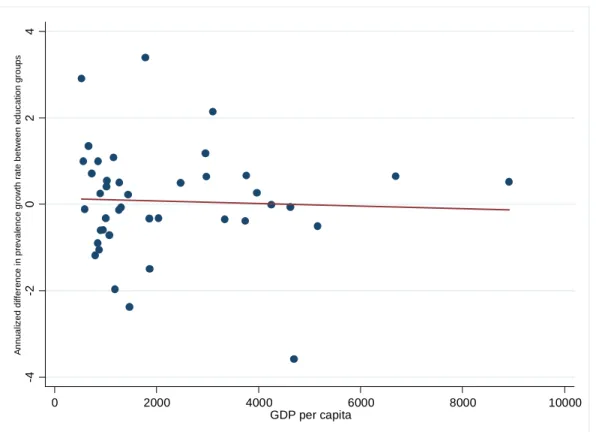
regression line) ... 51 Figure 2. Annualized difference in overweight prevalence growth rate between lowest
and highest education group by country-level GDP per capita (with
regression line) ... 52 Figure 3. Illustration of SII, Change in SII and indications for SES-specific growth
rates over time. ... 82
Figure 4. Annualized change in slope index of inequality for overweight between first and last survey year and 95% confidence interval, ordered according to
first year GDP. ... 83 Figure 5. Predicted change in slope index of inequality in overweight by country-level
GDP† and country-level of income inequality††. ... 85 Figure 6. Predicted BMI Trajectories for Women (1989-2006), (a) Older Cohort and
(b) Younger Birth Cohort ... 115 Figure 7. Predicted Odds Ratios for Overweight (BMI≥25) for Highest Education
Group Compared to each Lower Education Group (1989-2006) for
Women, (a) Older and (b) Younger Birth Cohorts ... 117 Figure 8. Predicted BMI Trajectories for Men (1989-2006), (a) Older and (b) Younger
Birth Cohorts... 118 Figure 9. Predicted Odds Ratios for Overweight (BMI≥25) for Highest Education
Group Compared to each Lower Education Group (1989-2006) for Men,
LIST OF ABBREVIATIONS
BMI Body Mass Index
CHNS China Health and Nutrition Survey
DHS Demographic and Health Survey
GDP Gross Domestic Product
FCT Fundamental Cause Theory
HR Hazard Ratio
IFLS Indonesia Family Life Survey
Kg Kilogram
M Meter
OR Odds Ratio
RII Relative Index of Inequality
SII Slope Index of Inequality
SES Socioeconomic Status
I.
INTRODUCTION
Rapid economic and demographic change is often accompanied by shifts in the population burden of disease; as economic development increases, the burden of disease generally transitions from a state in which infectious diseases predominate to a state in which chronic conditions constitute the largest share of disease burden. Despite these large changes in the predominant types of
disease, the largest disease burden across time and place has continued to fall on populations in the lowest socioeconomic positions. Multiple theories have been formulated to explain the relationships between low socioeconomic status and high burden of disease. One such theory is fundamental
cause theory (FCT), which emphasizes the persistence of the relationship between SES and disease
over time, despite radical changes in the predominant diseases and their causal intermediates. FCT hypothesizes that higher income groups utilize their flexible resources to respond to changing environments and disease risk, which ultimately results in higher SES groups experiencing a lower disease risk compared to lower SES groups. In addition, fundamental cause theorists assert that, since predominant diseases and their intermediary pathways will likely change, scientific investigation focused on the distal role of social conditions is warranted.
compared to higher SES women. In comparison to many other chronic diseases, weight gain and overweight can develop over a relatively short period of time. This quality positions weight gain and overweight prevalence as good candidate outcomes to examine how the disease implications for socioeconomic status group change as context changes, over a short, contemporary time period of 5 to 20 years.
Since the above mentioned seminal cross-national studies did not follow the same countries through time, it is unclear whether, within a given country, the burden of disease by socioeconomic status actually changes as economic development increases, or whether these relationships are only seen using cross-sectional snapshots of countries at varying GDP. If longitudinal country-level or individual-level findings are not consistent with previous work from a single point in time, it would challenge the assumptions and theories of the relationship between economic development, socioeconomic status and overweight.
II.
SPECIFIC AIMS
Motivated by the theoretical framework of fundamental cause theory, the goal of this work was to investigate whether the disease burden of overweight among adults in low-and middle-income countries is actively shifting toward lower SES groups within these countries as well as whether country-level contextual features are associated with a disproportionate burden of overweight among low SES groups.
The specific objectives of this project were to:
1) Describe the time trends in overweight prevalence levels for high and low SES populations in low- and middle-income countries, and to determine how frequently the increases in
overweight prevalence are higher for lowest education and wealth populations compared to highest education and wealth groups in each country.
To assess time trends in overweight among women we used repeated cross-sectional, nationally representative data from women aged 18-49 (n=556,352) in 41 low- and middle-income countries to determine the prevalence of overweight (body mass index ≥25) at each survey wave by wealth quintile and educational attainment (separately). We calculate the SES-specific prevalence difference and prevalence growth rate over time for each country and determine which group experienced faster rates of increase in overweight prevalence. We hypothesized that we’d find only a few countries for which the overweight prevalence has become higher among the lowest SES groups, compared to the highest, but that a substantial number of countries would display faster rates of increase in
overweight prevalence among the lowest SES populations in comparison to the highest.
2) Determine whether relatively a faster rate of overweight prevalence increase among the lower wealth population was associated with level of and change in economic development over time and whether these associations varied by country-level income inequality.
lowest wealth groups in each country using the regression-based Slope Index of Inequality (SII). Using wealth quintiles as SES categories enabled the interpretation of the change in SII between the first and last survey years dually as the disproportionate increase in overweight prevalence by higher or lower wealth populations. Meta-regression was employed to examine the associations between economic development and disproportionate increases in overweight prevalence by SES, as well as whether these associations varied by country-level income inequality. We hypothesized that
economic development and change in economic development would be positively associated disproportionate overweight increases among the low SES populations.
3) Finally, we aimed to examine how BMI trajectories and risk of overweight become different according to SES over time in the context of one rapidly developing country, China. We
hypothesized that in 1989 high SES women would have overweight risk higher or equivalent to lower SES women, but that by 2006, high SES women will have a significantly lower
overweight risk.
III.
LITERATURE REVIEW
Obesity risk varies by socioeconomic status (SES) in countries around the globe. However, the specific social patterning of obesity risk by SES appears to differ by country-level economic development. Historically, it has been noted that, in lower income countries, populations with lower SES have a lower risk of obesity, while in higher income countries populations with lower SES often have the highest risk of obesity. Recent evidence suggests that even in some low- and middle- income countries, women with low SES now have higher risk of obesity than women with high SES in these countries [1]. Due to lack of country-level longitudinal analyses, it is unclear whether the burden of obesity actually shifts to the lowest SES groups as countries experience increases in economic development, or whether the documented country- level GDP differences are only seen in single time point, cross-sectional, between-country comparisons. We seek to explore whether, and under what conditions, the overweight disease burden disproportionately shifts away from high SES groups and toward lower SES groups within lower- and middle-income countries. We then use longitudinal data from China to track differences in BMI and overweight trajectories according to SES in order to investigate the “social shaping” of overweight among adults during a time of rapid economic development.
The majority of the literature on SES and health is based on cross-sectional work in highly developed countries. From this work, in the fields of public health and epidemiology, multiple theories have been established to explain the sociology and biology behind the persistent relationship
Fundamental cause theory provides theoretical grounding for the hypotheses posed in this
proposal. We begin with an overview of fundamental cause theory; then we explore how fundamental cause theory may be a useful framework for examining the relationship between SES and overweight in developing nations over a relatively short contemporary time period. Next, we provide additional background and rationale for testing Aim 1, and subsequently for Aim 2.
A.
S
OCIOECONOMICS
TATUS ANDH
EALTH:
A
F
UNDAMENTALC
AUSEP
ERSPECTIVELow socioeconomic status is associated with increased risk for many leading causes of morbidity and mortality [3-6]. The increased risk for disease among the poor is not a new
phenomenon, but rather one that has persisted at least since early enumerations of cause-specific deaths in 1830 by Villerme [7]. Even as countries around the world have undergone epidemiologic transitions, during which the predominant disease burden has shifted from infectious to chronic disease, the largest disease burden continues to fall on those with the lowest socioeconomic position [7].
Multiple theories have been put forward to explain the underlying relationship between low SES and increased risk for morbidity and mortality. One such theory is the fundamental cause theory, which emphasizes the persistence of the association between low socioeconomic status and higher risk for disease throughout time and place [8]. Fundamental cause theory (FCT) distinguishes between distal and proximate causes of disease and asserts that the predominant diseases and their proximate causes have changed, but low socioeconomic status remains a more distal and
and, to a large degree, is attributable to lifestyle factors, such as diet and exercise. Having low socioeconomic status is associated with lack of access to early preventative health care, lack of health knowledge, lack of money to spend on healthful food or exercise facilities, and decreased acceptable outdoor space for exercise, all of which influence healthfulness of lifestyle and prevention of chronic disease [7]. Cardiovascular mortality rates are higher in groups with low SES compared to those with high SES [10]. This example illustrates that although, over time, the predominant disease have changed from infectious to chronic, and their proximate causes from sanitation to lifestyle, low SES continues to be the predisposing distal factor for increased exposure to disease-promoting proximate causes.
Furthermore, FCT asserts that “health enhancing knowledge and technology come to have effects on population health through a thick distribution of social, political and economic
circumstances” and that as diseases become more under human control, the disparities in disease outcomes will actually widen because the “uneven distribution of new knowledge and technology results in a powerful social shaping of health disparities” [11 (p 374 & 370)]. SES acts as a distal cause that shapes the level of exposure to health-promoting or health-harming proximate risk factors.
In addition to powerfully shaping exposure to risk factors, FCT suggests that the broad mechanisms by which SES becomes inversely related to the predominant diseases of the day is that groups with the highest socio-economic status command flexible resources, such as knowledge, money, and power that enable them to respond to changing disease risk and stigma, whereas groups that lack such resources cannot make the same types of adjustments with the same ease.
Resultantly, these lower SES populations come to experience higher rates of the predominant diseases [6]. This purposeful process has been called a “social shaping of disease”, and refers to the changes that higher SES populations make to preserve health or avoid stigma around health
behaviors or certain disease states, once medical knowledge, technology or stigma changes [11].
Phelan and co-authors test the hypothesis that flexible resources play a key role in disease disparities, by examining the socioeconomic disparities in diseases classified as preventable and nonpreventable [6]. The logic behind this empirical test is that, if little is known about the prevention or treatment of a disease, then flexible resources should not alter the incidence of or mortality from such a disease. Using data from the National Longitudinal Mortality Study, Phelan and colleagues found evidence in support of their hypotheses—the relationship between socioeconomic status and mortality was of greater magnitude in the preventable causes of death compared to the generally nonpreventable. These findings were consistent across racial/ethnic groups and gender [6].
C.
S
OCIOECONOMICS
TATUS ANDO
VERWEIGHT FROM AF
UNDAMENTALC
AUSEP
ERSPECTIVERecent shifts in the burden of overweight and obesity among social class groups around the world may be a case of fundamental cause “in action”, in which groups with the highest SES begin to experience decreased risk of the prevailing disease in comparison to those with lower SES.
Overweight and obesity were once considered diseases of affluence, limited to people in high-income countries or to only people of highest SES in lower- and middle-income countries[13]. In 1989, a review of existing studies from 130 countries with varying levels of development, using data collected between the years 1933 and 1988, found this to be the case, with the most consistent findings among women[13]. The primary conclusions were that among low income countries, higher SES women had higher prevalence of obesity, but among high income countries, higher SES women had lower prevalence of obesity, compared to the lowest SES women[13]. However, this relationship was reexamined in 2004 using contemporary data from 37 low- and middle-income countries, and a different dynamic was noted. Even in some lower- and middle-income countries, the higher SES groups had lower prevalence of obesity compared to the lowest SES groups [1]. Contemporaneously, it was reported that for many countries around the world, even lower income countries, the disease burden of overweight had surpassed the disease burden of underweight [14].
The shifts in the prevalence and social patterning of obesity may reflect the changing social and environmental context for both high and low SES groups and differences in response to these changing contexts. Those in the highest social positions to may adjust based on new health risks and medical knowledge or stigma to lower their risk of disease, while the changes in context may have different meaning and manifestation for those in lower SES groups and these groups may lack the flexible resources to adjust in a health-preserving way to the new contexts.
Changes in the social patterning of overweight in developing countries is particularly
low SES populations in high income countries have a higher prevalence of overweight [2], these same explanations do not yet hold much weight in most developing countries. If the rates of
overweight prevalence increase are faster in low SES populations compared to high, this gives some suggestion of a purposeful process on the part of the higher SES populations to avoid overweight in the face of a changing environment. Documenting changes in the social distribution of overweight in transitional countries can begin to test if a “social shaping” of overweight is underway in these contexts.
Within countries at varying levels of GDP, the SES-obesity relationship could be rapidly changing. In comparison to many other chronic diseases, weight gain and obesity can develop over a relatively short period of time. This quality positions these disease states as good candidate
outcomes to examine how different social groups respond to a changing disease burden, over a short, contemporary time period of 5-20 years. If high SES groups adjust their response to changing environments and disease burdens, we’d expect that as countries experience later stages of
epidemiologic, demographic and nutrition transitions, the prevalence gains will be experienced disproportionately in the lower SES groups and the higher SES groups will experience smaller gains.
A few recent studies have used repeated cross-sectional studies to begin to investigate the SES-obesity trends in a single country. Repeated cross-sectional data from Brazil indicates that between the 1970s and early 2000s, obesity continued to increase among women in the lower social class groups; however, women in the highest social positions, who once had the highest prevalence of obesity, did not experience any increase in obesity prevalence [16]. As a result, now, among Brazilian women, those in low socioeconomic positions now have the highest prevalence of obesity in some regions and have an equivalent prevalence in others [16, 17]. The abatement of obesity
prevalence in the highest socioeconomic status groups coincided with a national health education campaign targeted at preventing obesity [16]. From a fundamental cause perspective, even though this campaign may not have been targeted only at higher socioeconomic groups, perhaps these groups were most able to respond to the new information about changing health risks.
Survey (NHANES) in the US between 1971 and 2001 to examine trends in the SES-obesity
relationship among US adolescents [18]. They found that, although obesity prevalence increased for almost all racial/ethnic, income and age groups, for older adolescents, the prevalence increased significantly more in the poorest groups [18]. A similar study of US adults also found that in non-Hispanic White women and men, the highest SES groups had the smallest increase in obesity prevalence over time [19].
D.
D
OESC
OUNTRY-
LEVEL ECONOMIC DEVELOPMENT AFFECT HOWSES
IS RELATEDTO OVERWEIGHT
?
The two seminal, multinational studies which examined the direction of the relationship between SES and obesity in countries of high and low GDP [1, 13], have done so considering only one point in time. Therefore, it is uncertain whether, within a given country, the SES-obesity risk relationship changes in response to a change in GDP over time, or whether this association is only seen in comparisons between countries. It is also uncertain whether higher GDP countries more often have faster overweight prevalences among the lower SES populations over time.
higher income countrymates. As lower GDP countries increase their GDP, food likely becomes relatively cheaper and more abundant for all populations, thus increasing the likelihood of exceeding one’s energy needs in all income groups and increasing the overall prevalence of obesity. Increased options for work may draw low SES individuals away from farming and into the formal labor market, which may result in a greater decrease in energy expenditure for this group only.
Further, since the findings of an inverse relationship between SES and obesity risk in higher GDP countries are most consistent for women and not for men, it has been hypothesized that ideal body size is an influential factor in realized body size, and that this is more influential for women then for men [13, 20-22]. Extending this rationale, it is possible that, either ideas about desirable body shapes/sizes change for only higher income individuals, due to greater access to media influences. Alternatively, change in the ideal body shapes could be pervasive for all groups, but only the highest SES groups have the resources to attempt to achieve the thinner body habitus in the new
environments.
According to fundamental cause theory, the population-level, differential disease burden associated with low and high SES groups changes as 1) total disease prevalence changes 2) medical and common knowledge about the disease state changes, and/or 3) social perception of the disease or its associated behaviors changes. We might then expect that low SES begins to impart a higher risk for obesity/overweight only after the total prevalence of obesity/overweight has increased to a substantial degree. Increasing GDP is highly correlated with improvements in medical
technologies/information, so the pool of knowledge about overweight and obesity—its prevention, treatment and consequences—is likely concurrently increasing as prevalence increases.[23]
If the preceding logic regarding how changes in GDP might drive changes in the SES-obesity risk relationship were indeed true, it would stand to reason that more egalitarian societies would see less of a change in obesity risk imparted by low SES with the transition to higher GDP levels. In other words, under this scenario, income inequality might be an important moderator of the effect of increasing GDP. At the contextual level, low societal income inequality has been associated with greater investment in human capital, higher social cohesion and lower levels of relative
societal commitment to provision of public goods, having low SES in a country with low levels of
income inequality might be associated with a lower differential in obesity/overweight by SES group
initially, as well as less change in the differential as GDP increase. SES groups may experience less disparate access to media influences and healthcare, and to resources to respond to changing health risks as GDP increases in low income inequality contexts. Having low SES in a developing country with high income inequality is likely associated with a greater risk for undernutrition when the country has low GDP which would likely result in a higher risk for obesity among the high SES groups and a larger differential in obesity risk, initially. In such a country, if GDP were to increase substantially, basic provisions and changes in livelihood options would likely lead to decreases in the amount of undernutrition and increases in overweight/obesity, particularly among low SES groups. At the same time in this setting, as food access is increased among the low SES groups, high SES groups may experience greater access to health technologies and information [23], which could change the social perception of obesity/overweight and the knowledge pool about causes and prevention of this
disease. Perhaps this results in obesity/overweight becoming socially undesirable and, ultimately, in an abatement of prevalence gains in the higher SES groups.
However, it must be noted that much of the theory and testing of income inequality, social environments and health effects has been predominantly focused on high-income countries. Whether income inequality works in similar ways in lower-income countries is less certain. In middle-income countries, it is conceivable that lower levels of income inequality give lower income individuals better access to newly obesogenic environmental features [15].
We examine whether countries with higher GDP with be most likely to exhibit faster
which exceeding caloric needs is easily achievable for all groups. We also test whether nations with more egalitarian distribution of income and resources, have smaller disparities in overweight prevalence by SES.
Our multinational comparisons will have the unique ability to provide clues about the role of changing nation wealth, the pervasiveness of obesity health disparities by social class in countries around the world, and about the conditions in which these disparities are most prevalent (for example, income inequality). Tracking changes in the social patterning of obesity using this multicountry, repeated cross-sectional design enables exploration into how changes in economic and social contexts affect the obesity risk conferred by social class.
E.
T
HES
OCIALS
HAPING OFO
VERWEIGHT DURING A PERIOD OF RAPID DEVELOPMENTIN CHINA
A comparative study between China and the U.S. using data from 1993 found that, in China, those with the highest SES reported the most unhealthy lifestyle patterns, while the opposite was true for the US [25]. However, there are more recent indications that the chronic disease burden is shifting toward the poor in China [26-28]. And, in fact, it has been reported that socioeconomic status
(represented by education) is inversely related to poor health, suggesting a gradient as seen higher income countries [29].
We use China as a case study to investigate the “social shaping of disease” (in this case, overweight) in a rapidly developing country [11]. The dramatic increase in overweight prevalence in China over the past 20 years provides an excellent opportunity to investigate how the burden of overweight by social class may have changed over time [30]. China has experienced extremely rapid increases in economic development and national wealth over the last 20 years [31]. With this
economic growth and market restructuring have come major changes in food and physical activity environments and norms [26, 32, 33]. Economic development has been associated with improved medical knowledge and technologies as well as exposure to Western media, which is believed to influence desired body size, especially among women [21].
We hypothesize that a social disparity in the relative odds of overweight has emerged since the late 80s in China. Since an inverse relationship between SES and overweight seems to be particularly robust among women in developed countries around the world [13], we anticipate higher BMIs and overweight in women of high SES in the that in the late 80s and early 90s, high SES women will have higher or equal mean body mass index (BMI) and odds of overweight, transitioning to higher mean BMI and higher odds of overweight in low SES women by 2006. Furthermore, we hypothesize continual gains in BMI among individuals of low SES, and reduced gains or a leveling-off of gains over time among individuals of high SES. We further hypothesize sex differences with higher or equivalent gains in BMI and overweight risk for high SES men compared to lower SES men.
F.
S
UMMARYThis research intends to investigate changes in the relationship between individual
IV.
METHODS
A.
D
ATAS
OURCE ANDS
TUDYP
OPULATION FORS
PECIFICA
IMS1
&
2
We identified 41 countries for which data are publically available, which contained the key variables of interest, and in which there were repeated measurements over time (≥2 surveys). Data for these analyses come from several sources. The majority of the data (39 out of 41 countries) are from Demographic and Health Surveys (DHS), which use a multistage cluster sample design to obtain a nationally representative household sample, and are administered primarily in lower- and middle-income countries. The surveys involve repeated cross-sections, are performed approximately every five years, and collect information about key demographic characteristics, fertility,
contraception, health and nutrition. The DHS questionnaires contain a standardized core
questionnaire, to enable cross-country comparisons, while still being tailored for each country in other subsections [34]. Additionally, we used data from the Indonesian Family Life Survey (IFLS) and the China Health and Nutrition Survey (CHNS). These surveys each use a multistage cluster sample, and are they are representative of a large portion of the countries in which they are conducted. IFLS is representative of half of the provinces in Indonesia, while CHNS is representative of 9 provinces (out of 22 provinces total) in China.
maintain sample comparability over time, we restrict our main analyses for these countries to this subset of women.
B.
MEASUREMENT OF KEY VARIABLES FOR SPECIFIC AIMS 1 & 2
A
NTHROPOMETRYIn all surveys, height and weight were measured by trained technicians using standard techniques [35, 36]. We used Body Mass Index (BMI) (kg/m2) to classify people as overweight (BMI≥25) according to WHO guidelines [37]. Although lower BMI cutpoints have been established as “action points” for disease risk in Asian populations, it is still recommended to use the standard cutpoints to enable international comparisons of overweight and obesity prevalence [38]; therefore we use the cutpoint BMI≥25 for main analyses. We focused our analyses on overweight rather than obesity because obesity prevalence was extremely low in many of our sample countries and since overweight has been associated with increased cardiometabolic disease risk [39].
AGE
Age was collected for each individual in all surveys and controlled for by direct
standardization using the WHO standard world population [39, 40] to allow greater comparability between countries and within countries over time. Direct standardization is recommended for cross-country comparisons due to widely varying population age structures across countries. To obtain age-standardized overweight prevalence rates, we applied the each country’s age-specific obesity rates to a standard population structure [40].
S
OCIOECONOMICI
NDICATORSIndividual socioeconomic status was represented by wealth and education, in separate analyses, in order to explore the robustness of the results to different indicators of SES.
Wealth. Wealth indicators were queried in all of the surveys. A wealth index has been created
asked in all surveys, as well as some country-specific variables. Principal components analysis was used to weight each of the components and generate a total wealth score for each family in each country in each survey wave [41]. The Indonesian Family Life Survey and the China Health and Nutrition Survey also collected information regarding household assets and these were entered into country-specific and year-specific principal components analysis to create a wealth index comparable to the DHS index for each of these countries in each survey wave. For the analyses, the country and survey-year specific quintiles of wealth score were used to create a categorical variable for wealth.
Edcuation. All the surveys contain information about the participant’s highest level of
educational attainment. Education was categorized based on the educational milestones: no formal schooling, primary school, secondary school, tertiary school when appropriate. If less than 2% of the population attended tertiary school in any of the survey waves for each country, the tertiary category was combined with the secondary category to avoid unstable estimates. Secondary education was then treated as the highest education group in these countries.
SES-S
PECIFICO
VERWEIGHTP
REVALENCEI
NCREASESWe use absolute differences in prevalence by SES group, absolute change in prevalence over time within each SES group, and absolute difference in prevalence growth rates between SES groups. We chose absolute measures rather than relative because each one-point increase in the percent of the population with overweight is meaningful and interpretable. Additionally, there were a number of countries with a very low prevalence in the lowest SES group and a fairly high prevalence in the highest SES group; this combination means that fairly small absolute increases the low prevalence groups equate to large relative increases that could not be matched in the high
prevalence groups except by tremendous absolute increases. Take, for example, Chad: the lowest education group has a prevalence of ~4% in 1996 and ~7.5% in 2004, for an absolute change of 3.5 points and a relative change of 87%. The highest education group has a prevalence of ~35% in 1996 and to experience a similar relative change of 87%, they would have to increase absolute prevalence by 30 points by 2006. We therefore felt that the more reasonable and meaningful comparisons would be in the difference in the absolute increase in prevalence in each group.
S
LOPEI
NDEX OFI
NEQUALITY(SII)
To summarize the level of inequality in overweight prevalence by SES group, we estimated the SII. The SII is a recommended measure for quantifying the absolute level of inequality in a health outcome when within country time trends and cross-country comparisons are of interest [23]. The SII accounts for the mean level of health by socioeconomic group as well as the proportion of the population in each group [23]. It is a regression-based measure that is obtained by regressing the mean health status of each SES group on the fractional rank of each SES group (ridit score), ranked highest to lowest; it assumes a linear relationship between SES group and the health outcome.
In our case, we regressed the age-standardized overweight prevalence for each wealth group on the fractional rank of each wealth group:
where j denotes wealth group. Every individual in the same wealth group is assigned the same ridit score and age-standardized overweight prevalence so that the regression is self-weighted by the number of individuals in each SES group [42]. The resulting regression coefficient β1 is the SII and represents the difference in overweight prevalence moving from the highest (0) to the lowest (1) group. The SII was calculated for each country in each survey year.
C
HANGE INS
LOPEI
NDEX OFI
NEQUALITYWe estimated the change in the SII between the first and the last survey year for each country with the following model:
(Age-standardized overweight prevalence| country)jt= α +β1(ridit scorejt) + β2(middle survey yeart) + β3(last survey yeart) + β4((ridit scorejt)*(middle survey yeart)) +β5((ridit scorejt)*(last survey yeart)) + ε.
In this model, j denotes wealth group, t denotes the year in which the cross-sectional survey was performed, and survey year is represented with indicator variables. The coefficient on the ridit score (β1) gives SII in the first survey year. The change in the SII between the first and last survey years is represented in the interaction between ridit score and last survey year, coefficient β5. The change in the SII is the change in the magnitude of inequality in overweight levels. It also is indicative of the differential rate of increase in overweight prevalence between the high and low wealth groups, since it is calculated within countries and, by using wealth quintiles, we’ve constrained the amount of change that could be due to change in proportion in each wealth group.
C
OUNTRY-L
EVELE
CONOMICD
EVELOPMENTWe use gross domestic product (GDP) per capita adjusted for purchasing power parity (PPP) and inflated to the 2005 international dollar value (referred to henceforth as GDP for short) to
was obtained for all years between the first and last survey wave for each country from the World Bank World Indicators Database [44].
Change in Economic Development. To capture the level of change in economic development
over the survey period we calculated the average annual percent change in GDP per capita (PPP).
C
OUNTRY-L
EVELI
NCOMEI
NEQUALITYWe used the Gini coefficient to represent country-level income inequality, which is a commonly used indicator [45]; it assesses the proportion of the income shared by the proportion of the population [46]. The Gini coefficient ranges from 0 to 1, where 0 would mean that everyone in the population had the same income and 1 means that 1 person has 100% of the income. We used the average Gini coefficient across the survey period for each country, obtained from the World Bank Indicators Database [31]
C.
D
ATAS
OURCE ANDS
TUDYP
OPULATION FORS
PECIFICA
IMS3
For Aim 3, data were from the China Health and Nutrition Survey (CHNS) which began data collection in 1989 and has been implemented every 2 to 3 years since, resulting in 7 observational periods and the most recently available data coming at 2006. The CHNS uses a multistage cluster sample design to survey individuals within nine provinces in China. To obtain the sample from these nine provinces, the counties inside the provinces were stratified by income then a weighted sample of four cities or counties was selected. Within these areas, neighborhoods were randomly selected and within the neighborhoods, households were selected randomly from a community household roster and all members in each household were interviewed. The household roster was used to follow up each of the originally sampled households as well as new households formed from previous
The CHNS includes individual, household, and community level surveys conducted by trained field workers; the current analysis utilizes information from each of these surveys.
Our analyses are limited to non-pregnant women and men who were surveyed at least one time and were younger than 50 years at their first included measurement and older than 18 years during at least one of the survey waves (measurements from age 18 and above are included for individuals who aged into our eligible sample).
D.
M
EASUREMENT OFK
EYV
ARIABLES FOR SPECIFICA
IM3
In addition to anthropometry and education described above for Specific Aims 1 & 2, Specific Aim 3 utilized the following measures:
C
ALENDART
IMEWe include calendar year to represent time and interact it with education group in the regression models to assess the education group-specific growth in BMI/overweight risk over time. Calendar time is recoded from 0 (1989) to 17 (2006) and is used as an ordinal variable.
B
IRTHC
OHORTDue to the fact that China has undergone major upheavals and social change during distinct historical periods, such as the Great Leap Forward and Famine in the 1950s, the Cultural Revolution in from the mid-1960s to 1970s and then the post-Maoist reforms from the late 1970s onward [49] we hypothesize that growing up in different eras may modify the SES-overweight relation and its change over time. Birth cohort was categorized into 2 levels to keep adequate sample size yet distinguish between populations growing up during different periods in China. The sample was divided between participants born between 1939-1959 (inclusive) and those born in 1960 or later.
Urbanicity has been an important dimension along which health outcomes have varied in the developing world and in China in particular [30, 50-54], so we hypothesize that the SES-overweight relation and its change over time might also vary by level of urbancity. If the relationship of interest did not vary by urbanicity, we consider it a confounder since it is likely associated with education attainment and BMI levels.
We use our own urbanicity scale, which we have assessed for validity and reliability, to indicate community-level urbanicity represented by infrastructure, sanitation, transportation, social services, occupations and wages, commercial markets and communications [51]. Each community receives a time-varying urbanicity value ranging potentially from 0-130 points, which is used in its continuous form in the analyses.
S
MOKINGV.
IS THE BURDEN OF OBESITY SHIFTING TO THE POOR ACROSS THE GLOBE? TIMETRENDS AMONG WOMEN IN 41 LOWER- AND MIDDLE INCOME COUNTRIES (1992-2007)
A.
ABSTRACT
Objective: Assess trends in the prevalence difference of overweight by socioeconomic status (SES) group and test if the overweight prevalence growth rate over time is higher for the lowest SES group compared to the highest SES group. Further, assess whether higher national wealth is associated with a higher growth rate in overweight prevalence for the lowest SES group compared to the highest SES group.
Methods: Repeated cross-sectional, nationally representative data from women aged 18-49 (n=556,352) in 41 low- and middle-income countries were used to determine the prevalence of overweight (body mass index ≥25) at each survey wave by wealth quintile and educational attainment (separately). The SES-specific prevalence difference and prevalence growth rate over time for each country were compared for the lowest and highest SES groups.
B.
BACKGROUND
Low socioeconomic status (SES) is associated with higher rates of chronic disease in high-income countries [3-6]. In low- and middle-high-income countries, chronic disease has only recently become a leading cause of morbidity and mortality [55], and less is known about the social patterning of emerging chronic diseases in these contexts. In the past, overweight and obesity were relatively uncommon in low- and middle-income countries and were positively associated with socioeconomic status [13]. However, the prevalence of overweight and obesity has increased dramatically in many low- and middle-income countries around the world over the last 5-15 years [56-58]. As the burden of nutrition-related disease has shifted toward overnutrition and away from undernutrition in low- and middle-income countries [14], it is unknown whether the burden of these emerging disease is becoming relatively heavier among lower SES groups.
Only under conditions of faster overweight prevalence growth rates for the low SES groups, could the relationship between high SES and obesity eventually become inverse in countries with previously positive relationships. Such a shift of the burden of obesity to low SES groups in countries progressing through epidemiologic transitions would be consistent with the fundamental cause theory of disease [8, 9]. This theory is often invoked to explain health disparities and highlights the overall persistance of the relationship between socioeconomic status and poor health over time [6, 7, 12, 59]. Fundamental cause theory asserts that despite changes in the types of predominant diseases, low SES groups consistently bear the largest burden of disease across time. Under this theory the mechanism by which high SES populations avert disease is by using the flexible resources that accompany higher SES (e.g. wealth, knowledge, power) to fend off disease while lower SES groups lack the resources to adjust to the changing burden of disease and ultimately experience higher rates of the predominant diseases [9].
determine whether overweight prevlanece is growing at a faster rate among the lowest SES groups, data from multiple time points are needed. Brazil is one of the few middle-income countries in which the changes over time in the SES-specific overweight prevalence have been reported. Analyses using repeated cross-sectional nationally-representative data between 1975 and 2003 show that, among women, the lowest income groups have experienced much more rapid gains in obesity prevalence compared to highest SES groups [16]. Another study using only the two most populous regions in Brazil between 1975 and 1997 found the obesity prevalence for the lowest income group has actually surpassed that the highest income group [17]. The pattern of change in SES-specific obesity rates seen in Brazil is consistent with a shifting burden of obesity to the poor and with the fundamental cause theory. However, it is unclear whether this pattern of more rapid growth in overweight prevalence among lower SES groups is unique to one country or if this is a common phenomenon experienced by many lower- and middle-income countries.
Additionally, recent studies in developing countries have focused only on obesity and have ignored the risk of overweight. Our study investigates overweight prevalence (body mass index (BMI)≥25) since metabolic risk factors, such as high blood pressure, cholesterol, and blood glucose occur below the BMI obesity cutpoint (BMI≥30) [39, 61-63]. Additionally, obesity is still fairly uncommon in many lower-income countries, and stratification by SES results in very small and sometimes zero prevalences.
Furthermore, although the results from the above mentioned cross-national study found an association between country-level GDP and the odds of having an inverse relationship between obesity and SES, it is uncertain what role country-level economic development plays in any shift in the burden of obesity from high SES to low SES groups, since previous research captures only a single point in time and lacks the ability to determine whether the burden of obesity is truly undergoing dynamic changes between social classes in association with economic development.
highest socioeconomic status group. Two indicators of socioeconomic status, wealth and education, will be tested separately to see if results are robust to the indicator for socioeconomic status. 3) Finally, we will test whether higher national wealth is associated with a higher growth rate in overweight prevalence for the lowest SES group compared to the highest SES group.
C.
METHODS
D
ATAS
OURCESData for these analyses come from several sources of publicly available datasets that include anthropometric data and at least two repeated measures over time. Each of the data sources uses a multistage cluster sample design and is either nationally representative or representative of a large portion of the country surveyed. The majority of the data are from Demographic and Health Surveys (DHS), nationally representative household surveys administered primarily in lower- and middle-income countries. The surveys entail repeated cross-sections, approximately every five years and collect information about key demographic characteristics, fertility, contraception, health and nutrition. The DHS questionnaires are standardized to a certain degree, to enable cross-country comparisons, while still being tailored for each country [64]. Additionally, we will use data from the Indonesian Family Life Surveys (IFLS), representative of 83% of the Indonesia, and the China Health and Nutrition Survey (CHNS) is conducted in 9 provinces in China, which contain approximately 56% of the Chinese population.
due to the fluctuation in weight associated with pregnancy. Appendix A displays the included countries and the years in which each was surveyed, sample sizes and selected sample characteristics.
K
EYV
ARIABLESAnthropometrics. In all surveys, height and weight were measured by trained technicians
using standard techniques [35, 36]. Body mass index (kg/m2) was used to classify people as obese or overweight according to WHO guidelines [37]. The prevalence of overweight or obesity (BMI≥25) according to socioeconomic status was calculated for each country at each survey wave.
Age. Age was collected for each individual in all surveys and controlled for by direct
standardization using the WHO standard world population [40] to allow greater comparability between countries and within countries over time.
Socioeconomic Indicators. Individual socioeconomic status was represented by wealth and
education, in separate analyses, in order to explore the robustness of the results to different indicators of SES.
Wealth. Wealth indicators were queried in all of the surveys. A wealth index has been created
for the countries that implement the DHS survey [41]. This index is comprised of assets that were asked in all surveys, as well as some country-specific variables. Principal components analysis was used to weight each of the components and generate a total wealth score for each family in each country in each survey wave [41]. The Indonesian Family Life Survey and the China Health and Nutrition Survey also collected information regarding household assets and these were entered into country-specific principal components analysis to create a wealth index comparable to the DHS index for each of these countries in each survey wave. For the analyses, the country and survey-year specific quintiles of wealth score were used to create a categorical variable for wealth.
Edcuation. All the surveys contain information about the participant’s highest level of educational
combined with the secondary category to avoid unstable estimates. Secondary education was then treated as the highest education group in these countries.
Economic Development. We use gross domestic product (GDP) per capita adjusted for
purchasing power parity (PPP) and inflated to the 2005 international dollar value (referred to henceforth as GDP for short) to represent country-level economic development. The PPP equalizes the purchasing power of different currencies in their home countries for a given basket of goods. This value was obtained for all years between the first and last survey wave for each country from the World Bank World Indicators Database [44]. The average GDP for the included years for each country is used in the regression analyses in its continuous form. This is divided by 1000 so the interpretation is an increase in $1000 per capita GDP.
S
TATISTICALA
NALYSESWe use absolute differences in prevalence by SES group, absolute change in prevalence over time within each SES group, and absolute difference in prevalence growth rates between SES groups. We chose absolute measures rather than relative because each one-point increase in the percent of the population with overweight is meaningful and interpretable. Additionally, there were a number of countries with a very low prevalence in the lowest SES group and a fairly high prevalence in the highest SES group; this combination means that fairly small absolute increases the low prevalence groups equate to large relative increases that could not be matched in the high
prevalence groups except by tremendous absolute increases. Take, for example, Chad: the lowest education group has a prevalence of ~4% in 1996 and ~7.5% in 2004, for an absolute change of 3.5 points and a relative change of 87%. The highest education group has a prevalence of ~35% in 1996 and to experience a similar relative change of 87%, they would have to increase absolute prevalence by 30 points by 2006. We therefore felt that the more reasonable and meaningful comparisons would be in the difference in the absolute increase in prevalence in each group.
For sensitivity analyses, we re-ran the analyses on the full sample, including all women with measured weight and height in any survey year to assess whether the difference in prevalence growth rate results would change substantially if we included the full sample instead of conservatively restricting the sample to only mothers of young children to retain sample comparability through time. Additionally, the threshold at which some Asian populations experience increased metabolic risk factors appears to be lower than the BMI 25 cutpoint [38]. For the Asian countries in our sample, we perform the main analyses using BMI ≥25 and then we perform a sensitivity analysis using the suggested BMI ≥23 as a cut-off point for overweight [38].
Alpha was set at 0.05 for all analyses and all tests were 2-sided. All analyses were performed
with Stata (Version 11, 2009, Stata Corporation, College Station, TX)
D.
RESULTS
S
AMPLEC
HARACTERISTICSAnalyses included data from 556,352 women with complete data on covariates in 41
countries each with an average of 2.7 surveys per country between 1991 and 2008. There were eight country-years from four countries in which the DHS wealth index was not available. This resulted in eight fewer estimates of prevalence difference by wealth compared to education and four fewer estimates of difference in prevalence growth rates within countries.
W
EALTH RESULTSTable
1
provides the age-standardized overweight prevalence differences between thelowest and highest wealth group for each country-year (N=103) and the annualized difference in prevalence growth rates between highest and lowest wealth group in each country (n=37).
Overweight/obese prevalence difference by wealth. In 92% of the country-years (N=95), the
highest wealth group had the highest prevalence of overweight. In the remaining 8% (n=8), the age-standardized prevalence in the lowest wealth quintile was greater than the prevalence in the highest wealth quintile.
Overweight/obese difference in prevalence growth rate by wealth. The overweight prevalence
growth rate was greater for the lowest wealth quintile in 27% of the countries (N=10). In the remaining 73% (N=27) of the countries, the prevalence growth rate was greater in the highest wealth quintile.
Table 2 displays the age-standardized overweight prevalence differences between the lowest and highest education group for each country-year (N=111) and the annualized difference in
prevalence growth rates between highest and lowest education group in each country (n=41).
Overweight/obese prevalence difference by education. In 90% of the country-years (n=100),
the highest education group had a higher overweight prevalence than the lowest education group. In the remaining 10% (n=11), the lowest group had a higher prevalence of overweight compared to the highest education group.
Overweight/obese difference in prevalence growth rate by education (Table 2). In 49% of the
countries (n=20), the overweight prevalence growth rate was higher in the lowest education group compared to the highest education group. In the remaining 21 countries, the prevalence growth rate was higher in the highest education group compared to the lowest education group.
C
OMPARING WEALTH AND EDUCATION RESULTSThe general conclusions of the country-year prevalence differences by wealth and education are similar, with approximately 90% of the country-years in both analyses showing greater overweight prevalence among the highest SES group.
In both the wealth and education analyses, even though the prevalence difference in overweight still favors the low SES groups in most country-years, when we look at the difference in prevalence growth rates, we see more countries displaying a pattern of faster growth rates among the lowest wealth and education groups (27% and 49%, respectively). Nearly all of the countries that had higher prevalence growth rates among the lowest wealth group also had higher growth rates in the lowest education group, so the difference in numbers come mainly from an additional set of countries in which lowest education group’s growth rate surpassed that of the highest education group.
S
ENSITIVITYA
NALYSESImpact of sample restrictions. Our primary analysis was restricted to women that had children
surveys obtain anthropometrics on all surveyed women. In an additional sensitivity analysis we included all measured women in the recent years and determined the difference in prevalence growth rates by wealth and education on this broader sample. The results from examination of differences in prevalence gains by SES from the full sample are largely similar in direction and significance to those from the restricted sample, particularly for the analyses that use wealth as a proxy for SES (results not shown).
Asian BMI cutpoint. Using the Asian-specific BMI cutpoints [38] for overweight (BMI≥23) for
the countries with a primarily Asian population (China, India, Bangladesh, Nepal, Cambodia)
produced largely consistent in direction with the results using a cut-off point of BMI≥25 (
Table 1
).C
OUNTRY-
LEVEL ECONOMIC DEVELOPMENTThe country-level difference in the annualized prevalence growth for the lowest wealth group compared to the highest is plotted against country level GDP in Figure 1 and the analogous relation
for education groups is plotted in
Figure 1
Country-level GDP was positively associated with fasterannualized prevalence growth of overweight for the lowest wealth quintile compared to the highest quintile (β= 0.24; 95% CI -0.015,0.46; regression line shown in Figure 1), but not for the lowest versus the highest education groups (β= -0.03; 95% CI -0.25, 0.19; regression line shown in Figure 2).
E.
DISCUSSION
the relationship between socioeconomic status and overweight over time. In the majority of country-years the highest wealth and education groups still have the highest age-standardized prevalence of overweight and obesity. However, consistent with a shifting of disease burden to the lower SES groups within countries, a trend toward faster overweight prevalence growth rates for the lowest SES groups compared to the highest SES groups is apparent in approximately 50% of the countries studied (N=21 out of 41).
Our finding of a positive relationship between SES and overweight is opposite of what is seen in many studies of higher-income countries [66-69], but is consistent with the historical review by Sobal and Stunkard [13], which found a positive SES-overweight relationship in 91% of lower -and middle- income countries. In contrast, Monteiro et al. [1] find a positive relationship between SES and overweight in only76% of the survey waves. Differences between our findings and the findings of Monteiro et al. could be due to real changes over time, different outcomes (BMI≥25 vs. BMI≥30) or the different classification of low and high education groups (milestone groups vs. tertiles). Our study improves upon the previous work by Monteiro by examining the changes over time within and across a large sample of low- and middle-income countries.
Despite the overwhelmingly positive association between SES and overweight, we also find that a shift in the burden of disease is occurring, evidenced by faster prevalence growth rates among the lowest wealth or education group compared to the highest in half of our sample countries. Only a few other studies examine the time trends in overweight or obesity in low- or middle- income
countries. As mentioned previously, Brazil also displays faster rate of growth in overweight