2019 SEAOC CONVENTION PROCEEDINGS
Feasibility of a Fiber Reinforced Polymer Retrofit for
Non-Ductile Concrete Walls
Rory de Sevilla, EIT, Graduate Student
Dept. of Architectural Engineering
California Polytechnic State University, San Luis Obispo, CA
Jerry Luong, EIT, Graduate Student
Dept. of Architectural Engineering
California Polytechnic State University, San Luis Obispo, CA
Anahid Behrouzi, Ph.D., Assistant Professor
Dept. of Architectural Engineering
California Polytechnic State University, San Luis Obispo, CA
Peter Laursen, Ph.D., Professor
Dept. of Architectural Engineering
California Polytechnic State University, San Luis Obispo, CA
Mike Deigert, SE, Assistant Professor
Dept. of Architectural Engineering
California Polytechnic State University, San Luis Obispo, CA
Abstract
A significant number of pre-1980’s non-ductile reinforced concrete (RC) structures in California have been identified as deficient, many of which utilize RC shear wall systems to resist earthquake lateral forces. These non-ductile wall systems are typically lightly reinforced and lack adequate boundary element detailing. Engineers suspect these walls to susceptible to brittle, compression-controlled failure modes due to damage from concrete crushing and bar buckling. As a result, one approach designers are taking is to seek fiber reinforced polymer (FRP) retrofit solutions that improve the compression capacity of high-stressed wall end zone regions based on effectiveness of these approaches with columns.
This paper presents the initial results from a lightly reinforced RC shear wall test without boundary elements intended to be representative of a vintage wall. The experimental test showed that the expected compression-type damage mechanisms were not the primary contributors of wall failure. Rather the failure was attributed to the development of few, large crack planes
near the base of the wall and the fracture of most longitudinal bars at the wall-foundation interface. Additionally, the drift capacity was greater than anticipated. Therefore, the original proposed fiber reinforced polymer (FRP) retrofit developed by the authors in collaboration with industry input – wrapping the wall end zones with FRP sheets and thru-wall splay anchors to improve the compression capacity of these regions – may not be a viable approach. The research findings suggest that additional investigations into FRP solutions are necessary for different classes of non-ductile walls and their respective failure types.
Introduction
shear walls are characterized by little to no confinement in the highly stressed compression zones at the ends of walls, and many engineers are concerned that a sudden catastrophic flexural-compression wall failure due to rebar buckling or concrete crushing would pose a threat to overall building safety.
This concern is significant enough that seismic retrofit mandates, California Senate Bill 1953 and Los Angeles Ordinance 183893, have been passed to require the retrofit, replacement, or demolition of non-compliant structures within the next decade or be taken out of service. Thus, many structural engineering firms are faced with retrofit projects to improve the ductility of older RC shear walls. Conventional solutions include thickening existing walls or adding walls in a floorplan; costly and time-intensive approaches since connected floor diaphragms / foundation elements often must also be strengthened.
A few firms are pursuing more rapid and cost-efficient innovative fiber reinforced polymer (FRP) retrofit strategies in order to increase the compressive strain capacity of the wall end zone and improve overall wall ductility, performance improvements that have been observed in extensive testing of FRP jacketing of RC columns (Sheikh & Yau, 2002; Iacobucci et. al., 2003, Endeshaw et. al., 2008; Realfonzo & Napoli, 2009). Yet the current lack of experimental tests to characterize the response of FRP-retrofitted walls means that current structural analyses for walls are based on FRP-retrofitted column tests despite distinct behaviors between columns and walls. One proposed solution that practitioners are considering for this anticipated failure mechanism is to provide supplementary confinement via externally bonded FRP sheets with thru-wall splay anchors in the wall end zones.
Objective
The primary objective of the experimental wall test described in this paper is to better understand the failure mechanism of a pre-1980s lightly reinforced non-ductile concrete wall and investigate the effectiveness of a retrofit approach that would involve wrapping the wall end zones (location of boundary elements in modern wall designs) with FRP sheets and splay anchors. Assuming a flexural-compression failure with significant compressive damage to the wall end zones, this strategy would be expected to provide improved confinement to concrete and buckling restraint to reinforcement. The result would be an increase wall displacement capacity without considerable increases in wall lateral strength that would necessitate upgrades to connected structural elements. This paper summarizes the result of this wall test and provides commentary on whether the proposed retrofit scheme would be appropriate for walls with similar design and response.
Performance of Lightly Reinforced Walls
There have been a limited number of experimental tests that examine the response of slender planar RC walls that are lightly reinforced (approaching the ACI 318 code minimum longitudinal reinforcement ratio of ρl = 0.25%) and do not
contain boundary elements. There was notable poor performance of these types of walls in both the 1985 Chile and the 2010/2011 New Zealand earthquakes. Rather than the typical distributed cracking observed in the plastic hinge region of wall tests designed to modern ductile detailing provisions, the observed response of these walls is often few, significant crack planes with concentrated damage and multiple bar fractures (Wood et. al., 1987; Kam et. al., 2011).
Prior experimental testing of slender planar RC walls with modest axial loads, low longitudinal reinforcement ratios (with rebar arranged in two layers), and no boundary elements tend to exhibit similar damage patterns as that observed in the field. Specifically:
• Cardenas & Magura (1973) – Specimen SW-1 with ρl = 0.27%. Failure initiated by bar fracture at the base of
the wall where the single crack plane was located.
• Ireland et. al. (2007) – Specimen W1 with ρl = 0.47%.
Damage included spalling and bar buckling, but ultimate strength loss at around 3.0% drift was due to bar fracture at a single crack plane at the wall-foundation interface.
• Lu et. al. (2017) – Specimens C1-C3 with ρl = 0.53%.
Limited spread of plasticity with 1-3 primary cracks of around 20 mm width at or near wall base. In all walls, bar buckling and concrete crushing preceded multiple bar fractures leading to strength loss near 2.5% drift. Lu et. al. (2017) cautions that full-scale walls in a building will likely have lower drift capacity than seen in lab testing due to more limited steel ductility and relative size of maximum crack width at bar fracture.
Wall Test Program
2019 SEAOC CONVENTION PROCEEDINGS
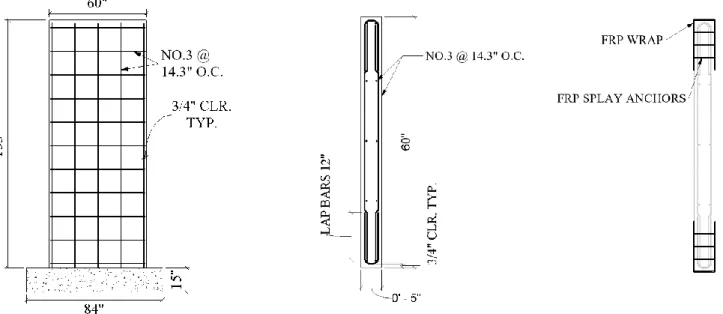
Figure 1. Wall specimen dimensions and rebar layout: (left) wall elevation, (center) original wall cross-section, (right) proposed retrofit wall cross-section
Wall Specimen Properties
The wall is 5-in. thick, 60-in. long, and 153-in. tall and was designed to be relatively thin with a cross-sectional aspect ratio of 12 and have as large a shear span ratio ≥ 2.0 as permitted by laboratory constraints to achieve a flexurally-dominated response. Longitudinal and horizontal reinforcement consisted of #3 deformed rebar at 14.3-in. spacing to achieve ratios of ρl = ρh = 0.37%; slightly above the ACI 318 minimum
requirement. The longitudinal rebar is embedded in the 15-in. deep foundation and horizontal bars are lap-spliced approximately 12-in. in the wall end zones with open u-bars, which is not considered to provide confinement of these regions. The average concrete compressive strength at the time of testing was 3.8 ksi and the average steel yield and ultimate strengths were 54 and 82 ksi, respectively. The concrete mix and steel reinforcement were intentionally selected to represent the material properties of vintage concrete walls.
Experimental Test Setup
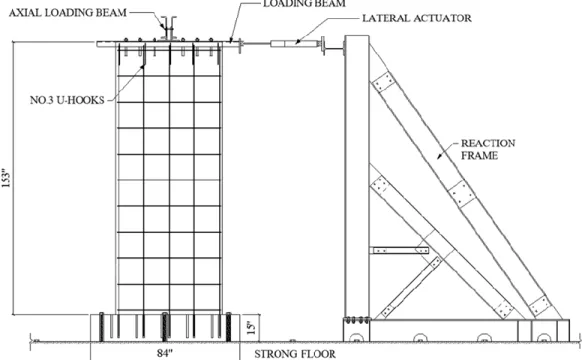
The experimental test was conducted in the Cal Poly College of Architecture & Environmental Design (CAED) High Bay Laboratory. This wall test program represented a considerable upgrade to the laboratory with respect to strengthening the existing steel reaction frame as well as design and fabrication of an out-of-plane stability frame and axial load application system. A detailed drawing of the laboratory test setup is shown in Figure 2; the out-of-plane stability frame is excluded for clarity.
The wall foundation was secured to the strong floor to achieve a fixed-base condition. A horizontal hand-pump actuator mounted to the steel reaction frame applied lateral forces to the centroid of a loading beam (steel channel section) that was connected to the wall via anchor bolts and grouted shear keys. There were additional #3 open hoops at this location to provide confinement for lateral and axial loading at the top of the wall. The axial load was applied using a “teeter” beam placed atop the loading beam. The “teeter” beam was loaded on each end by pre-stressed rods and a vertical actuator to transfer an axially applied reaction force to the wall that totaled approximately 0.035Agfc’. To maintain out-of-plane stability
of the test specimen, a two-story Simpson Strong-Tie Ordinary Moment Frame was assembled with two steel HSS tubes placed parallel to the wall on each side. Teflon pads were placed between the steel HSS tubes and the wall to reduce friction in the system during loading.
Loading Protocol
2019 SEAOC CONVENTION PROCEEDINGS
Figure 2. Experimental test setup
during load steps 22-23, a pushover was attempted. Having still not achieved significant loss of load carrying capacity, additional cycles were attempted to examine the collapse prevention limit state. The test was terminated when the wall when strength decreased by about 30% and the wall proceeded to exhibit significant base rotation at the wall-foundation interface (rocking) with no additional changes in behavior.
Figure 3. Loading protocol
Instrumentation
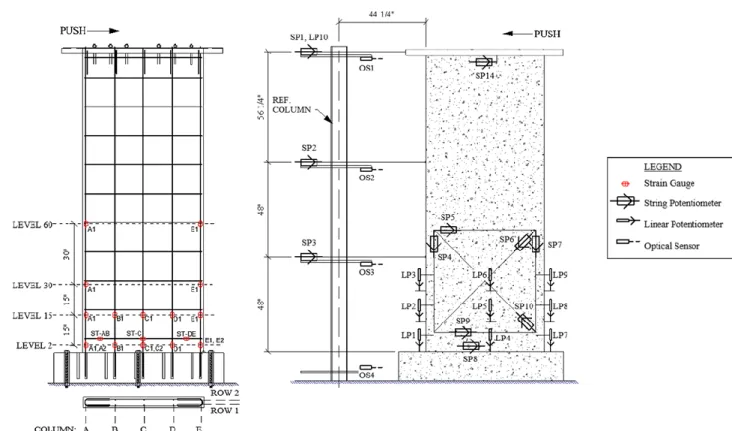
The instrumentation for the test involved strain gauges, string/linear potentiometers, and optical sensors in addition to load cells aligned with both horizontal and axial actuators. The
steel strain gauge configuration is shown in Figure 4 and consists of eighteen strain gauges attached to longitudinal rebar and two attached to horizontal rebar. The primary objective was to measure steel reinforcement strain in the expected plastic hinge region of the wall, and specifically in the wall end zones, which could serve as a point of comparison in future tests that had been retrofitted with FRP. The various displacement transducers, also shown in Figure 4, were used to measure wall behavior: lateral displacement, flexural and shear deformations, and base slip/rotation with some intentional redundancy. Instruments were also used to measure test set-up behavior, such as: slip between the strong floor and wall footing, strong floor and reaction frame, as well as loading beam and top of wall. Note that sensors shown on the reference column are physically isolated from the test specimen.
Experimental Results
2019 SEAOC CONVENTION PROCEEDINGS
Figure 4. Instrumentation layout: (left) strain gauge layout, (right) displacement transducer layout.
Note: Front and back of wall as indicated by push direction.
during a monotonic push. The wall sustained a maximum moment of 1.20𝑀𝑛 and shear of 0.24𝑉𝑛, where nominal
strengths were calculated in accordance with ACI 318-14.
Figure 5. Wall load-deformation response
The damage progression of the wall was as follows; note that the south edge of the wall is closest to the steel reaction frame:
• First yield of rebar occurred at +0.075% drift and 12.59 kips of lateral load. A 7-in. crack developed at the base of
the wall extending horizontally from the south edge towards the center of the wall.
• Global yielding of the wall occurred at +0.2% drift. A horizontal crack developed 33-in. above the wall base.
• First diagonal crack occurred during the +/- 0.6% drift cycles at 16-in. above the base, extending between an existing horizontal crack to the base of the wall.
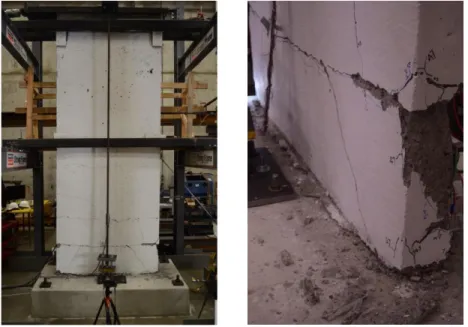
• During the cycles at +/-1.67%, vertical splitting cracks began to appear on the south face of the wall surrounding a significant horizontal crack and exposed transverse rebar. The onset of spalling was observed.
2019 SEAOC CONVENTION PROCEEDINGS
Figure 6. Final damage state of wall: (left) overall, (right) north wall end zone
Wall Performance Predictions
Two methods, Priestly (2017) and ASCE 41-17, were used to obtain a pushover curve to approximate strength and drift capacity of the wall at various limit states. In Figure 7, these results are compared to the experimental backbone curve for only the portion of the test prior to the monotonic pushover. As indicated previously, the true ultimate drift is likely somewhere between 2 to 3% drift. For the Priestley method a moment-curvature analysis was performed in XTRACT (Chadwell & Imbsen, 2004) sectional analysis software using expected material properties and appropriately calibrated material backbone models. The stress-strain relationship for unconfined concrete was based on Mander (1984) while that for steel reinforcement was based on three rebar tensile tests. For the ASCE 41-17 method, Section 10.3.2 and specifically Table 10-19, were utilized to estimate a generalized force-displacement relation for the wall. The ASCE 41-17 approach appears to capture the initial stiffness more accurately but suggests that the wall would have very limited deformation ductility with a failure slightly above 0.3% drift. The Priestly approach has a slightly lower initial stiffness but predicts a higher drift capacity that is relatively closer to the experimental performance of the wall.
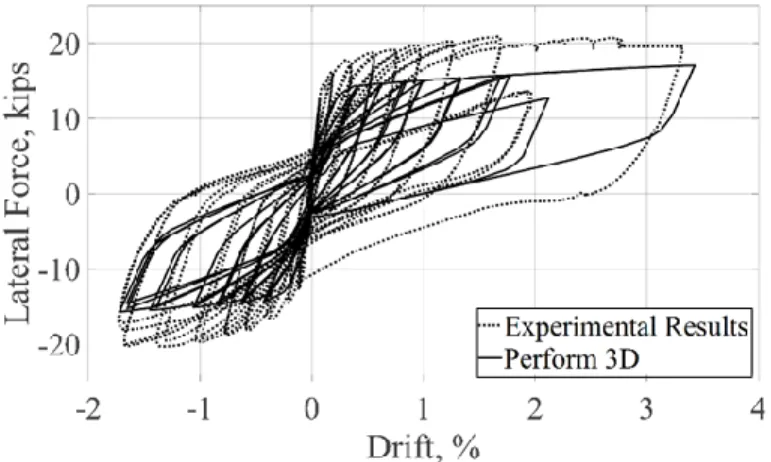
Pushover analyses are a simplified method for estimating global performance of structures, but do not accurately capture the effects of cyclic degradation on stiffness. Nor was it possible to appropriately account for the impact of the monotonic push and subsequent asymmetric cycles. In an effort to predict the response to include cyclic degradation and the latter portion of the loading protocol that deviated from
symmetric two-cycle sets, the wall was analyzed using Perform-3D (CSI, 2011). Figure 8 presents the predicted hysteretic response of the wall from a preliminary Perform-3D analysis as compared to the experimental results. Currently the model is underpredicting strength and exhibits a more pronounced pinching behavior than the experiment, though the stiffnesses appear to be reasonably consistent for the beginning portion of each drift cycle. The authors plan to undertake additional calibration efforts to better model the response of the baseline lightly reinforced wall specimen.
Figure 8.PERFORM-3D predictions vs. test results
Viability of Proposed Retrofit using FRP Sheets & Anchors
The objective of conducting the previously described baseline wall test was to have a greater understanding of how the non-ductile concrete walls that require retrofit, per the current CA Senate Bill 1953 and LA Ordinance 183893, actually behave. With the poor detailing standards (lightly reinforced with widely spaced open stirrups), many engineers would anticipate very low deformation ductility or drift capacity, and that the wall failure would be dominated by concrete crushing or bar buckling in the wall end zones. What was observed during this test is consistent with other lightly reinforced wall tests conducted at other institutions, that there are few large crack planes rather than distributed cracking across the plastic hinge region. Another similarity with other tests were that the number of the longitudinal bars fractured at the crack located at the wall-foundation interface, precipitating significant strength loss to constitute failure (Cardenas & Magura, 1973; Ireland et. al., 2007; Lu et. al., 2017). In short, a flexural-compression failure that was anticipated did not occur. The modest level of concrete crushing and essentially negligible bar buckling would not result in a scenario where the proposed retrofit of confining the wall end zone regions with FRP sheets and thru-splay anchors is likely to prove useful.
There is evidence related to the proposed FRP wall retrofit using externally bonded FRP sheets with thru-splay anchors in the wall end zone as effective in increasing wall ductility with limited impact to flexural and shear strength. The existing experimental studies that were most closely related to the proposed retrofit included:
• Paterson & Mitchell (2003) – Specimens RW1-2 with ρl = 0.74% were retrofitted across the full wall length, lw,
with FRP sheets and thru-wall headed reinforcement to strengthen deficient lap splices and move the plastic hinge region. In both cases, walls exhibited significantly
increased ductility and energy dissipation accompanied by ≥ 10% increase in strength.
• Khalil & Ghobarah (2005) – Specimens RW1-2 with average ρl = 4.58% were retrofitted with a shear
strengthening using FRP sheets bonded to the web region as well as a ductility improvement with FRP sheets wrapped around the wall end zones and secured with FRP anchors (RW1) and with additional steel anchors (RW2). Walls experienced improved ductility and energy dissipation, yet with ≥ 50% increase in strength.
Both test programs indicate the promise of a wall retrofit approach that combines FRP sheets and anchors to improve the global wall ductility. However, they do not fully capture the response of a lightly reinforced concrete wall type, in addition to both exhibiting an undesirable increase in wall strength that would likely necessitate strengthening of connected diaphragms and foundations in an actual building. Further retrofit iterations of the proposed retrofit design and testing at Cal Poly, drawing on the finding of the baseline lightly reinforced wall test, hopes to address these gaps in the currently available experimental data.
Future Work
Future work with respect to the current baseline wall described in this paper would include continued refinement of predictions of wall response using PERFORM-3D to capture unique performance attributes of lightly reinforced walls. Additionally, there are plans for further discussion with design engineers and FRP manufacturers of retrofit schemes that would better suit the observed failure mode and to begin design/testing of such an approach. With respect to the design of an alternate baseline wall, it seems as if there is still considerable industry interest in a lightly reinforced non-ductile wall that exhibit low displacement ductility and a compression-controlled failure to be retrofitted using the initially proposed FRP solution. For this reason, work will be undertaken to design an alternate baseline wall that would capture a compression-controlled failure response. The overarching goal of the on-going wall test program is to collaborate with industry to help identify appropriate FRP retrofit schemes for various types of non-ductile walls that are cost-effective, minimally invasive, and constructible.
Acknowledgements
like to specifically acknowledge the considerable contributions of industry advisors Garrett Hagen of Degenkolb and Scott Arnold of Fyfe, the technical assistance of Cal Poly CAED lab staff, and the numerous students that assisted with fabrication and testing efforts.
References
ACI 318-14, Building Code Requirements for Structural Concrete, American Concrete Institute, 2014.
ASCE 41-17, Seismic Evaluation and Retrofit of Existing Buildings, American Society of Civil Engineers, 2017.
Cardenas, A.E., and D.D. Magura. “Strength of High-Rise Shear Walls – Rectangular Cross Section,” Portland Cement Association, 1973.
Comartin, C., et. al., “The Concrete Coalition and the California Inventory Project: An Estimate of the Number of Pre-1980 Concrete Buildings in the State,” Concrete Coalition, September 2011.
Computers and Structures, Inc. (CSI), “User Guide PERFORM-3DTM: Nonlinear Analysis and Performance
Assessment for 3D Structures, CSI, v. 5, June 2011.
Endeshaw, M., et. al., “Retrofit of Rectangular Bridge Columns Using CFRP Wrapping,” Washington State University, 2008.
Iacobucci, R., et. al., “Retrofit of Square Concrete Columns with Carbon Fiber-Reinforced Polymer for Seismic Resistance,” ACI Structural Journal, vol. 100, no. 6, 2003.
Ireland, M.G., et. al., “Experimental Investigations of a Selective Weakening Approach for the Seismic Retrofit of R.C. Walls,” Proceedings of 2007 NZSEE Conference, January 2007.
Kam, W., et. al., “Seismic Performance of Reinforced Concrete Buildings in the 22 February Christchurch
(Lyttelton) Earthquake,” Bulletin of the NZSEE, vol. 44, no. 4, December 2011.
Khalil, A., and A. Ghobarah, “Behaviour Of Rehabilitated Structural Walls,” Journal of Earthquake Engineering, vol. 9, no. 3, 2005.
Lu, Yiqiu, et. al., “Cyclic Testing of Reinforced Concrete Walls with Distributed Minimum Vertical Reinforcement,”
Journal of Structural Engineering, vol. 143, no. 5, 2017.
Mander, J.B., et. al., “Theoretical Stress-Strain Model for Confined Concrete.” Journal of Structural Engineering, 1984.
Paterson, J., and D. Mitchell, “Seismic Retrofit of Shear Walls with Headed Bars and Carbon Fiber Wrap,” Journal of Structural Engineering, vol. 129, no. 5, 2003.
Priestley, M. J. N., et. al., “Displacement-Based Seismic Design of Structures,” EUCENTRE, 2017.
Realfonzo, R., and A. Napoli. “Cyclic Behavior of RC Columns Strengthened by FRP and Steel Devices,” Journal of Structural Engineering, vol. 135, no. 10, 2009.
Sheikh, S., and G. Yau, “Seismic Behavior of Concrete Columns Confined with Steel and Fiber-Reinforced Polymers,” ACI Structural Journal, vol. 99, no. 1, 2002.
Chadwell, C.B., and R.A. Imbsen, “XTRACT: A Tool for Axial Force-Ultimate Curvature Interactions,” Proceedings for 2004 ASCE-SEI Structures Congress, 2004.