UDC 656.212.5:[004.434:004.94]
O. V. GORBOVA
1*1*Research Department, Dnipropetrovsk National University of Railway Transport named after Academician V. Lazaryan, Lazaryan St., 2, Dnipropetrovsk, Ukraine, 49010, tel. +38 (056) 776 90 59, e-mail [email protected], ORCID -0000-0002-5612-2715
MODELING WORK OF SORTING STATION USING UML
Purpose. The purpose of this paper is the construction of methods and models for the graphical representation process of sorting station, using the unified modeling language (UML). Methodology. Methods of graph theory, finite automata and the representation theory of queuing systems were used as the methods of investigation. A graphical representation of the process was implemented with using the Unified Modeling Language UML. The sorting station process representation is implemented as a state diagram and actions through a set of IBM Rational Rose. Graphs can show parallel operation of sorting station, the parallel existence and influence of objects process and the transition from one state to another. The IBM Rational Rose complex allows developing a diagram of work sequence of varying degrees of detailing. Findings. The study has developed a graphical representation method of the process of sorting station of different kind of complexity. All graphical representations are made using the UML. They are represented as a directed graph with the states. It is clear enough in the study of the subject area. Applying the methodology of the representation process, it allows becoming friendly with the work of any automation object very fast, and exploring the process during algorithms construction of sorting stations and other railway facilities. This model is implemented with using the Unified Modeling Language (UML) using a combination of IBM Ra-tional Rose. Originality. The representation process of sorting station was developed by means of the Unified Mod-eling Language (UML) use. Methodology of representation process allows creating the directed graphs based on the order of execution of the works chain, objects and performers of these works. The UML allows visualizing, specify-ing, constructing and documentspecify-ing, formalizing the representation process of sorting station and developing se-quence diagrams of works of varying degrees of detail. Practical value. The usage of the Unified Modeling Lan-guage (UML) based on software package IBM Rational Rose and allows to create processes of varying degrees of detail, reduce the time expenditure for the process research of sorting station and get a clear graphical representa-tion, as well as to reduce the human costs at the construction and improvement of existing technologicalprocesses.
Keywords: directed graph; sorting station; technologicalprocess; schedule of the station; parallel processes, UML
Introduction
Modern information technologies are one of the priority directions of the development and im-provement of transportation process management, operation of infrastructure, and other processes on railway transport.
The main goal of informatization of railway transport is to provide all technological processes and activities of railway transport with the infor-mation and creation the inforinfor-mation base for maximum efficiency of industry. The main ele-ment of information systems of operational control in the train stations operation and the assessment of their technical and technological characteristics is the mathematical model of the technological proc-ess. Methods that represent these mathematical models should provide a high level of detail that creates possibility of automatic information proc-essing and decision making on the one hand, and to
be simple and intelligible for engineers who exe-cute their development and modification on the other hand. In this regard, the formalization of technological processes of railway transport is an important task for the railway transport.
The railway stations are channel, multi-phase, stochastic, dynamic, and ergatic queuing systems. Technical equipment and technology of their work are described with the technical and administrative act, technological process and vari-ous instructions and regulations. The total volume of these documents at major stations can be up to several thousand pages. Therefore, the formal rep-resentation of technological processes in the avail-able form for their automatic and automated analy-sis is complicated enough.
modeling. During the visual modeling each ele-ment of the production process is represented in the form of graphic symbols.
Graphical models have been already used for the formal image of technological processes of railway stations functioning since the initial stages of railway transport operation.
One of the first methods of formal representation of the technological processes used up to the present time is the linear Gantt chart [11], reflecting the du-ration of technological opedu-rations with the object, their relationship between themselves and the ex-ecutors that take part in the operation. The line charts are the primary method of technological processes image with a separate objects in the de-velopment of technological documents [14]. The network graphs are widely used as models of tech-nological processes of maintenance facilities at sta-tions [14]. They allow applying the newly devel-oped mathematical tools to determine the total dura-tion of processing objects. The general shortcom-ings of linear Gantt charts and network diagrams are that they include a hard list of works and their exe-cution order. In fact, the trains’ technology service at the stations can differ and vary in operational conditions. Thus during the processing of transit trains there are various technology options depend-ing on the need to change locomotives, cars avail-ability, requiring cuts repair, health devices of rail-way automatics during the reception and departure and other. Considering that each particular combina-tion of local condicombina-tions requires a different display in the form of a linear chart or network, such a de-scription becomes quite cumbersome.
For fixation and subsequent analysis of work stations, as well as to establish their technical and operational indicators graphical model in the form of a daily schedule is used [6, 13, 12]. The separate operations are represented as an icon on the time grid in it. The daily schedule has high informative-ness and it is a convenient tool for analysis of the technological process by the man, but it is actually a separate replica of the station work and it is im-possible to set the rules of its functioning.
State machines [4] and Petri nets [13]. Give formal representation of the work stations technol-ogy with the possibility of considering various op-tions for its execution. These models represent the processes in the form of discrete transitions from one state to another. However, these models are exclusively determined the procedure, and rules
execution of certain operations, the directions choice of transition necessitates the additional complexity of the model and development of spe-cialized software [12].
Undoubtedly the technology of rail stations can be presented as an algorithm [15], but due to the complexity of the stations work these algorithms are very inconvenient and cumbersome to analyze.
Since the early 90-ies visual programming lan-guages began to develop rapidly, providing the writing computer programs by manipulation of graphical objects instead of writing their text, and visual development tools that support them.
Today one of the most widely-distributed visual programming languages, which are used for formal description of business processes, is the unified modeling language (UML) [12]. The modeling language UML is an open standard that uses graphic symbols to create an abstract model of the system, the so-called UML models. UML was cre-ated for definition, visualization, design and docu-mentation of software systems mainly. UML is used for software modeling, business processes, system design and display of organizational struc-tures. IBM Company has developed the Rational Rose environment as visual development tools products in UML. It is a powerful tool for analysis and design of object-oriented software systems. The Rational Rose environment allows you to build a model of the technological process of the sorting station quickly and easily. It provides both an automatic data processing of computers and hand modeling. This environment contains all the components of the UML.
In this regard, the use of UML to formalize technological processes of train stations potentially creates conditions for improving the efficiency of the process and reduces the costs for developing the visual design tools.
Purpose
The aim of the article is to develop methods and models of graphical representation of techno-logical processes of railway stations by means of the visual UML.
Methodology
– the objects requiring action of the contractor (executor);
– the set of operations;
– the persons who perform the work.
Locomotives and trains are objects for the sort-ing stations. Every object on the station runs a cer-tain number of jobs (operations), foreseeable by the process and the implementation of technologi-cal operations at the station provides the executors (shunting locomotives, sorting stations and other). Every technological operation should be made by the executors of a certain specialization (for exam-ple, inspection of cars carries out by a team of ser-vice point, train sorting – shunting locomotive and sorting station and other). At the same time the executor of a separate specialization can perform several different operations (for example, signal operator performs the fixing of rolling stock and cleaning brake shoes) [14, 16].
Two diagrams of states and actions can be used for the modeling the process of sorting station at the logical level in the UML system of IBM Ra-tional Rose [10].
The state diagram describes the process of state changing (fulfilled work of technological process) only of one object. At this the changing of an ob-ject state (rolling stock, trains) can be caused by both internal processes and external agents. The main purpose of this diagram at formalization of the processes of train stations to describe all possi-ble sequences and actions that collectively charac-terize an object’s behavior during its dwell time on the station. The state diagram is essentially a graph of a special type, which represents a specific ma-chine. The top of this graph are the works that are carried out at the railway station and some other types of machine elements that are shown with the corresponding graphical symbols for the environ-ment. Arcs of the graph are used to indicate the transitions from state to state that characterizes the end of the execution of the work and the transition of corresponding signal to the following diagram performers. The state diagrams can be nested into each other [2].
The action diagram in UML has more features during the displaying of technological processes of railway stations. Diagram also is a graph that represents a specific machine, but it has differ-ences, that includes:
– on the actions diagram it can be distinguished both states and actions, and actions, in turn, can be
represented in the form of a new diagram of state or actions, receiving the nesting of diagrams;
– action diagram has a set of tools for presenta-tion of operator’s «choice»;
– on the actions diagram the parallelism of the processes can be shown;
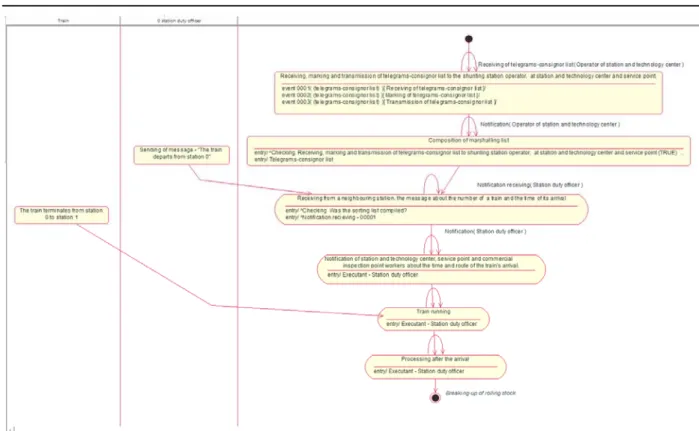
– on the action diagram is the ability to repre-sent the synchronization of processes (operations). Let’s present a graph of technological opera-tions of processing trains delivered in to process-ing, in the presence of telegrams-consignor list (Fig. 1). Using the environment Ratinal Rose a graphical sequence of relevant works was con-structed. They are executed during the train sort-ing, that had arrived at the sorting station. (Fig. 2).
For an actions diagram (Fig. 2) during its de-veloping such designators were used:
− the initial diagram state, waiting for the signal to work. The diagram state that does not contain any internal action;
− the idle state of the transition signal to work;
− a simple transition is a relationship between two sequential operations, that indicates on the change of one another;
− the transition state;
− the final state of the diagram, waiting for the end of the work execution;
− the state of choice between two or more works.
For the transition in diagram, it is possible to fix the terms of transition and executants (group of executants), who carries out the work. With this purpose it is proposed a transitions signature in the following form [2]: «The condition for the transition (completed work)» («list of executors of the following works»)/ «Action for transition».
For the works of transition execution there is a list of fixed labels [1]
– entry – label that indicates on the operation or the incoming document required for the work execution that is performed at the time of entry;
– exit – label, pointing to the work, that is performed at the time of exit;
– event – label – «event» that indicates a single action and can be performed during the stay of the system in appropriate state.
Such «events» must be ordered in time action diagram is characterized by the reflection of the parallel actions of the objects involved in the process. For the process in parallel, there is a station duty officer, who receives and sends messages; there is a train going to the railway station and the railway station waiting for the arrival of the train for the
dissolution. A graphical representation is quite intel-ligible to understand the process, execution of works and objects at the railway station. On the action dia-gram it is also shown the status of the process and action separately.As in the state diagram, each state or activity can build its process separately. For the diagram (Fig. 2) executors of work – the station duty officer, the team of service point and other objects requiring action of the executor – station, train, set of work are operations of the technological process.
After the arrival of the train Time in min. Operations name
Before the arrival of the
train 0 5 10 15 20 Executor
Receiving, marking and transferring the telegrams-consignor list to the shunting station operator, to the station
and technology center, service point
Operator of station and technology center
The sorting list composition
Operator of station and technology center
Receiving the message about the number of a train and the time of its arrival from
a neighboring Station duty officer
Notification of station and technology center, service point and commercial inspection point workers about the time and route of the
train’s arrival
Station duty officer
Control check of the rolling stock in the input yard neck
Operator of station and technology center,
teletypist
3 Arrival of a train, fixing of rolling stock,
uncoupling and departure of train locomotive, the fencing of rolling stock
Signal operators, locomotive team, workers of service point
5 Delivery of shipping documents
to the station and technology center and technology center Operator of station
10 Check of telegrams-consignor list, marking
and verification of shipping documents and technology center Operator of station
3 Sorting list adjustment
Operator of station and technology center
17 Maintenance of the rolling stock, release
the brakes Workers of service point
17 Commercial inspection of rolling stock
Workers of commercial inspection point
Fig. 2. The action diagram for the technological process of trains processing that does not contain any internal action
Therefore, the following diagram shows the train and in parallel its departure station and the process of repetition and arrival of the train to the next sta-tion. Arrival of a train at the station runs «The arri-val and working of the train» process (Fig. 3).
Fig. 1. shows that for a given graph there are two parallel operations:
– the maintenance of rolling stock, release of brakes;
– commertial inspection of rolling stock.
Therefore, for such operations in view of the process in UML is provided the parallel displaying (Fig. 3). Each step is characterized by the execu-tors and the condition of work completeness in state. For work that is in the parallel actions sepa-rate chart can be constructed. Their own works chart on the designation of their parallel processes or operations can be constructed too for each ex-ecutor (duty officer of station and technology cen-ter, shunting locomotive, and team of service point). All parallel works should be completed. It is necessary for the diagram, the completion of train stay in state of parallel operations. It is the main condition for transition to the next operation in the diagram.
As it was described earlier, transition between states can contain the mark – «label». If the transi-tion label does not contain any event, it means that the transition occurs as soon as any activities asso-ciated with this condition would be completed. For example, from the «arrival of a train, fixing of roll-ing stock, uncouplroll-ing and departure of train loco-motive, the fencing of rolling stock» there are two possible transitions. The label of one of them in-cludes the condition that «The train has passed the control point». A conditional transition is executed only if the condition evaluates to «true», i.e. if the duty officer has reported on the received informa-tion and willingness to handle it, then the transiinforma-tion to the next state occurs. Otherwise the station duty officer waits for a notification.
At the given moment from the particular state only one transition can be made; thus, conditions help to avoid the dual result for any event. There are two special states: input and output. Any action related to the input event occurs when the object enters the state. The output event occurs when the object goes out of this state.
In the mode of train behavior in the system one can identify actions that are reflected by transitions, and actions that reflected by states.Although both
processes that are implemented, as a rule, by some «executors» of technical process, they are treated in different ways. Operations are associated with tran-sitions and treated as an instantaneous and continual one. Works are related with conditions and can last long enough. The work can be interrupted as a result of occurrence of some external event.
The representation of the process is quite easier to understand and reduces the time needed to study the process of the sorting station, because it has the opportunity to present the process from general to detailed. After the receiving the schematic display of the technological process in the environment of IBM Rational Rose user receives a text file with a description of the constructed process. The file can be applied in the analysis process and receiving calculations of indicators of processes stations formalization.
Findings
The methodology for the presentation of techno-logical processes of sorting stations in the form of a sequential execution of the operations and the tran-sitions between them, as well as representation the parallel operations and parallel action of object sort-ing station in these diagrams were proposed for the model development. All graphical representations are performed using standardized UML and they are represented as a directed graph with the states that is enough to understand the subject area. Applying the method of technological processes presentation, it is possible to learn the operation of any automation object very quickly. It is also possible to study their work during the construction of general work algo-rithms in detail with regard of sorting stations and other objects of railway transport.
The proposed model representation of the proc-ess of the sorting stations using standardized UML and the editor IBM Rational Rose allows saving graphic information in a text file. Using other software tools one can automate the file parsing of the process and calculate the efficient indicators of the process formation.
Originality and practical value
In result of the research the method of mathe-matical models constructing of technological proc-ess of the sorting station was proposed.
reduc-ing the time to construct the model and to present the process of sorting station; to specify, construct, document, formalize the process, to develop a se-quence diagram for different levels of detailing.
Conclusions
1. The use of the methods of graph theory and method of object-oriented analysis during the de-velopment allows realizing the graphical represen-tation of the technological process by the proposed method. With the help of actions diagram, the work process, contractors of work, as well as con-ditions and transitions between the operations in the process can be reflected. It is a quite conven-ient representation of the graph of the work process execution at the sorting station.
2. The use of unified design language UML for plotting actions, for displaying the processes of formalization technology works of sorting stations allows reducing the cost of technological processes development and increasing the work efficiency of the automated systems designers for railway trans-port objects.
LIST OF REFERENCE LINKS
1. Вернигора, Р. В. ПідготовкаДСПстанційділя
-нкиз використаннямтренажерного комплексу
/ Р. В. Вернигора, В. В. Малашкін // Транспорт.
системи та технології перевезень. – 2010. –
Вип. 1. – С. 34–37.
2. Диаграмма состояний [Electronic resource]. – Available at: http://itteach.ru/rational-rose/diagram-mi-sostoyaniy. – Title from the screen. – Accessed : 08.10.2014.
3. ИсториядиаграммыГанта [Electronic resource]. – Available at: http://gibtech.ru /blog/discus?entry _id=177 . – Title from the screen. – Accessed : 08.10.2014.
4. Карпов, Ю. Г. Теория автоматов / Ю. Г. Кар
-пов. – Санкт-Петербу́рг : Питер, 2003. – 208 c. 5. Козаченко, Д. Н. Математическая модель для
оценки технико-технологических показателей работыжелезнодорожных станций / Д. Н. Ко
-заченко // Наука та прогрес трансп. Вісн.
Дніпропетр. нац. ун-тузалізн. трансп. – 2013. –
№ 3 (45). – С. 22–28.
6. Козаченко, Д. Н. Объектно-ориентированная модель функционирования железнодорожных станций / Д. М. Козаченко // Науката прогрес трансп. Вісн. Дніпропетр. нац. ун-ту залізн.
трансп. – 2013. – № 4 (46). – С. 47–55.
7. Козаченко, Д. Н. Програмний комплекс для імітаційного моделюванняроботизалізничних
станцій на основі добового плану - графіку /
Д. М. Козаченко, Р. В. Вернигора, Р. Г. Ко
-робйова // Залізн. трансп. України. – 2008. –
№ 4 (70). – С. 18–20.
8. Конспект лекцій «Технологія і управління ро
-ботоюстанційтавузлів» [Electronic resource]. – Available at: http://ua-referat.com. – Title from the screen. – Accessed : 08.10.2014.
9. Котов, В. Е. СетиПетри / В. Е. Котов. – Моск
-ва : Наука, 1984. –160 с.
10. Леоненков, А. В. Самоучитель UML / А. В. Ле
-оненков. – Санкт-Петербу́рг : БХВ-Петербург, 2002. – С. 183–196.
11. Лустина, Е. Небольшойрассказ оГенри Ганте
[Electronic resource] / Е. Лустина. – Available at: http://www.mental-skills.ru/synopses/ 524. html. – Title from the screen. – Accessed : 08.10.2014. 12. Сетевыеграфикивпланировании / И. М. Разу
-мов, Л. Д. Белова, М. И. Ипатов, А. В. Про
-скуряков. – Москва : Высш. шк., 1967. –170 с. 13. Смородинцева, Е. Е. Организацияработи сорти
-ровочнойстанции / Е. Е. Смородинцева, Е. М. Ти
-мухина. – Екатеринбург : УрГУПС, 2010. –70 с. 14. Технологічний процес роботи Одеської заліз
-ниці. Державна адміністрація залізничного транспорту України. – Одеса : Держ. адм. за
-лізн. трансп. України, 2009. – 168 с.
15. ЦД-0082. Практичні рекомендації щодо скла
-даннятехнологічногопроцесуроботисортува
-льноїстанції. – Київ : ДЕТУТ, 2009. – 84 c. 16. A graph grammar-based formal validation of
object-process diagrams Software and Systems Modeling [Electronic resource]. – 2012. – № 11 (2). –
Р. 287–302. – Available at: http://www.scopus.com/ inward/record.url?eid=2-s2.0-84860480881&part-nerID=40&md5=e5455760c5351950d7411631552e 6daf. – Title from the screen. – Accessed : 08.10.2014.
17. Ma, L. Design of wagon-flow simulation system of railway marshalling yard based on J2EE Xitong Fangzhen Xuebao [Electronic resource] / L. Ma, J. Guo, G.-W. Chen // J. of System Simulation. – 2013. – № 25 (5). – Р. 1083–1089. – Available at: http://www.scopus.com/inward/record.url?eid=2-s2.0-84878478072&partnerID=40&md5=684049 1 07fe03bc4af534334f33c03e4. – Title from the screen. – Accessed : 08.10.2014.
О
.
В
.
ГОРБОВА
1*1*Науково-дослідначастина, Дніпропетровськийнаціональнийуніверситетзалізничноготранспортуімені
академікаВ.Лазаряна, вул. Лазаряна, 2, Дніпропетровськ, Україна, 49010, тел. +38 (056) 776 90 59,
ел. пошта [email protected], ORCID -0000-0002-5612-2715
МОДЕЛЮВАННЯ
РОБОТИ
СОРТУВАЛЬНОЇ
СТАНЦІЇ
ЗА
ДОПОМОГОЮ
МОВИ
UML
Мета. Дослідженняспрямованенапобудовуметодівтамоделейграфічногопредставленнятехнологічно
-гопроцесусортувальноїстанціїзадопомогоюуніфікованоїмовимоделювання (UML). Методика. Вякості методівдослідженнявикористовувалисьметодитеоріїграфів, скінченнихавтоматівтатеоріїпредставлення системмасового обслуговування. Графічне представленнятехнологічного процесу реалізованоза допомо
-гоюуніфікованоїмовимоделювання UML. Представленнятехнологічногопроцесусортувальноїстанціїре
-алізованоувиглядідіаграмистанівтадійзадопомогоюкомплексу IBM Rational Rose. Діаграмимаютьмож
-ливістьпоказатипаралельність робітсортувальної станції, паралельністьіснуваннята впливуоб’єктівтех
-нологічногопроцесутаперехідвідодногостанувінший. Комплекс IBM Rational Rose дозволяєрозробляти діаграмипослідовностіробітрізногоступенядеталізації. Результати. Урезультатідослідженнярозроблено методграфічногопредставленнятехнологічногопроцесусортувальнихстанційрізноговидускладності. Всі графічніпредставленнявиконуютьсязадопомогоюуніфікованоїмови UML, представляютьсяувиглядіорі
-єнтованогографузістаном, щоєдоситьзрозумілимпрививченніпредметноїобласті. Застосовуючимето
-дику представлення технологічних процесів, можна швидко ознайомитись із роботою будь-якого об’єкта автоматизації. Можливотакожвивчитиїхроботиприпобудовіалгоритміввідзагальнихробітдодетальних,
щостосується, втомучислі, ісортувальнихстанційтаіншихоб’єктівзалізничноготранспорту. Данумодель реалізованозадопомогоюуніфікованоїмовимоделювання (UML) звикористаннямкомплексу IBM Rational Rose. Науковановизна. Зарахуноквикористанняуніфікованоїмовимоделювання (UML) розробленопред
-ставленнятехнологічногопроцесусортувальноїстанції. Розробленаметодологія представленнятехнологіч
-ногопроцесу, щодозволяє створюватиорієнтованіграфинаосновівиконанняланцюжкаробіт, об’єктівта виконавцівцих робіт. Мова UML дозволяє візуалізувати, специфікувати, конструюватита документувати,
формалізуватипредставленнятехнологічногопроцесусортувальноїстанціїтарозроблятидіаграмипослідо
-вностіробітрізногоступенядеталізації. Практичназначимість. Використанняуніфікованоїмовимоделю
-вання (UML) наосновіпрограмногокомплексу IBM Rational Rose дозволяє: створюватитехнологічніпроце
-сирізного ступеня деталізації; скоротити витратичасу навивчення технологічного процесу сортувальної станціїтаотриматинагляднеграфічнейогопредставлення; зменшитилюдськівитратиприпобудовітаудо
-сконаленні, існуючихтехнологічнихпроцесів.
Ключовіслова:орієнтованийграф; сортувальнастанція; технологічнийпроцес; план-графікроботистан
-ції; паралельніпроцеси; UML
А
.
В
.
ГОРБОВА
1*1*Научно-исследовательскаячасть, Днепропетровскийнациональныйуниверситетжелезнодорожноготранспорта
имениакадемикаВ. Лазаряна, ул. Лазаряна, 2, Днепропетровск, Украина, 49010, тел. +38 (056) 776 90 59,
эл. почта alexandra.gorbova @ gmail.com, ORCID -0000-0002-5612-2715
МОДЕЛИРОВАНИЕ
РАБОТЫ
СОРТИРОВОЧНОЙ
СТАНЦИИ
С
ПОМОЩЬЮ
ГРАФИЧЕСКИХ
ПРЕДСТАВЛЕНИЙ
Цель. Исследованиенаправленонапостроение методови моделейграфического представлениятехно
-логическогопроцессасортировочнойстанцииспомощьюунифицированногоязыкамоделирования (UML).
Методика. В качестве методов исследования использовались методы теории графов, конечных автоматов
итеориипредставлениясистеммассовогообслуживания. Графическое представлениетехнологического про
-цессареализованоспомощьюунифицированногоязыкамоделирования UML. Представлениетехнологическо
-го процессасортировочной станции реализовано в виде диаграммы состоянийи действийс помощью ком
-лельность существования и влияния объектов технологического процесса и переход от одного состояния
вдругое. Комплекс IBM Rational Rose позволяетразрабатыватьдиаграммыпоследовательностиработразлич
-нойстепенидетализации. Результаты.Врезультатеисследования разработанметодграфическогопредстав
-лениятехнологическогопроцессасортировочныхстанцийразличноговидасложности. Всеграфическиепред
-ставлениявыполняютсяспомощьюунифицированногоязыка UML, представляютсяввидеориентированного графассостоянием, достаточнопонятнымприизучениипредметнойобласти. Применяяметодикупредставле
-ниятехнологическихпроцессов, можнобыстроознакомитьсясработойлюбогообъектаавтоматизации, атак
-жеизучитьтехнологическийпроцессприпостроенииалгоритмовсортировочныхстанцийидругихобъектов железнодорожноготранспорта. Даннаямодельреализованаспомощьюунифицированногоязыкамоделирова
-ния (UML) сиспользованиемкомплекса IBM Rational Rose. Научнаяновизна. Сучетомиспользованияуни
-фицированногоязыкамоделирования (UML) разработанопредставлениетехнологическогопроцессасортиро
-вочнойстанции. Методологияпредставлениятехнологического процессапозволяетсоздавать ориентирован
-ные графы на основепорядкавыполнения цепочки работ, объектови исполнителей этихработ. Язык UML
позволяет визуализировать, специфицировать, конструировать и документировать, формализовать представ
-ление технологического процесса сортировочной станции и разрабатывать диаграммы последовательности работразличнойстепенидетализации. Практическая значимость. Использованиеунифицированногоязыка моделирования (UML) наосновепрограммногокомплекса IBM Rational Rose позволяет: создаватьтехнологи
-ческиепроцессы различнойстепенидетализации; сократить затратывремени на изучение технологического процессасортировочнойстанциииполучитьнаглядноеграфическоепредставление; уменьшитьчеловеческие затратыприпостроенииисовершенствованиисуществующихтехнологическихпроцессов.
Ключевые слова: ориентированный граф; сортировочная станция; технологический процесс; план
-графикработыстанции; параллельныепроцессы; UML
REFERENCES
1. Vernyhora R.V., Malashkin V.V. Pidhotovka DSP stantsii dilianky z vykorystanniam trenazhernoho kom-pleksu [The station duty officer preparation of a section with using the training complex]. Transportni systemy ta tekhnolohii perevezen – The Transport System and Transport Technology, 2010, issue 1, 34-37 p.
2. Diagramma sostoyaniy [State diagram]. Available at: http://itteach.ru/ rational-rose/diagrammi-sostoyaniy (Accessed 8 October 2014).
3. Istoriya diagrammy Ganta [The history of the Gantt chart]. Available at: http://gibtech.ru /blog/discus? entry_id=177 (Accessed 8 October 2014).
4. Karpov Yu.H. Teoryia avtomatov [Theory of machines]. Saint-Petersburg, Piter Publ., 2003. 208 p.
5. Kozachenko D.N. Matematicheskaya model dlya otsenki tekhniko-tekhnologicheskikh pokazateley raboty zheleznodorozhnykh stantsiy [A mathematical model for assessing the technical performance of rail stations].
Nauka ta prohres transportu. Visnyk Dnipropetrovskoho natsionalnoho universytetu zaliznychnoho transportu
− Science and Transport Progress. Bulletin of Dnipropetrovsk National University of Railway Transport,
2013, no. 3 (45), pp. 22-28.
6. Kozachenko D.N. Obektno-oriyentirovannaya model funktsionirovaniya zheleznodorozhnykh stantsiy [The object-oriented model of the functioning of railway stations]. Nauka ta prohres transportu. Visnyk Dnipropet-rovskoho natsionalnoho universytetu zaliznychnoho transportu − Science and Transport Progress. Bulletin of Dnipropetrovsk National University of Railway Transport, 2013, no. 4 (46), pp. 47-55.
7. Kozachenko D.M., Vernyhora R.V., Korobiova R.H. Prohramnyi kompleks dlia imitatsiinoho modeliuvannia roboty zaliznychnykh stantsii na osnovi dobovoho planu – hrafiku [Software package for simulation of rail sta-tions on the basis of the daily schedule]. Zaliznychnyi transport Ukrainy –Railway transport of Ukraine, 2008, no. 4 (70), pp.18-20.
8. Konspekt lektsii «Tekhnolohiia i upravlinnia robotoiu stantsii ta vuzliv» [Lecture notes «Technology and man-agement work of stations and sites»]. Available at: http://ua-referat.com (Accessed 8 October 2014).
9. Kotov V.Ye. Seti Petri [Petri nets].Moscow, Nauka Publ., 1984. 160 p.
10. Leonenkov A.V. Samouchitel UML [The UML tutorial]. Saint-Petersburg, BKhV-Peterburg Publ., 2002, pp. 183-196.
11. Lustina Ye. Nebolshoy rasskaz o Genri Gante [A short story about Henry Gantt]. Available at: http://www.mental-skills.ru/synopses/ 524. html (Accessed 8 October 2014).
13. Smorodintseva Ye.Ye. Timukhina Ye.M. Organizatsiya raboty sortirovochnoy stantsii [The organization works of sorting station]. Ekaterinburg, UrGUPS Publ., 2010. 70 p.
14. Tekhnolohichnyi protses roboty odeskoi zaliznytsi. Derzhavna administratsiia zaliznychnoho transportu Ukrainy [The technological process of the Odessa railway. State administration of railway transport of Ukraine]. Odessa, Derzhavna administratsiia zaliznychnoho transportu Ukrainy Publ., 2009. 168 p.
15. TsD-0082. Praktychni rekomendatsii shchodo skladannia tekhnolohichnoho protsesu roboty sortuvalnoi stantsii. Praktychni rekomendatsii [CD-0082-Practical guidelines for the process of sorting station. Practical recommendations]. Kyiv, DETUT Publ., 2009. 84 p.
16. A graph grammar-based formal validation of object-process diagrams. Software and Systems Modeling, 2012,
№ 11 (2), 287–302 p. Available at: http://www.scopus.com/inward/record.url?eid=2-s2.0-84860480881& partnerID=40&md5=e5455760c5351950d7411631552e6daf (Accessed 8 October 2014). doi: 10.1007/s10270–011–0201–4.
17. Ma L., Guo J., Chen G.-W. Design of wagon-flow simulation system of railway marshalling yard based on J2EE Xitong Fangzhen Xuebao. Journal of System Simulation, 2013, no. 25 (5), pp. 1083-1089. Available at: http://www.scopus.com/inward/record.url?eid=2-s2.0-84878478072&partnerID=40&md5=684049107fe03b c4af 534334f33c03e4 (Accessed 8 October 2014).
18. Yang N.-H., Yu H.-Q., Lu M. Modeling UML state diagrams based on extended ITCPN Huadong Ligong Daxue Xuebao. Journal of East China University of Science and Technology, 2011, no. 37 (6), pp. 765–769. Available at: http://www.scopus.com/inward/record.url?eid=2-s2.0-84856354155&partnerID=40&md5=87d8 d9f4b6cab4498f04799eba638baf (Accessed 8 October 2014).
Prof. D. N. Kozachenko, D. Sci. (Tech.); Prof. O. M. Ogar, D. Sci. (Tech.) recommended this article to be published