IC, 2020 – 16(1): 1-13 – Online ISSN: 1697-9818 – Print ISSN: 2014-3214 https://doi.org/10.3926/ic.1362
Development of the performance-potential survey for the
quantitative placement of employees on the talent matrix
Alejandro González Cánovas1 , Juan Fernández Millán1 , Marina Fernández Navas2 , Victoria Sánchez Mas1
1Universidad de Granada (Spain)
2Colegio Oficial de Psicólogos de Melilla (Spain)
[email protected], [email protected], [email protected], [email protected]
Received September, 2018 Accepted January, 2020
Abstract
Purpose: The limited research conducted (scientific articles published in indexed journals) belies the interest that the talent matrix has in the business world. It is for this reason that the present work has been carried out, the aim of which is to create and validate a survey. The scores obtained reflect the positions of employees on the talent matrix, which will make it possible to place the evaluated subjects according to a quantitative criterion.
Design/methodology: The participants were 172 employees from different companies who were evaluated by middle management.64.9% were men, and 35.1% were women. The research is framed within the “Instrumental studies” methodology, having used a non-probabilistic convenience sampling technique.
Findings: An 8-item survey has been developed on which the performance, potential and total scores allow us to quantitatively place the employees in the different boxes on the talent matrix. This serves to establish the human capital of the company and to facilitate staff replacements or promotions.
Practical implications: A validated instrument is provided to determine quickly and easily the talent of the human capital, on both an individual and a group level, which will permit decision-making for personnel management.
Social implications: The use of a quantitative instrument improves the perception of fairness on the part of businesses, and therefore improves the organizational climate.
Originality/value: The research is aimed and we believe would be of interest to Human Resource professionals, since it provides them with a tool that can be used to evaluate the talent of employees.
Keywords:Talent matrix, Performance, Potential
To cite this article:
González Cánovas, A., Fernández Millán, J., Fernández Navas, M., & Sánchez Mas, V. (2020). Development of the performance-potential survey for the quantitative placement of employees on the talent matrix. Intangible Capital, 16(1), 1-13. https://doi.org/10.3926/ic.1362
1. Introduction
The management of a company’s staff, and as part of this management, HR planning, is becoming a crucial task for the evolution and maintenance of organizations. This means that companies must find ways of attracting and keeping the right people for each position and having a priori “replacement” people who can be promoted (furthering their careers) as necessary for the organization and as satisfactory for the employee.
This recognition is what has been termed “human capital,” understood as the productivity of workers in function of their training and job experience (Méndez, s.f.). Although for Sen (1998), it is more correct to speak of “human capacity,” which does not limit the concept to its relationship with economic growth, the truth is that the term human capital has been imposed and is used to establish the manpower of a company, conceived of as the most valuable and basic resource, given that it is responsible for developing productivity (Martín, Segrero & Perdomo, 2013; Mora Venegas, 2005).
From this perspective, personnel is no longer conceived of as a cost, but rather as a resource:“the main competitive resource” (Pereda & Berrocal, 2011).
On its website, Work Meter (2014, March 27) states that “Talent management will be the challenge that Human Resource departments will need to face in 2015.Attracting candidates and, above all, retaining the best profiles, will be the most important challenges for companies over the next few months.”
Personnel management requires techniques/procedures/tools that help define the possibilities available and the human capital needs that will arise in the future.
For this reason, the professional career plan (Mondy & Noe, 2015; Siliceo, 2015) is a system that will allow us to know which positions might be replaced by which positions, i.e., it allows us to know the best person, with the required competences, at all times for a specific position, so that the company’s objectives can be reached (Pereda & Berrocal, 2011). One necessary step in this personnel management system is to create a professional path and itinerary plan (WIKI-EOI, 2012, May 10) that will help us know a priori staff member movements, both vertically and horizontally.
With this tool, we will know the possible rotations among positions; however, competence management is based on the fact that not all holders of the same position have the same level of competences. To accomplish this, a second management tool must allow us to differentiate among the talents of each of the employees. Knowing the distribution of the company’s human capital will make it possible to select the right candidate for possible staffing needs. This talent management must be based on tools that facilitate the strategic planning and decision-making required by the company/organization (Cuesta, 2015).
The talent matrix is used for this task. Developed by Mckinsey (Figure 1), it was later improved in the late 1960s by General Electric. It consists of a double-entry table in which the employees are organized or distributed according to two factors: their performance and their potential. Three levels are established for each factor:
• Potential: low, medium and high.
• Performance: does not meet objectives, meets objectives or exceeds objectives.
2014). Likewise, performance is made up by the behaviors and skills that the employee brings to a job position in order to fulfill responsibilities effectively and in a satisfactory manner (Porret, 2014).
Figure 1. Mckinsey's talent matrix (Cuesta, 2015)
From the combination of the three levels of the two factors, we can obtain 9 boxes or categories that have been defined in different ways, all agreeing in their essential aspects. Cuesta (2015) identifies the following categories:
High Performance/High Potential: Future leaders/Stars
Medium Performance/High Potential: Growing/Emerging
High Performance/Medium Potential: Contributor
High Performance/Low Potential: Unclear/Latent
Medium Performance/Medium Potential: Core contributors/Traditional
High Performance/Low Potential: Trusted professionals/Workers
Medium Performance/Low Potential: Dilemma/Stagnant
Medium Performance/Low Potential: Effective employees/Blockers
Low Performance/Low Potential: Detractors
Once all the employees in a company are placed in this matrix and the number of workers in each box is converted into a percentage, the prospective conclusions can be reached and decisions made by virtue of the human capital that the company has.
Cuesta (2015) applied this system to a financial institution and found the following distribution (Table 1):
Potential
High 9% 17%
Medium 62% 11%
Low 2%
Low Medium High
Performance
The placement of the 47 employees in the boxes is based on the scores obtained on the competence diagnostic tool, based on a Likert scale, using the Gauss bell-shaped curve to standardize the results, correct any possible deviations associated with trends in the evaluation and distribute the employees into the different boxes of the matrix.
The distribution of employees in the talent matrix will allow us, as previously stated, to make decisions in different personnel management areas, such as the design of the training offering, specifying the need for recruitment and personnel selection, succession planning, talent retention programs, etc.
The subjects can be distributed in the matrix by simply requesting the managers/leaders/observers to do so as they see fit, but it is more appropriate and objective to use other techniques to identify talent.
WIKI-EOI (2012, May 10) suggests different tools for this purpose: potential self-identification surveys, potential identification interviews, direct observation, simulations and professional tests and analyses of the person/job position fit.
Parallel to this, the use of methods that are standardized, recognized, and to the extent possible, objective will further benefit the company.
By definition, this use of objective methods and procedures agreed upon a priori will improve the perception of fairness on the part of the business (Martínez-Tur, Moliner, Ramos, Luque & Gracia, 2014), a construct that at the same time is related to quality, work environment, wellbeing in the workplace and motivation.
Organizational fairness is understood as the perception that employees of a company have about the equity with which resources are assigned and distributed, the compensation and treatment by their superiors (Patlán, Flores, Martínez & Hernández, 2014). In a very similar manner, Cropanzano, Rupp, Mohler and Schminke (2001) refer to this construct as the degree to which an element of the organization is perceived as just, according to a certain rule or standard. Concentrating on the elements (factors or dimensions) into which this concept is divided in the studies by Niehoff and Moorman (1993), we can differentiate among distributive, procedural and interaction-related justice. By definition, we can state that the use of the talent matrix (and objective tools to evaluate employees) will positively affect the procedural justice, understood as the degree to which the procedures that are used for decision-making are perceived as fair (Thibaut & Walker, 1975).
For Fernández-Losa (2002), if the company wishes to maximize the motivation of its employees, it must help them direct and manage their professional careers.
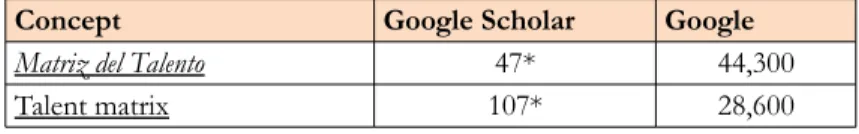
Research on the talent matrix is limited, as can be seen when searching for concepts such as “talent matrix” or “matriz del talento” in search engines such as Google Scholar and Google (general) (Table 2).
Concept Google Scholar Google
Matriz del Talento 47* 44,300
Talent matrix 107* 28,600
(*) Reference citations have been eliminated
Table 2. Results for the concepts “matriz del talento” and “talent matrix” in the following Internet search engines (October 2017)
The limited research conducted (scientific articles published in indexed journals) belies the interest that the talent matrix has in the business world. This is the reason for the present work, the aim of which is to create and validate a survey. The scores obtained reflect the positions of employees on the talent matrix, which will make it possible to place the evaluated subjects according to a quantitative criterion.
The study must be complemented by others with a larger number of participants and considering other variables. In addition, as this study is the first attempt at a survey, it is necessary for future studies to conduct an exploratory and confirmatory factor analysis of the instrument.
One limitation found has been the scarce difference in the mean scores of the survey in relation to the boxes assigned on the matrix, and even that the hypotheses are not fulfilled in terms of the distribution of these scores among some of the boxes.
2. Method
2.1. Participants
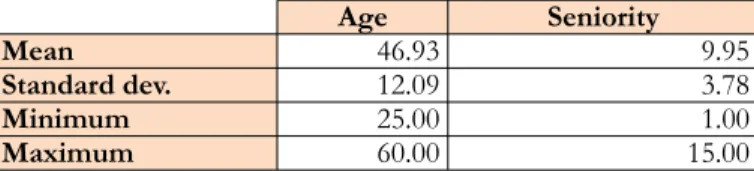
The participants were 172 employees from different companies who were evaluated by middle management.64.9% were men, and 35.1% were women. The age and seniority of the participants is shown in Table 3.In order to obtain the frequencies, the data were grouped for both age and seniority, in segments of 5 years (starting at age 20 and 1 year of seniority). See Figures 2 and 3.
Age Seniority
Mean 46.93 9.95
Standard dev. 12.09 3.78
Minimum 25.00 1.00
Maximum 60.00 15.00
Table 3. Descriptive statistics of the participants in the study, according to age and seniority in their job positions
Figure 2. Percentage of subjects by age
2.2. Design
According to the classification proposed by Ato, López and Benavente (2013), the present work would fall under the “Instrumental Studies” methodology.
A non-probabilistic convenience sampling technique was used (Morales, 2008).
2.3. Procedure
HR department staff or directors of different companies in different fields were contacted and asked to use the “work development-potential” survey (APPENDIX A) to evaluate a group of employees. Once these employees were evaluated, they needed to be “placed” on a talent matrix (APPENDIX B).The surveys were double-blind. The evaluator should not reveal his identity and the evaluated employees were referred to with a random number assigned by the evaluator, with the sole condition that the survey number had to match that of the matrix in order to perform the calculations between the instruments.
The participants were informed by the email to which the surveys were attached or in the personal interview with the evaluators about the objectives of the research project, stating that participation was voluntary and by submitting the surveys, they consented to their use.
To obtain the results, version 24 of IBM’s statistical program SPSS was used.
2.4. Results
Before presenting the results, and for a better understanding of certain conclusions drawn from them, it is necessary to clarify certain classifications.
The first refers to the ordinal classification assigned to the boxes (cells) of the matrix shown in Figure 4 by Pérez (2014), since some results will be interpreted based on this order.
Figure 4. Box Talent Matrix (Pérez, 2014)
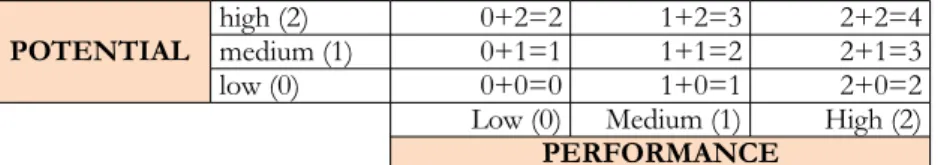
Furthermore, it is necessary to note that each box will have a score that is the sum of the performance scores (0.1 or 2) and potential scores (0.1 or 2) corresponding to the levels (Table 4), which means that 0 points correspond to box 9; 1 point to boxes 7 and 8; 2 points to boxes 4, 5 and 6; 3 points to boxes 2 and 3; and 4 points to box 1.
POTENTIAL high (2)medium (1) 0+2=20+1=1 1+2=31+1=2 2+2=42+1=3
low (0) 0+0=0 1+0=1 2+0=2
Low (0) Medium (1) High (2)
PERFORMANCE
2.4.1. Survey statistics
The results show instrument reliability (Table 5) using Cronbach’s α (.874), which is good, according to the criteria established by George and Mallery (2003).
Cronbach’s
alpha Cronbach’s alpha, based onstandardized items Number ofitems
.874 .879 8
Table 5. Survey reliability
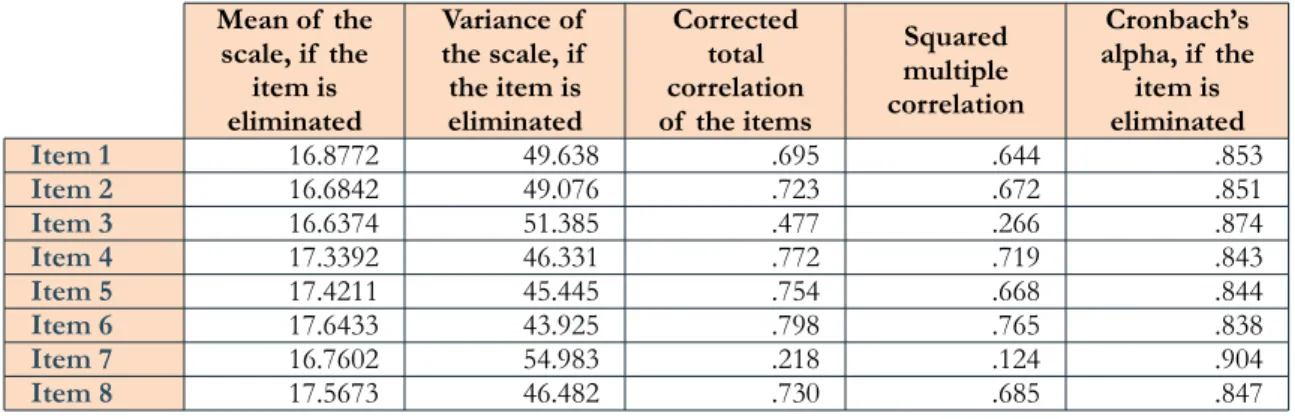
No corrected total correlation of the items is 0 or less, and thus it was not necessary to eliminate any item.
According to Cronbach’s alpha, the reliability of the sample (.874) would improve if we eliminate item 7 (.904).However, given the small number of items that make up the scale and the parity in those that evaluate performance and potential, the decision was made not to eliminate them (Table 6).
Mean of the scale, if the
item is eliminated
Variance of the scale, if the item is eliminated
Corrected total correlation of the items
Squared multiple correlation
Cronbach’s alpha, if the
item is eliminated
Item 1 16.8772 49.638 .695 .644 .853
Item 2 16.6842 49.076 .723 .672 .851
Item 3 16.6374 51.385 .477 .266 .874
Item 4 17.3392 46.331 .772 .719 .843
Item 5 17.4211 45.445 .754 .668 .844
Item 6 17.6433 43.925 .798 .765 .838
Item 7 16.7602 54.983 .218 .124 .904
Item 8 17.5673 46.482 .730 .685 .847
Table 6. Total item statistics
2.4.2. Correlations among the survey scores and the matrix
The correlations that are of interest for this study are those that relate the same factors on the survey and on the matrix. As can be seen in Table 7, all three are significant at a level of 0.01.According to the criteria of both Hopkins, Marshall, Baterham and Hanin (2009) and Cohen (1988), the effect size (d) associated with the correlation (r) would be large for all three variables.
Matrix
Development Potential Total
Survey
Development
Pearson
correlation .679** .415** .688**
Sig.(bilateral) .000 .000 .000
N 172 172 172
Potential
Pearson
correlation .574** .505** .683**
Sig.(bilateral) .000 .000 .000
N 172 172 172
Total
Pearson
correlation .665** .490** .729**
Sig.(bilateral) .000 .000 .000
N 172 172 172
(**) The correlation is significant at the 0.01 level (bilateral).
With regard to the variables of gender, seniority and age, significant negative correlations (0.01) appear with a large effect size (d=1) between age and the three survey scores. There is also a significant negative correlation (0.05) with a moderate effect size (d>0.6) between seniority in the job position and potential (Table 8).
Age Seniority Gender
Survey
Performance Pearson correlation -.444** -.145 .176
Sig.(bilateral) .001 .286 .191
N 57 56 57
Potential Pearson correlation -.444** -.298** .152
Sig.(bilateral) .001 .026 .259
N 57 56 57
Total Pearson correlation -.462** -.231 .170
Sig.(bilateral) .000 .087 .205
N 57 56 57
(**)The correlation is significant at the 0.01 level (bilateral). (*)The correlation is significant at the 0.05 level (bilateral).
Table 8. Correlations between the survey factors and personal and work-related variables
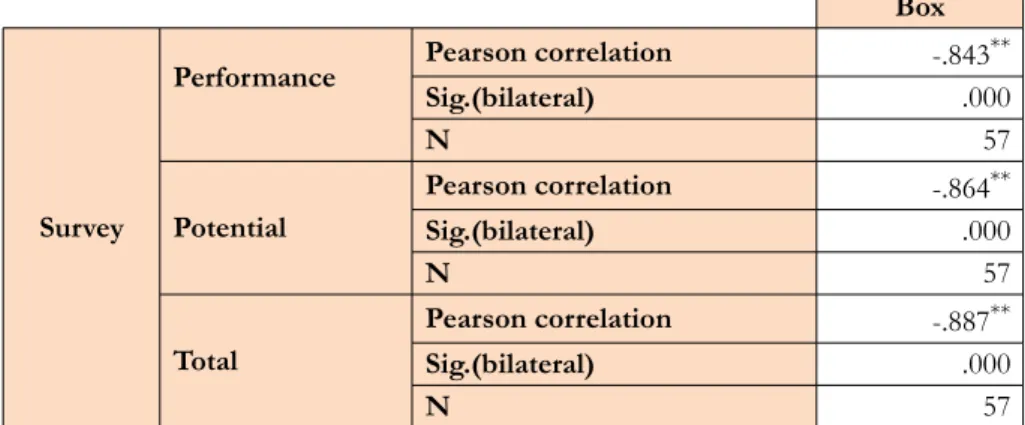
Finally, as can be seen in Table 9, significant negative correlations (0.01) appear with a large effect size between the total scores obtained on the survey and the assigned box on the matrix.
Box
Survey
Performance Pearson correlation -.843
**
Sig.(bilateral) .000
N 57
Potential
Pearson correlation -.864**
Sig.(bilateral) .000
N 57
Total
Pearson correlation -.887**
Sig.(bilateral) .000
N 57
Table 9. Correlations between the total scores obtained on the survey and the number of the matrix box assigned to the subject
2.4.3. Means and standard deviations obtained on the survey of the subjects distributed in the assigned boxes
Distribution of the participants (no. of subjects per box)
Box N
1 22
2 10
3 24
4 4
5 21
6 33
7 16
8 27
9 15
Table 10. Number of subjects assigned in the different matrix boxes
Table 11 shows the mean scores and the standard deviations in performance obtained on the survey, according to the subject’s classification on the matrix.
10.75
2.50 11.403.17 15.091.06
9.63
2.98 9.003.76 13.251.87
3.20
1.47 7.432.60 12.432.04
Low Medium High
Table 11. Means and standard deviations in the performance factor of the survey, according to the box assigned to the subject
If we accept our hypothesis that the performance score obtained on the survey correlates with that obtained on the matrix, and thus determines the box in which the subject must be placed, the scores must be centrifugally larger from box 9 on, particularly in the horizontal direction. Observing the table, it can be seen that this does occur, both horizontally (from 9 to 5, from 8 to 3 and from 4 to 1), and diagonally (from 9 to 1), except between boxes 8 and 6.
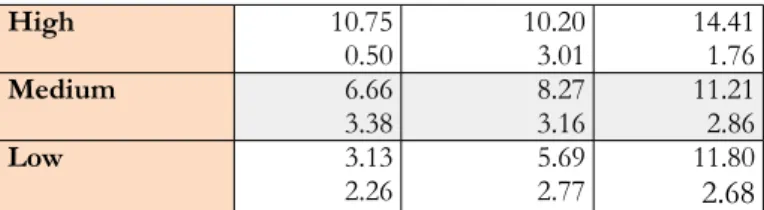
Table 12 shows the mean scores and the standard deviations in potential obtained on the survey, according to the subject’s classification on the matrix.
High 10.75
0.50 10.203.01 14.411.76
Medium 6.66
3.38 8.273.16 11.212.86
Low 3.13
2.26 5.692.77 11.802.68 Table 12. Means and standard deviations in the potential factor
of the survey, according to the box assigned to the subject
In the case of potential, the scores increase diagonally from box 9 to l 1 and vertically from the bottom boxes (9, 7 and 5) to the top ones (4, 2 and 1), except between boxes 5 and 3.
High 21.503.00 21.605.76 29.502.24
Medium 16.295.65 17.276.19 24.463.55
Low 6.332.89 13.124.81 24.243.95
Low Medium High
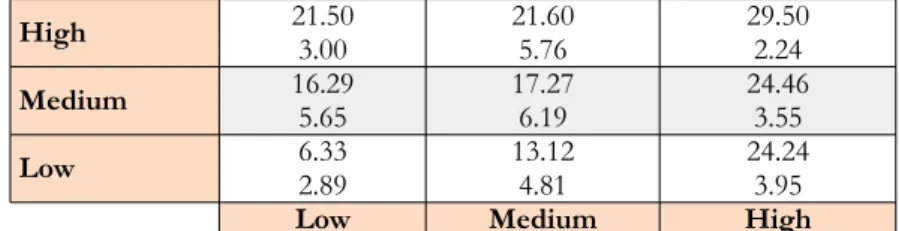
Table 13. Means and standard deviations in the total score of the survey, according to the box assigned to the subjects
In agreement with the hypotheses, the total scores increase diagonally, horizontally and vertically.
3. Discussion and conclusions
The results obtained in this study support the suitability of the use of the survey to evaluate talent, understood as the level of current performance and potential for improvement, of employees in an organization in a simple, quick and quantifiable manner. Once the scores for the two factors and the total are obtained, and knowing the mean scores for each box, the professional can “place” each subject on the matrix and convert the number of employees into percentages that will be used to determine the talent and future of the company in terms of its human capital.
The data on the reliability of the survey are sufficient to conclude that it is a statistically reliable instrument.
The correlations obtained between the survey scores and the matrix, in turn, confirm our hypothesis (H1) and allow us to conclude that the data obtained on the survey reflect the levels on the matrix.
The correlation (negative) found between age and the factors indicates that with age, the performance and potential decrease, which did not occur in relation to seniority in the job position. This is an aspect that requires further work to determine the reason why employees perform less and are less prepared with age. One possible explanation would be that the effect owes more to a generational culture than to age itself.
Finally, the mean scores found for each matrix box allow us to place the subject on the matrix, according to the scores obtained on the survey, albeit with some limitations.
The study has some limitations on both a methodological level (number of participants) and in terms of the results. Further work must be done with a larger number of participants and considering other variables. One limitation found has been the scarce difference in the mean scores of the survey in relation to the boxes assigned on the matrix, and even that the hypotheses are not fulfilled in terms of the distribution of these scores among some of the boxes. Furthermore, an important line of work emerges from the present study: to ensure that, by applying the matrix, it is possible to obtain the expected results with regards to the evolution of professionals. It is thus necessary to conduct a longitudinal analysis that confirms or refutes its utility over time.
In the field of organizational or work psychology, and more specifically, in Human Resources, a greater number of studies need to be conducted for the practical purpose of giving companies reliable systems to manage their staffs.
Declaration of Conflicting Interests
The authors declared no potential conflicts of interest with respect to the research, authorship, and/or publication of this article.
Funding
References
Ato, M., López, J., & Benavente, A. (2013). Sistema de clasificación de los diseños de investigación en psicología. Anales de Psicología, 29 (3), 1038-1059. https://doi.org/10.6018/analesps.29.3.178511
Cohen, J. (1988). Statistical Power Analysis for the Behavioral Sciences (2nd. Ed.). Lawrence Erlbaum Associates, Publishers. Retrieved from: http://www.utstat.toronto.edu/~brunner/oldclass/378f16/readings/CohenPower.pdf Cropanzano, R., Rupp, D.E., Mohler, C.J., & Schminke, M. (2001). Three roads to organizational justice. Research
in Personnel and Human Resources Management, 20, 1-113. https://doi.org/10.1016/S0742-7301(01)20001-2
Cuesta, X.V. (2015). Proceso Gestión de talento en la Unidad Financiera del Grupo Industrial Graiman. Tesis Universidad del Azuay. Maestría en Recursos Humanos y Desarrollo Organizacional II
Fernández-Losa, N. (2002). El desarrollo profesional de los trabajadores como ventaja competitiva de las empresas. Cuadernos de Gestión, 2 (1). Retrieved from:
http://www.ehu.eus/cuadernosdegestion/documentos/214.pdf
George, D., & Mallery, P. (2003). Spss for Windows step by step: A Simple Guide and Reference. 11.0 Update (4th ed.). Boston: Allyn & Bacon.
Hopkins, W.G., Marshall, S.W., Baterham, A.M.., & Hanin, J. (2009). Progressive statistics for studies in sports medicine and exercise science. Medicine & Science in Sports & Exercise, 41 (1), 3-12. Retrieved from:
https://journals.lww.com/acsm-msse/Fulltext/2009/01000/Progressive_Statistics_for_Studies_in_Sports.2.aspx Martín, X., Segredo, A., & Perdomo, I. (2013). Capital humano, gestión académica y desarrollo organizacional.
Educación Médica Superior, 27(3), 288-295.
Martínez-Tur, V., Moliner, C., Ramos, J., Luque, O., & Gracia, E. (2014). Calidad y bienestar en organizaciones de servicios: El papel del clima de servicio y la justicia organizacional. Papeles del Psicólogo, 35 (2), 99-106.
Méndez, J.C. (s.f.). La importancia del Capital Humano en las Organizaciones. Retrieved from: http://www.arearh.com/rrhh/capital_humano.htm
Mondy, R., & Noe, R. (2015). Administración de recursos humanos (11th ed.). México: Pearson Educación.
Mora Venegas, C. (2005). El Capital Humano en el comportamiento organizacional [monografía en Internet]. [citado 12 Sep 2012]. Available at: http://www.gestiopolis.com/canales5/rrhh/elhucompor.htm
Morales, P. (2008). Estadística aplicada a las Ciencias Sociales. Madrid: Universidad Pontificia de Comillas. Niehoff, B.P., & Moorman, R.H. (1993). Justice as a mediator of the relationship between methods of
monitoring and organizational citizenship behavior. Academy of Management Journal, 36, 527-556. https://doi.org/10.2307/256591
Patlán, J., Flores, R., Martínez, E., & Hernández, R. (2014). Validez y confiabilidad de la escala de justicia organizacional de Niehoff y Moorman en población mexicana. Contaduría y Administración, 59(2), 97-120. Retrieved from: file:///C:/Users/Windows7/Downloads/58-58-1-PB.pdf https://doi.org/10.1016/S0186-1042(14)71256-2
Pereda, S., & Berrocal, F. (2011). Dirección y gestión de recursos humanos por competencias. Madrid: Ed. Universitaria Ramón Areces.
Pérez, O. (2014). Matriz de Administración de Talento Humano de las 9 Cajas. Retrieved on December 2nd from: http://blog.peoplenext.com.mx/matriz-de-administacion-de-talento-humano-de-las-9-cajas
Porret, M. (2014). Gestión de personas. Manual para la gestión del capital humano en las organizaciones (6th ed.). Barcelona: Ed. ESIC.
Thibaut, J., & Walker, L. (1975). Procedural justice: A psychological analysis. Hillsdale, NJ: Lawrence Erlbaum Associates, Inc.
WIKI-EOI, (2012). Diseño e implantación de un plan de desarrollo profesional en Recursos humanos. Retrieved on May 10th from: http://www.eoi.es/wiki/index.php/Dise%C3%B1o_e_implantaci
%C3%B3n_de_un_plan_de_desarrollo_profesional_en_Recursos_humanos
WORK METER (2014). Gestión del talento mediante el uso de herramientas tecnológicas. Retrieved on March 27th from: https://es.workmeter.com/blog/bid/339469/Gesti-n-del-talento-mediante-el-uso-de-herramientas-tecnol-gicas
Appendix A
Performance-potential survey Data of the evaluated employee:
Employee no. _______________ (assign a number to each evaluated employee)
Put an X next to the response that corresponds to the evaluated employee
Age <20
21-25 26-30 31-35 36-40 41-50 51-55 56-60 +60
Gender Male Female
Years in the company (approx.) Less than 1 year 1-5 years 6-12 years More than 10years
Read the following items on the survey carefully and mark the box with an X that most closely matches the person being analyzed.
Items Never Sometimes Normally Almostalways Always
1. Completes his/her tasks or objectives on time (daily, monthly, yearly, etc.).
2. Is concerned about correctly performing the functions of his/her position.
3. Is punctual in coming to work. 4. Is capable of suggesting solutions to problems in his/her job position, or other areas outside it.
5. Is interested in learning and continuing to receive training on a voluntary basis.
6. Suggests new ideas to improve how the job tasks are done.
7. Usually expresses the desire to retire or quit the company.
Appendix B
Once you have completed a survey for each employee being evaluated, place the number assigned to them in the box on the table below that best defines their potential (what they can and/or are willing to achieve) and their performance (currently).
Potential
High Medium Low
Low Medium High
Performance
Intangible Capital, 2020 (www.intangiblecapital.org)