1
A Preliminary Study on Learning Challenges in
Machine Learning-based Flight Delay Prediction
Ismail Babajide Mustapha, Siti Mariyam Shamsuddin & Shafaatunnur Hasan
UTM Big Data Centre,Universiti Teknologi Malaysia 81310 UTM Johor Bahru, Johor, Malaysia
Email: [email protected]
Submitted: 15/06/2018. Revised edition:26/06/2018. Accepted: 14/11/2018. Published online: 30/05/2019 DOI: https://doi.org/10.11113/ijic.v9n1.204
Abstract—Machine learning based flight delay prediction is
one of the numerous real-life application domains where the problem of imbalance in class distribution is reported to affect the performance of learning algorithms. However, the fact that learning algorithms have been reported to perform well on some class imbalance problems posits the possibility of other contributing factors. In this study, we visually explore air traffic data after dimensionality reduction with t-Distributed Stochastic Neighbour Embedding. Our initial findings suggest a high degree of overlapping between the delayed and on-time class instances which can be a greater problem for learning algorithms than class imbalance.
Keywords—Flight delay prediction, class imbalance, machine
learning, dimensionality reduction, class overlapping
I.INTRODUCTION
Air transportation has evolved over the years into an indispensable economic component of most nations of the world; facilitating speedy and increasingly affordable movement of goods and passengers to different parts of the world. Being a complex interaction of several important components, the airline industry is often faced with task of efficiently scheduling the available resources to avoid a common problem in air traveling; flight delays. A flight is considered delayed if it arrives or departs an airport later than its scheduled arrival or departure time respectively. Although the permissible threshold after which a flight deemed delayed vary by country’s air transport regulatory authorities, flights in the US are not classified delayed until a fifteen-minute threshold had elapsed after its scheduled arrival or departure time. Apart from the obvious discomfort
delays bring to air travellers, representative studies have shown that the economic implication of delays run into billions of dollars yearly [1, 2]. Hence, the increased research interest in innovative ways to tackle this problem.
One of the many approaches to mitigating flight delays that has witnessed increased research attention in recent years is its prediction with Machine Learning (ML)-based methods [3, 4]. ML, a subfield of computer science at the intersection mathematics and statistics, has found application in many fields with proven record of ability to model large complex datasets and discover hidden patterns in them. While impressive reports abound in literature concerning ML-based flight delay prediction, the inherent rarity of delayed flights compared to the on-time ones exposes an agelong problem in ML; class imbalance [5]. For a hypothetical case of 2-class classification problem, class imbalance can be described as a disproportion in class distribution such that majority of the data instances belong to one of the classes leaving a few to the other. The problem becomes more interesting because in most application domains like flight delay prediction, the minority class is usually the class of interest.
2 other factors beyond class imbalance might have contributed to this problem. Motivated by these seemingly opposing yet interesting views, this research explores the flight delay data with a view to investigate the extent to which class imbalance affects learning performance, if any, or other possible factors in the way of optimal classifier performance in flight delay prediction.
In this preliminary work, we employ an exploratory approach in the analysis of the flight delay data; seeking to use visualization tools to explain the interaction between the delayed and on-time classes. To achieve this, the high dimensional flight data is reduced to smaller dimensions suitable for visualization using t-Distributed Stochastic Neighbour Embedding (t-SNE) [9], a method known to significantly preserve the structure of the original data in a low dimensional space. Our initial findings suggest that challenges in learning flight delay might have more to do with overlapping of class instances than imbalance in class distribution.
The organisation of this work is as follows; Section II gives a brief background on the class imbalance problem in flight delay prediction. In Section III, explanation of the employed methodologies of the research is provided. Section IV discusses the visualisation while a general discussion on the finding is done in Section V. The conclusion and future direction of the research is presented in Section VI.
II.CLASS IMBALANCE IN FLIGHT DELAY PREDICTION INTRODUCTION
Representative research in ML-based flight delay prediction have mostly resorted to addressing the class imbalance in the dataset to boost the sensitivity of the predictive model to the class of interest, delayed flights; mainly through data-level approaches such as oversampling and undersampling [10, 11] or by their combination [12, 13]. While some performance improvement might have been reported after balancing the class distribution in some works, we hypothesize here that class imbalance is not always the reason behind problem in model performance in flight delay prediction. Class balancing is merely carried out based on the general knowledge that imbalance in class distribution is a major hinderance to optimal classifier performance in ML [5]. Little or no investigative research has been done, to the best of our knowledge, to ascertain the true reason behind deterioration in learning imbalance flight data. Hence, a holistic view starting with the exploration of the dataset to explain interaction between the explanatory features, as against simply resolving class imbalance, we believe, is an important preliminary step to explaining possible factors behind deterioration in ML performance.
III.METHODOLOGY
A.Distributed Stochastic Neighbour Embedding (t-SNE)
t-SNE, a variant of Stochastic Neighbour Embedding [9], is a dimensionality reduction approach renowned for preserving, to a very great extent, the structure of a high dimensional data in a low dimensional space. In contrast to other dimensionality reduction approaches like Principal Component Analysis (PCA) [14] which linearly projects a high dimensional data to a lower dimensional space while maximising the variance, t-SNE aims to preserve the nearest neighbours of the original data by converting the Euclidean distance between each pair of data points into conditional
probability, given by Equation 1.
Where is the variance of the Gaussian that is centred
on data point .
Similarly, on the low dimensional map, is the conditional probability given by Equation (2).
The overall aim is an optimisation problem with the aim
of obtaining the minimum sum of difference between
and possible. t-SNE achieves this using a symmetric cost function while calculating pairwise similarity in the low dimensional space with a Student-t distribution in contrast a Gaussian used in the original SNE. The cost function C is as in Equation 3
B.Data Collection
The air traffic data of all domestic flight departures from Hartsfield–Jackson Atlanta International Airport (ATL) in the year 2017, extracted from the on-time performance database of Bureau of Transportation (BTS) [15], is used in this experiment. The data contains details of schedules and times of departures, origin/destination airports, air carriers, delay/diversion/cancellation information, flight information and so on.
(1)
(2)
3
C.Data Description
A description of the dataset which contains 110 features describing 364655flight departure operations from ATL in 2017 is given in pie chart Fig. 1. Over the period, about 17.7% of the total flights were delayed, amounting to more than 3.8 million minutes of departure delays. According to BTS, the causes of delay are broadly grouped into five categories namely; Air carrier, Weather, late arriving aircraft, National Aviation System (NAS) and security. The leading cause of departure delays at ATL in 2017 is due to air carrier as evident in Fig. 2. It can be observed from the figure that the total duration of delays in the first half of the year was higher in comparison to the second, where the total monthly delay duration appeared to reduce towards the end of the year.
Fig. 1. Percentage of all domestic departures in ATL, 2017
D.Data Pre-processing
Being a dataset with many redundant and irrelevant features to the flight delay prediction problem, data cleaning was carried out by removing features related to flight diversion, cancellations and other irrelevant or redundant features. The following features were selected from the original dataset inline with what has been used previously in flight delay prediction [13];
Month Day of month Day of week Quarter of year Carrier Flight Number Origin airport Destination airport Departure time Arrival time Distance
Departure delay. Set to 1 if a 14-minute threshold is exceeded after scheduled arrival time other it is 0
New features such as departure hour and minutes and arrival hour and minutes were constructed from the selected features (Arrival and departure time) to boost model performance. In addition, One-hot-encoding has been employed in the conversion of categorical variables after which each feature was scaled to a mean of zero and standard deviation of 1 (i.e. Z-score normalization) to ovoid model dominance by some features. The resulting data from the pre-processing is a 186-feature dataset.
4
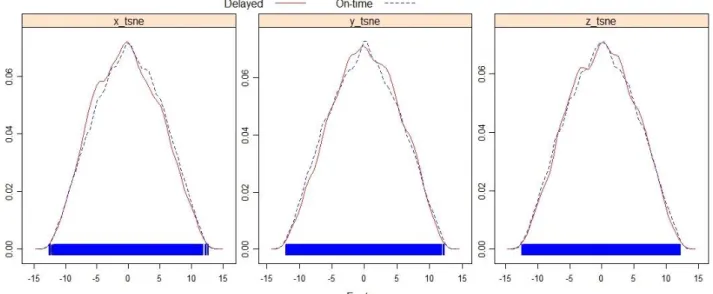
Fig. 3. Overlaid Class Density Plot of Reduced Data
E.Dimensionality Reduction
Since the aim of this work is to investigate other possible reasons that can hinder optimal prediction of flight delay through a comprehensive exploration of the data, we reduce the dimension of the output 186-feature dataset from the previous Section 3 dimensions using t-SNE to facilitate the visualization. The choice of t-SNE for dimensionality reduction is to ensure that the reduced data preserves reasonably the structure of the original data. The perplexity and learning rate parameters of t-SNE are set to 40 and 200 while the maximum number of iteration is set to 1000.
Fig. 4. 3-D (t-SNE) Scatter plot for Flight Delay Data
IV.DATA VISUALIZATION
The reduced dimension enabled us to visualise the whole dataset as density and 3-dimensional scatter plots; thereby
observing the interactions between the delayed and on-time classes in the dataset and therefrom infer possible impact on learning process. The number of plotted samples were varied to allow a clear visualization and representative plot. Fig. 3 shows an overlaid density delayed and on-time class distribution for each feature of the transformed 3-dimensional dataset. It shows a uniformly distributed feature with superimposition of the two classes with roughly the same mean and standard deviation.
V.DISCUSSION
That each feature appears to be uniformly distributed is not surprising (as in Fig. 3) because t-SNE centres its dimensionality reduction around a t-distribution. However, the superimposition of each classes (on-time and delayed classes) in all the 3 dimensions calls for concern because this shows that there is no clear separation between the delayed and on-time classes across the features. Many reasons amongst which is that the available flight features are not rich enough to separate the delayed from the on-time classes. This possibility is further strengthened by Fig. 4 which depicts a 3-d scatter plot of the data. Generally, it can be observed that the clusters of on-time and delayed instances are superimposed on each other with very close centroids.
VI.CONCLUSION AND FUTURE DIRECTION
5 possible challenge in the way of optimal classifier performance.
To this best of our knowledge, no previous research in flight delay prediction domain has attempted an investigative study of this nature regarding factors behind sub optimal ML performance. Hence, a crucial initial finding which is by far inconclusive. Future works will feature stepwise evaluation of model performance before and after varying the distance between the delayed and on-time classes to ascertain which affect predictive performance in ML-based flight delay prediction, Class imbalance or overlapping
In addition, innovative ways to enrich available data will be explored; additional features like weather information of both destination and origin airport. Feature engineering is also an important approach to enrich the data such that the separation between the majority and minority can be widened.
REFERENCES
[1] Rupp, N. G. (2007). Further Investigations Into The Causes Of Flight Delays.
[2] Ball, M., et al. (2010). Total Delay Impact Study: A Comprehensive Assessment of the Costs and Impacts of Flight Delay in the United States.
[3] Sternberg, A., et al. (2017). A Review on Flight Delay Prediction. arXiv preprint arXiv:1703.06118.
[4] Zonglei, L., W. Jiandong, and Z. Guansheng. (2008). A New Method to Alarm Large Scale of Flights Delay Based on Machine Learning. Knowledge Acquisition and Modeling, 2008. KAM'08.
[5] L'Heureux, A., et al. (2017). Machine Learning with Big Data: Challenges and Approaches. IEEE Access.
[6] Krawczyk, B. (2016). Learning From Imbalanced Data: Open Challenges and Future Directions. Progress in Artificial Intelligence, 5(4), 221-232.
[7] Denil, M. and T. Trappenberg. (2010). Overlap Versus Imbalance, Canadian Conference on Artificial Intelligence. Springer.
[8] López, V., et al. (2013). An Insight Into Classification with Imbalanced Data: Empirical Results and Current Trends On Using Data Intrinsic Characteristics. Information Sciences, 250, 113-141.
[9] Maaten, L.v.d. and G. Hinton. (2008). Visualizing data using t-SNE. Journal of Machine Learning Research, 9(Nov), 2579-2605.
[10] Rebollo, J. J. and H. Balakrishnan. (2014). Characterization and Prediction of Air Traffic Delays. Transportation Research Part C: Emerging Technologies, 44, 231-241.
[11] Belcastro, L., et al. (2016). Using Scalable Data Mining for Predicting Flight Delays. ACM Transactions on Intelligent Systems and Technology (TIST), 8(1), 5.
[12] Thiagarajan, B., et al. (2017). A Machine Learning Approach for Prediction of On-Time Performance of Flights. Digital Avionics Systems Conference (DASC), 2017 IEEE/AIAA 36th. IEEE.
[13] Choi, S., et al. (2016). Prediction of Weather-induced Airline Delays Based on Machine Learning Algorithms. Digital Avionics Systems Conference (DASC), 2016 IEEE/AIAA 35th. IEEE.
[14] Bro, R. and A. K. Smilde. (2014). Principal Component Analysis. Analytical Methods, 6(9), 2812-2831.