Stable URL: https://arcc-journal.org/index.php/arccjournal/article/view/582 10.17831/enq:arcc.v16i1.582
Corresponding Author: [email protected]
2019
volume 16 | issue 2 SPECIAL EDITION:
URBAN DATA ASSEMBLAGE
Data, Data Everywhere, Not a Lot in Sync:
Reconciling Visual Meaning with Data
Pieter Marthinus de Kock
Abstract
This study approaches two sets of questions. Firstly, what is visual data; how is it converted into useful information; and where should we look for it? Secondly, is data causing a mismatch between mind and environment? Data has emerged as our modern zeitgeist. Up to 100 billion devices will be seeking to visually map out our existence over the internet by 2020 (UK Government Chief Scientific Adviser 2014). Information provides meaning to human and non-human data in two ways. One way is in how non-humans convert data into information to understand inanimate objects. But inanimate objects also convert data. Humans now also exist as inanimate constructs; as data points. Both as prey and predator. The second way is in how humans and inanimate objects are both virtual actants: humans as subconscious beings; and inanimate objects as digital constructs. These similarities highlight the allure of data to the individual and vice-versa. Meaning drives us to “discover where the real power lies” (Appleyard 1979, 146) and the power that data possesses appears to be problematic as it is perceived to increasingly blur life’s boundaries. This paper is theoretical; and empirical examples are intended only to illustrate a philosophically driven point highlighting how, to be visually sustainable, our world depends on data. It suggests that data is an unseen and unspent force struggling to meaningfully sync with our visual world. It is centred on the premise that philosophy, not technology underpins visual sustainability. Lastly, it adds to the conversation by exploring three conceptual studies around past, present, and future states of data production; and introducing three new categories: data we get from data; data produced from objects; and how objects can now be produced from data. And what this all might mean for how we are sustained by our visual world.
Keywords: fractals, assemblage, visual, meaning, data, sustainability
INTRODUCTION AND KEY CONCEPTS
There is this idea that the urban is a forcefield “of spatial transformations” (Brenner 2014). And because the urban is made up of data, it is highly relevant to any discussion about visual meaning. Yet we don’t seem to discuss the concept of visual data
2011). Yet despite these increasingly opaque layers that define us, it can be argued that the artifacts we make are becoming simpler and more mundane. This is reflected in attitudes like “About me, I make stuff” (blogger quoted in Stafford 2017, 00:27:00). Have artifacts that we imbue with information just become ‘stuff’ to us? It can be argued that there does appear to be a sense of deterritorialization of meaning in the objects that we have surrounded ourselves with. So, if we are the information, and the information is us, and because we “trade largely in data” (Sharr 2007, 2), then it may be argued that there is a discrepancy between our complicated existence and what our artifacts look like and mean to us. Something seems to be out of sync.
It follows then in the argument that objects that lack meaning are simply made up of data that has not been fully understood yet. Even though visual data is the most immediately understood and accessible of all data; and even if we are aware of how we consume this data.
In order then to understand a little more about our relationship with data we can turn to the construct of a conceptual metaphor. Ortman suggests that “conceptual metaphors are the building blocks of human systems” (2012). This idea is backed up in theory by Baudelaire who writes of how “comparisons, metaphors, and epithets are drawn from the inexhaustible store of universal analogy” (Williams 2010, 281). It can be said that a folder of data; “a store of images and signs” exists by analogy (Raymond 1970:11, cited in Williams 2010, 281); like passing “through forests of symbols [which] observe with familiar eyes” (Fowlie 1992: 27, cited in Williams, R. (2010, 282). In a manner of speaking the data watches us, while we watch it but don’t see it.
Meaning has also arguably become analogous to software. Data locates us in the environment much like IP addresses locate us in cyberspace; contextualising human understanding and reinforcing the conditions for meaning to grow. We thus appear to be located through our meaning: that which we project or have projected upon us. We are used to synchronising data, existing through our location and produced in and by our location. Increasingly we co-exist as digital residents, independent of location but ‘identity-dependent’. Data can even be said to represent a coarse-graining of our physical existence.
Culture and metaphor exist fundamentally through human cooperation, collective intentionality, and status functions (Searle 2011) “as shared mental models” (Ortman 2012, 00:10:20). These constructs remain highly relevant to the sustainability of visual meaning; accessed and shared as they are over many generations.
The first conceptual study we will look at draws on Ortman’s findings and asks the question: how would someone from the future who stumbles across artefacts from our civilisation react? What conceptual metaphors would they draw on to explain our existence? In the second conceptual study, the focus then shifts to the present; to the phenomenon of how production of visual data is occurring in real-time, whether we are aware of these processes or not. How technology may help us extract the meaning from data in the built environment in a manner that is visually sustainable. In this case, the human eye was used with a digital camera as a simple method compared to, for example, biometrics. The third conceptual study in this paper explores how data can produce the future; the production of objects; and how this may impact visual meaning.
Before moving on the three conceptual studies, it would be beneficial to look at the relationship between the following three theories: direct perception, fractals, and assemblage.
Direct perception
Gibson’s theory of direct perception and affordance is based on the claim that: “There is only one kind of perception, the perception of the world with the meanings and values already in it” (Gibson 1975, 320). He holds that perception is not based on sensations but on information. And as we know, information is based on data. This “data-driven processing… begins with the stimulus itself” (McLeod 2008, emphasis added) and contrasts with the traditional theory of perception by Gregory et al. of sense data (McLeod 2008) or low-resolution images that need to be processed in our brain first.
Fractal-like properties
that we like to look at information made from data which is similar to the visual information found in nature. And this is most visually evident in the built environment through fractal-like architecture. Winter describes the bridging effect of fractal-like information. When the context is so rich that a few missing words makes no difference because they can be easily replaced through a process of context-dependency (2015, 00:17:40). Fractal content in the built environment it can be argued works in the same way. We can bridge missing information, close sentences, add punctuation marks, because of the richness of meaning. It is about embedding and nesting (Winter 2015, 00:20:00) that “Fractality equals Embeddability, [which] equals (Non-Destructive) Compressibility… [which] equals Sustainability” (Winter 2015, 01:54:00).
Assemblage
De Landa’s assemblage consists of the following conditions (De Landa 2012, 00:26:00, 00:49:00):
A whole that has properties of its own, non-reducible to the parts (2012, 00:49:00).
The parts are maintaining their autonomy, they exercise some specific capacities when they interact with one another but could be detached from the assemblage (2012, 00:49:00).
Assemblage has been used in various ways to generate urban data (Wang 2017, 3; Wachsmuth, Madden, and Brenner 2011; McCann, Roy, and Ward 2013); from extended urbanisation theory (Brenner 2018) to the “exploration of the worlding and assembling of cities” (McCann, Roy, and Ward 2013, 586). De Landa defines assemblage through the domain of social ontology and exteriority, that the parts do not alter one another (2012).
To properly apply the concept of assemblage to real cases we need to include, in addition to persons, the material and symbolic artifacts that compose communities and organisations: the architecture of the buildings that house them… the many symbols and icons with which they express their identity” (De Landa 2016, 12).
These concepts have been united with urban theory (Farias and Bender 2010; McFarlane 2009, 2011). MacFarlane in particular proposes assemblage as an alternative to the concept of networks (2009).
The way these three key concepts are related and interdependent can be summarised as follows: the objects we look at exist. They are not low-resolution data acted out on a stage in our brain in some form of synthetic post-production. And these objects are comprised of assemblages of fractal-like elements, or fractal-like networks of assemblages (FnA).
Related concepts
While a detailed analysis of many related concepts is beyond the scope of this paper, a brief summary of some important ones will help contextualise the working hypothesis that attempts to reconcile visual meaning (including both latent and captured data) with the passage of time (past, real-time or present, and future). Aesthetics (aesthetics and Aesthetics) has two meanings. In this paper, aesthetics refers not to the cold evaluations (Makin 2018, 191) or lower case derivative, but to the emergent beauty, often referred to as “a ‘hot’ emotional reaction” (Makin 2018, 190); that cannot be reproduced in a laboratory; similar to “speculative aesthetics… hermeneutic, phenomenological, existential and political approaches” (Lang DC 21: 275, cited in Cuthbert 2017, 174). Aesthetic experience is “fundamentally about hot emotional reactions to wholes, [while] empirical aesthetics is stuck measuring cold evaluation of parts” (Makin 2018, 208).
but differs by encompassing “the ultimate values, with goodness, truth, and justice” (Sartwell 2017, 1– 4).Lastly, visual sustainability (VS) can be described as the process by which people are sustained and enriched in daily life through the visual relationship they hold dear to their surroundings (De Kock 2019).
RECONCILING VISUAL MEANING WITH DATA What then in our built environment sustains and enriches us through the visual relationship we hold dear? In our surroundings, it is argued that we perceive objects from data while simultaneously being exposed to data from an object. This paper presents three ways of this two-way data generation:
1. Traditional data: data excavated from the past; ‘data from the data’.
2. Real-time data: data that we harvest in the present; ‘data from the object’, and
3. Future data: data that we create; ‘object from the data’.
Figure 1. Iterative process of data production (Author, 2019).
Conceptual study 1: Traditional data: data from data, conceptual metaphors
Ortman refers to archaeological records of ancient worlds that show how culture and metaphor sustained life through a form of procedural existence yet is often treated as a “residual category” (2012, 00:08:30). Ortman’s description of the concept of metaphorical coherence (2012, 00:13:15) is relevant to this study of visual meaning through story-telling from the past; in how images told us about how we acted and what we said. Stafford refers to “the inferencing leaps of analogy… analogy was an intimate and scalable way people extended their senses and sensibility outward. It was a way of getting from here to there, whether the there was a landscape or another human being… that provokes us to intuit visual narrative” (2012, 00:36:50).
This idea of scalability is reflected in both fractal theory and assemblage theory. It is also not divorced from Searle’s theory of scalability of status function declarations, which is linked to human cooperation and collective intentionality. Ortman refers to “the ways our brains manipulate conceptual imagery” (2011, 00:10:30) in the “use of the image-schematic structure of a concrete domain to conceptualise and reason about an abstract target domain” (2012, 00:13:30). He explains how the subconscious use of this language structure has made it difficult to quantify, but exists to this day in modern language as “semantic fossils” (2012, 00:15:00). This sustainability over time speaks to the concept of visual sustainability discussed earlier.
One such example (Figure 2) describes the process of how new words were derived from older meanings. The bowl/basket artefact from the Tewa culture of Mesa Verda, New Mexico, was layered with meaning to describe bowl-shaped geographical environments, villages, and belongings such as ‘earth baskets’ (na + t’ué), which continued into the modern-day as nat’ú to mean pottery; or that a pitched roof referred to a basket made of timber (Ortman 2012, 00:22:30). One can only speculate about the metaphorical significance of the relics of our lives and how they may one day be understood in (Figure 3).
Traditional (past)
real-time (present) hyper-real?
(future)
Conceptual study 2: Real-time data: data from objects, photo-walk exercise
The following photo-walk exercise does not intend to quantitatively prove anything. The intention is rather to discuss and explore ideas around visual meaning. We can start off by thinking of visual data as a continuous stream of information from a projector that is always running: as long as our eyes are open – even if we’re not paying attention (Searle 2016, 1:45:00). While modern-day biometrics, using
eye-tracking, can generate copious amounts of data, simpler and less costly methods also exist for evaluating visual perception. The challenge lies in measuring information, extraction, and comparison. One method of measurement is through fractal dimensions, which tells us more about the scale-free properties of the objects that we prefer to look at. The following example illustrates how this low-cost alternative seeks to adhere to the maxim that
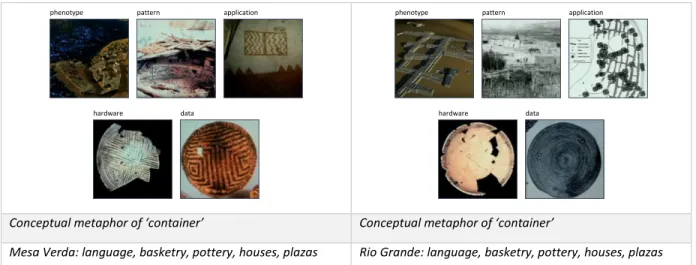
Conceptual metaphor of ‘container’ Conceptual metaphor of ‘container’
Mesa Verda: language, basketry, pottery, houses, plazas Rio Grande: language, basketry, pottery, houses, plazas
DATA FROM OBJECTS c.2000 AD, looking back at c.600-1280 AD
Two ‘cities’, same tribe: Tewa culture: relocation from Mesa Verde to Rio Grande
Figure 2. Traditional data (Ortman 2011, 2012)
DATA FROM OBJECTS c.3000 AD, looking back at c.2000 AD
Two cities, same tribe: a hypothesis of how we in the future may map artefacts of two cities in the built environment from c. 2000, by way of conceptual metaphor.
Figure 3. Mapping assemblages; phenotypes of meaning (needpix.com: Creative Commons Zero License for Public Domain)
phenotype pattern application
hardware data
phenotype pattern application
hardware data
phenotype pattern application
hardware data
phenotype pattern application
‘everything should be as simple as possible but no simpler’.
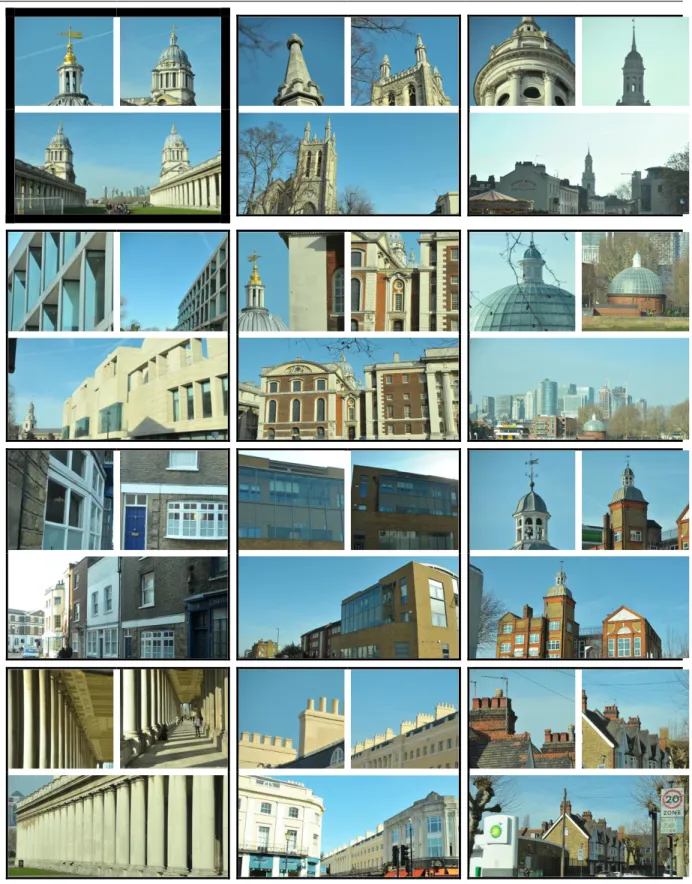
It closely ties in with the phenomenon of assemblage and information/data. A volunteer with no formal training in the built environment was chosen as an observer. The person was given a camera and asked to walk the length of a street in London. The designated area included immediate side streets. This person was asked to take photographs of artefacts that provided ‘the most meaning’. At the end of the walk, the observer was asked to select from the range of photographs taken, the one single artefact that was ‘most meaningful’ to them.
The volunteer was asked to not try to second-guess the motives behind the experiment. The volunteer was told that the designated area was not important; and that the artefact as well as the meaning itself was not important to the experiment. The volunteer was also advised that categories of architectural style or age of artefact had no bearing on the outcome.
The route selected consisted of a streetscape of varied information, comprising a good mix of ‘data’ ranging in building typologies, sizes, styles, and age. Instructions were that the artefacts chosen to be photographed should be an urban structure; from ornament, to façade, to collections of ‘things’; but that three photographs of each artefact were to be taken as follows:
1. The meaningful part
2. The whole assemblage that produced meaning (for the observer), and
3. The whole in its context; the assemblage within other assemblages.
The resulting images were compiled into sets. The set of three pictures taken with the most meaning for the volunteer is highlighted below. Again, the meaning for the observer was of no consequence to the experiment; only that the final selection represented an artefact with the most meaning for that volunteer.
What was important in analysing the results was to extract the chosen assemblage and the data that the assemblage represented. Peterson refers to how we aim at what we want: “We never think of the world as something that reveals itself through our values, but of course it does, because you look at what you want. You aim at what you want” (Jordan B Peterson 2017, 1:08:15, emphasis added). In this case, the
volunteer/observer was left to aim at what they wanted: to consume visual meaning, without any expectation of how they did so (apart from the selected route). All that was required was to achieve a level of visual specificity.
A box counting method was used (Figure 5) using Netlogo software to discover the presence of statistical fractals (discussed earlier) or what one might term, the ‘fractal-like status’ of data in the selected visual image. The more fractal-like the data, the more self-similarity the image exhibited by way of power law behaviour; thus, implying some form of correlation with the visually pleasing phenomenon of objects in nature.
Before continuing on to the results, mention should be made of essentially two kinds of fractals that exist: statistical fractals (as randomly constructed); and exact fractals (exact repetitions at different magnifications). These “two families are not visually identical” (Bies et al. 2016, 1). Statistical fractals have been studied to ascertain how aesthetic judgments [of statistical fractals] are a function of the viewer’s processing fluency; that is, the quicker and more efficient the processing of the stimulus, the more positive the aesthetic judgment (Reber et al., 2004, cited in Spehar et al. 2015, 2).
The most important consideration for this study is that fractal dimensions offer a consistent method by which to categorise visual phenomenon. This study is only concerned with fractal-like structures of our physical world, also known as statistical fractals; in which data can be seen, contextualised, and compared. Visually, “mounting evidence leads to the conclusion that there is a ‘universal’ preference for statistical fractals that have moderately low dimensionality” (Bies et al. 2016, 2,13).
The results outline some general observations and fractal dimension calculations (Figure 5) and revealed the following about how this observer interacted with the ‘visual forcefield’ on that particular day:
“rhythmic repetition of architectural motifs… and the counterpoint these motifs create with the surrounding landscape” (Kostoff, The City Shaped, 284-285, cited in De Landa 2016, 34). Cullen refers to how the “value of incident in a street – tower, belfry, silhouette feature… is to entrap the eye so that it does not slide out into the beyond with resulting boredom” (Cullen 1995, 45).
2. The linear regression results from the box-counting analysis (Figure 5) strongly resembles power law behaviour in structures that favour self-similar fractal-like geometry. That a data set is a power law indicates there is scaling and pattern in the urban; and that these are approximate in terms of urban scaling (Feldman 2019b).
3. Even if we don’t recognise or identify what we perceive as data, the amount of information available in fractal-like network of assemblages (FnA) in the built environment around us appear to act as a powerful forcefield, possibly influencing our behaviour.
4. The results of a fractal analysis (Figure 5) of the most meaningful assemblage in the network of assemblages (nA) ranged between 1.42 and 1.6. This reveals a correlation with other studies (Bies et al. 2016, 13): that low to moderate D fractals are most preferred. It also correlates with scenes which we admire so much in nature, of results between 1.3 and 1.5 (Ellard 2015, 39). In fact, it has been shown through various studies that
people prefer to look at images that have approximately the same range of fractal dimension as that found in nature. This correspondence between the fractal properties of images and our preference for them, and even in some cases our physiological responses to such images, which can resemble the restorative response to natural scenes, has given rise to the idea that the way the brain actually recognizes nature is by means of this mathematical property. (Ellard 2015, 39)
5. There appears to be a strong correlation with De Landa’s concept of territorialisation. The elements picked out by the volunteer/ observer resemble assemblages (A) that are
distinct, with sharply defined boundaries. This phenomenon highlights the concept in this paper of an emergent property of visual meaning (EPm).
6. There appeared to be a strong correlation in subject choice between what the observer understood by meaning (m), and visual richness (VR).
7. There appeared to be some correlation between meaning and older artefacts, which have endured over time (t).
8. There also appears to be an appreciation in the photographs of relational meaning by way of a “visible growth of a concept”; that “what we most want to know … [is] the constructive configuration of some communicable and mattering thing” (Charles Peirce, quoted in Stafford 2017, 00:49:30).
9. It may be suggested that a concept such as visual sustainability (VS) exists; that visual meaning (M) is transported by time (t) over generations, and by implication often over civilisations.
Conceptual study 3: Future data: objects from data, and hyper-reality
Today the arts and sciences have been overrun by information technology but “what are the consequences when we sever action from reflection, when we make what we can no longer describe?” (Stafford 2017, 00:17:00). The narrative from science fiction was always that while “computers started to act like people… people had started to act like computers” (Reiss and Carr 2007) but technology has also changed the way we create, what Heidegger refers to as, ‘things’ (Sharr 2007, 23–35). ‘Things’ that can be said to be objects possessing meaning. Heidegger may well have imagined the world as an Internet of things (IoT) but today the self-fulfilling prophecy is as clear as at any time in the past; such that we find ourselves
It is possible to understand how we may present the
perfect prey in a predatory technological landscape; through data collection and assemblage. We are, one could say, the new objects created from data through
the proliferation of autopoietic devices and mobile medium… tailored… to individual neural functions… with our brains endlessly self-configuring and inward zooming remote control… that’s going to get rid of attention totally (Stafford 2014b, 00:55:30).
Sensors related to visual meaning in buildings and products are changing our perception of the urban and look set to accelerate with the roll out of 5G networks (Mills 2016). Our complex world is becoming simpler yet more complicated; it seems to hide more. The complication arises from how well
disguised the products we consume have become (Norman 2011, 00:27:00, 2014); we struggle to understand the meaning behind many of the actants around us.
Technology has long mediated our physical spaces and our creative thoughts. Collapsible paint tube technology ushered in impressionism (David Hockney - The Art of Seeing 2018, 00:29:20). Hockney himself paints with an iPad and makes use of technology to draw “not just in space [but also] in time” (David Hockney - The Art of Seeing 2018, 00:53:30). In his digital artworks (Hockney 2019) the observer is free to look wherever they wished to; yet at the same time is forced to scan the artefact, calling on primordial instincts of survival. New objects emerge from the data being presented by an artefact, even if only virtual.
The production of new objects from data however goes further. Baudrillard questions how meaning is reduced as information increases, declaring “an implosion of meaning. This is where simulation begins.” (1983, 57) Research continues to seek out to replicate what comes naturally to humans: our innate ability at resolving low-level visual processing with high-level cognition when processing scenes and images in our environment (Koch et al. 2016; Itti and Koch 2001; Mitchell 2012, et al.).
The ‘opportunity gap’ for AI lies in the difference between specificity of image and invariance (Mitchell 2012). For data-driven simulation and object recognition in the built environment this difference is fundamental to the problem posed in this paper: of visual data being everywhere, but with not a lot of it in sync.
Historical significance is traditionally captured by concepts related to visual meaning, such as Ortman’s use of analogy. That this can exercise the mind and keep the mind hooked in with the environment; as it arguably should be. These methods will it seems be overwhelmed by rapid advancements in AI through deep learning and instruments such as Google’s Deep Mind. There is a “profound difference between the language and the metaphors of automaticity which come out of cybernetics and the metaphors… that come out of spontaneity… which belongs to biology and the imagination” (Stafford 2014a, 00:22:30). Cybernetics encapsulates “the science of control or prediction of future action” (Stafford 2014a, 00:27:50) and the range of applications related to
automaticity is breath-taking. These range from 3D pixels (voxels) generating objects straight from data sets bypassing 3D computer models (Warren 2018); producing 3D models produced from 2d data (Boulkenafed, Michel, and Sfar 2019); fractal dimension calculations using the box-counting method in medicine (Safitri and Juniati 2017); interpreting 3D objects from 2D scenes (Rezende et al. 2016); and simulation in virtual worlds (Johnson-Roberson et al. 2016). Urban design can be produced in a top-down process independently of emergence or the conditions for assemblage (Matzner 2019; ‘DeCodingSpaces Toolbox | Computational Analysis and Generation of STREET NETWORKS, PLOTS and BUILDINGS’ 2019).
Another likely scenario where objects will be produced and data shared that relates at the level of the individual is in embodied technology (Duin et al. 2018) through “intention detecting processes” (Stafford 2014a, 00:28:10), where the individual effectively becomes another rhizome-like data point;
another manoeuvrable actant in the built environment. This, combined with crowdsourced data, the most recent example of which is CommonSpace by Sidewalk Labs (Pandey 2019), offers a multiplicity of uses from design to the production of objects. These ”profound shifts in how we think and see” (Stafford 2017, 00:08:20), these advancements in data collection of human interactivity and connectivity, should serve society well by way of improved urban design and the public realm.
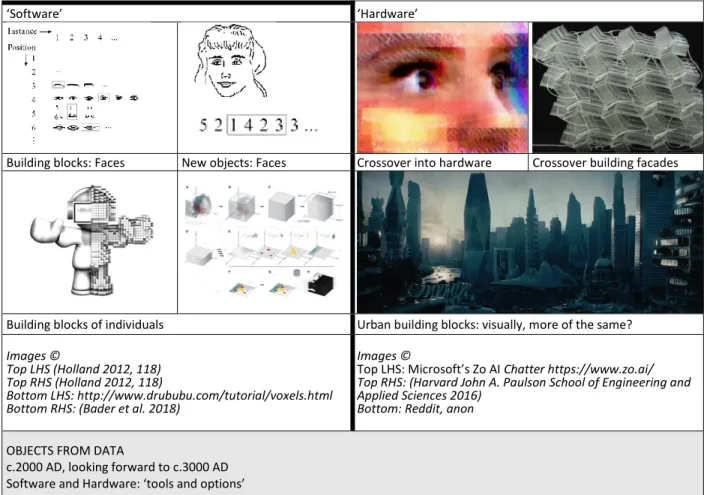
Over ten years ago, Holland’s example of building blocks (2008, 00:41:00, 00:44:50) spoke directly to the concept of visual sustainability. Since “there is no person in that next generation that is a copy of any person in the previous generation… what information is being preserved from one generation to the next if there's no copies?” (Holland 2008, 00:46:50). Holland claims the answer lies in the building blocks; of recombining what has been inherited from the previous generation, in a way that preserves the
‘Software’ ‘Hardware’
Building blocks: Faces New objects: Faces Crossover into hardware Crossover building facades
Building blocks of individuals Urban building blocks: visually, more of the same?
Images ©
Top LHS (Holland 2012, 118) Top RHS (Holland 2012, 118)
Bottom LHS: http://www.drububu.com/tutorial/voxels.html Bottom RHS: (Bader et al. 2018)
Images ©
Top LHS: Microsoft’s Zo AI Chatter https://www.zo.ai/ Top RHS: (Harvard John A. Paulson School of Engineering and Applied Sciences 2016)
Bottom: Reddit, anon
OBJECTS FROM DATA
c.2000 AD, looking forward to c.3000 AD Software and Hardware: ‘tools and options’
uniqueness of each person. In Holland’s argument, this paper asserts, lies the reconciliation of data with visual meaning.
The speed at which neural networks and deep learning affects our lives, is reflected in how face recognition technology has morphed into face creation, which itself shows signs of becoming outdated (Pavez et al. 2018; Bader et al. 2018). Technology has created conditions where structured and unstructured data sets become meaningful to the built environment; enabling artefacts to be created from data; ”enabling the physical visualization of almost any type of data set” (Bader et al. 2018, 11).
Holland’s intriguing line of research has, perhaps unintentionally, reflected many of the existential concerns by earlier theorists such as Lefebvre and Baudrillard et al.; of ‘mirrors’, ‘questioning what we now see’, and ‘fake becoming the new real’. The potential for shapeshifting in the urban is real. It is no longer a fantasy to imagine how visual data, meaning, and sense of place of urban nodes may be instantaneously completely altered in the future through technologies such as building membrane technologies. What then, looking back a thousand years from now, will people say about us?
That architecture can now be practised without constructing a physical building, but buildings from data in the digital (Ahrens and Sprecher 2019), is arguably one step removed from creating physical buildings solely from data. There is a clear focus on the affordance of creating objects from the data. By using technology and learning from data, not only what an object looks like but where you’re likely to find relational meaning (Mitchell 2012), the science of object creation and manipulation has been unleashed on society. Instead of a backward-looking analysis therefore, future-looking technology intends to be able to predict and accurately create visual language. This is how data may be used to produce visual content. Whether this is visually sustainable or not remains to be seen.
DISCUSSION
The main aim of this paper has been focused on understanding the philosophy behind the visual relationship we have with data. Clearly, fractals play an important role as does assemblage theory in networks and complex adaptive systems; typically through non-linear states of multiple interactions,
preferential attachment behaviour, and high levels of unpredictability (Mitchell 2019). Fractal dimensions are important for their role in analysing self-similarity in objects as well as indicative of scaling behaviour – of the visual experience of scaling up or down, or of how parts of the whole are self-similar at any scale of observation (Feldman 2019a). This leads to the idea of how self-similarity may play a role in assemblage; and how these together may help reconcile visual meaning with data at the level of the individual. While fractals and fractal-like objects themselves exhibit linear power law behaviour, they exist in complex systems such as the world wide web which itself is fractal (Mitchell 2019). Their self-similar qualities produce arguably the most attractive, most sustainable architecture in the built environment. Their allure lies in analogy, sequences, and relationship-building qualities; not in sense-data manipulations from sensationalised visual representations of futuristic fractal environments; or in “optical media and their targeting of particular regions of the brain” (Stafford 2017, 00:11:00). Fractals are important for Mandelbrot’s theory of roughness, used in science to better describe the natural world in the same way that smooth Euclidean geometry perfectly describes the mathematical world (Feldman 2019b). What does this have to do with data? The answer lies precisely in the roughness we are attracted to; reified in data that is produced by fractal-like objects around us in the built environment. Data, it appears, is everywhere; naturally occurring but still raw, and not a lot in sync due to the limitations of technology.
For the purposes of this discussion, a working hypothesis of visual sustainability can be offered in the following four points. Firstly, it can be suggested that the building blocks of visual sustainability appear to follow a linear process of emergent properties V1 to V3, containing some of the following relationships:
Emergent property V1 = The existence of an image with a corresponding emotion, and the presence of aesthetics.
Emergent property V2 = The existence of aesthetics with associated visual richness, and the presence of meaning.
Emergent property V3 = The existence of visual meaning and the presence of sustainability.
entropy” (Mitchell 2018, 00:09:50), then t = (constant)* entropy. For visual sustainability to exist, assemblage is predicated on a declaration of the existence of a relationship between two variables, meaning and visual richness, with a third, time.
Thirdly, De Landa considers both quantitative and qualitative distinctions relevant to data collection as long as the distinctions between settings are clearly different; at the critical points when the changes in parameters occur (2012, 00:53:00). For a hypothesis to survey the incoming and outgoing data from an emergent property, specific control points must be identified to establish ‘gradations’ of meaning in data. These ‘timestamps’ will help monitor changes in conditions for each variable. The adjustable parameters and settings or lever points would consist of visual richness (low to high); meaning (low to high), and time (time-agnostic, to time-dependent, to not time-dependent). Objects to be surveyed may include typologies, whole buildings, or whole elements such as doors, windows, or any other distinctive recurring features.
The objection that, most likely, will most often be encountered will be how changes in meaning and visual richness, or beauty are able to be identified. Perhaps through cause and effect, by changing one parameter to affect another and inducing the change. However, because of the nature of complex adaptive systems, evidence is more likely to appear in the form of perturbative causality due to the unpredictable non-linear nature of the process (Raine 2012, 00:02:45). Raine refers to tipping points as “perturbative causality, that is to say, how small changes in causes have produced… large changes in effects” (2012, 00:03:00) where you have “enough agents interacting in a diverse number of ways and… these emergent properties emerge” (2012, 00:37:40).
Fourthly, a working model based on De Landa’s analysis can be suggested with three combinations of qualitative settings available, as follows:
• [high visual richness + high meaning] + not time dependent: then that would mean a visually sustainable urban assemblage exists. Note: the definition of high visual richness does not necessarily mean high levels of detail.
• [high visual richness + low meaning parameters] + time dependent: the implication being that an aesthetic urban
assemblage exists; however, meaning does not change significantly over time.
• [low visual richness + low meaning parameters] + time agnostic: the lowest form of condition, objects exists simply in a functional urban assemblage; that may be described as “just a collection of [unrelated] things” (De Landa 2012, 00:11:40), and which are not time sensitive.
Based on the four points outlined above, this discussion is leading to an argument that data in visual sustainability emerges over time through the emergent properties of visual richness (fractal-like data) and meaning; acting together in an assemblage that is visually sustainable, that is transported into the future. Emergent properties defined then as properties
of a whole that arises from the constant interactions between its parts. The parts must interact, and in those interactions, they must exercise inherent capacities that they have. In the case of an assemblage those capacities must be exercised; they must be actual because without those interactions and those capacities being exercised, the emergent properties would disappear (De Landa 2012, 00:22:00).
These properties “do not exist in the parts, but nevertheless immanent to the parts… they need some or other interaction to be occurring and that’s what makes them immanent” (De Landa 2012, 00:22:00).
In the following suggested hypothesis then, the interaction required for data to be visually sustainable is time. Visual richness (VR) and meaning (M) must exist in constant interaction over time (t); as parts to the whole assemblage. This then produces the emergent property of visual meaning (EPm). Thus, ((VR + M) * t) = EPm.
A network of assemblage nA, if it endures over time may be called visual sustainability VS.
In the case of fractal networks of assemblages, FnA = nA (network assemblages) = sA (sum of assemblages) = ( (VR + m) + (VR1 + m1)...)*t
In the above scenario, actants transform assemblages, assemblages transform actants, and so the fractal grows. Networks of meaning appear and disappear through the phenomenon of what De Landa refers to as territorialisation, de-territorialisation, and re-territorialisation. The production of sustainability occurs by way of change over time, producing new meaning. When meaning is no longer sustainable, then that assemblage no longer exists. The network nA will progressively weaken and resemble De Landa’s stratum condition, a state of fully homogenised uniformity.
In closing this discussion, we can consider a number of threats presented by data. Firstly, that we stop paying attention. In all three categories of data production (data we get from data; data produced from objects; and objects produced from data) one may argue, as Stafford does, that “a diminishment of the prefrontal cortex, precisely that ten percent of, if you will, the brain ‘bandwave’ that is devoted to deliberative action, to attention… precisely the moments when you are aware you are aware” (2017, 00:12:50) will inevitably lead to “ineffability’s dark side” (2017, 00:14:00).
With the increasing scientisation and technologization of art, the aestheticization of science and technology, [as] a mirrored phenomenon, do these diverse fields not only inherit each other’s undoubted wonders but also their ethical ambiguities, their often dubious experimentation, the indifference to social impact… the darkening of comprehension evident in being unable to name, either before or after, why something is being made and what in point of fact it is… precisely the problem of creation unbound… our move into a haunted period where representational opacity descends (2017, 00:12:00).
Another threat lies in how meaning has changed as visual data has become monetised, representing major threat to the durability of visual meaning, for “… has anyone seen a factory run entirely by robots that does not produce any profits? Of course not” (De Landa 2016, 44). Using technology like Hadoop, algorithms can be run off stored data to produce new visual products and services. But does this sync data, or does it fracture data even more? Data is the new currency with a new marketplace (Eggers et al. 2013); with “human beings as calculative subjects and calculable objects” (Schillmeier, M. (2010) ‘Assembling money and the senses’, in Farias and
Bender 2010, 243). Baudrillard alluded to exploding data causing an implosion of meaning; where simply of too much uncontrolled data without meaning, and out of sync with humanity.
A third major threat is in how the individual stands at a threshold of new urban significance as both predator and prey. “Personal data has an economic value that can be bought, sold, and traded” (Eggers et al. 2013). The consequences of the rising economic value of visual data is profound for our built environment; in the way visual data is produced, processed and shared.
How do we deal with these threats? Objects that attract us produce data in us. What does that data tell us about ourselves? Emergence in objects produces different data by way of the relationship between interacting parts. These emergent properties are what differentiates architecture from general construction. The secret to good, enduring architecture, it can be argued, lies in putting together many assemblages of simple objects that together produce powerful emergent properties. The resulting artefacts will be a pleasing mix that mimics the roughness articulated by Mandelbrot (2010); that we all so admire in nature, our “storehouse of images” (Baudelaire, cited in Williams, R. (2010) ‘Second empire, second nature, secondary world’, in Farias and Bender 2010, 281).
Despite calls for a more qualitative approach: “Science remains the most powerful discourse in the quest for sustainability” (Owen and Dovey 2008, 12– 13). This is partly the reason for focusing on the philosophical importance of data and not any quantitative outcomes, because this trend must be reversed if an epistemic objectivity of ontologically subjective knowledge (Searle 2011, 2013; 2015; 2016) is to succeed in the domain of sustainability.
CONCLUSION
indispensable from their environment. Data is the basic building block of our world. One could argue that what we see (even if we don’t) is fundamentally data, or raw information. Because of our continuously changing environment we never see the same physical object in exactly the same way ever again. There is by implication, however nuanced, an infinite stream of data; continuously generating, flowing, and being manufactured.
Three methods in the production of data have been introduced as follows:
1. from the past: data from data
2. in real-time: data from objects
3. in the future: objects from data
A concept of visual sustainability emerges as the dominant theme from the reconciliation of visual meaning with data. Meaning cannot exist without data and vice-versa. Three other interesting themes have also emerged.
Firstly, as paradigms of understanding are unlocked, our relationship with data is being changed by technology. To better understand our built environment, we now need to better understand our artefacts; especially the latent data embedded within these artefacts.
Secondly, data can help reconcile visual meaning in ‘our’ objects. This study holds that while there may be a ‘sweet spot’ in meaning (Ellard 2015, 114), it is easy to become entrapped by an overload of meaning by way of “extreme memory” (Stafford 2014a, 00:26:18). In the photo-walk experiment, a conscious effort was made not to become entangled in ambiguity. The observer was encouraged to simply let the meaning be their meaning. The photo-walk experiment in all its simplicity also holds interesting possibilities at particularly community and neighbourhood levels; by building on connectivity. This can be achieved because meaning can be recorded, tracked and incentivised to produce self-census data and documented networks of meaning; responsive then to the individuals in the community. The promise is for profiles of depressed areas to be raised, and regeneration projects better aligned with residents’ interests.
Thirdly, as promulgated by Heidegger (Sharr 2007, 2– 3), for visual meaning to be reconciled with data, the individual must be present. The data contained within
an object can only survive through and be transferred by the individual through meaning. Without the most fundamental emergent property sustaining life, that of the interactions of individuals, the data is meaningless.
Ultimately then, future research needs to move beyond the theory to (as De Landa points out) solve real-world social problems (2012, 00:56:50). Further philosophical research into the role played by data in visual meaning and visual sustainability will also help overcome the quantitative bias in modern-day sustainability. Philosophy may even explain the false starts and show why, how, and where modern-day sustainability may be getting things wrong.
A basic working hypothesis for visual sustainability has been offered with the aim of encouraging research especially by well-funded organisations and practitioners of modern-day sustainability.
The working hypothesis is argued along the following lines: a linear spectrum of meaning exists that transforms bits of binary code into information and language; that when enriched becomes aesthetics and beauty; through which storytelling unfolds when pronounced with meaning and emotion. Enriched by our imagination we claim visual richness to exist; that then transforms into visual meaning; converting finally over time into visual sustainability.
The overarching result of this paper has highlighted how data production, in the context of the practice of modern-day sustainability, may be reconciled in the built environment with visual sustainability. It has been said that: “Nature builds by cell division towards continuity whilst man can only build by joining together into a unique structure without continuity” (Kiesler, F. (1939), cited in Ireland, T. (2017). ‘Leveraging nature to envision (functional) space’, in Cairns 2017, 208).
References
Ahrens, Chandler, and Aaron Sprecher, eds. 2019. Instabilities and Potentialities: Notes on the Nature of Knowledge in Digital Architecture. New York: Routledge. https://doi.org/10.4324/9780429506338
Appleyard, Donald. 1979. ‘The Environment as a Social Symbol: Within a Theory of Environmental Action and Perception’. Journal of the American Planning Association 45 (2): 143–53.
doi:10.1080/01944367908976952.
Bader, Christoph, Dominik Kolb, James C. Weaver, Sunanda Sharma, Ahmed Hosny, João Costa, and Neri Oxman. 2018. ‘Making Data Matter: Voxel Printing for the Digital Fabrication of Data across Scales and Domains’. Science Advances 4 (5): eaas8652. doi:10.1126/sciadv.aas8652.
Baudrillard, Jean. 1983. Simulations. Foreign Agents Series. New York City, N.Y., U.S.A: Semiotext(e), Inc.
Bies, Alexander J., Daryn R. Blanc-Goldhammer, Cooper R. Boydston, Richard P. Taylor, and Margaret E. Sereno. 2016. ‘Aesthetic Responses to Exact Fractals Driven by Physical Complexity’. Frontiers in Human Neuroscience 10 (May).
doi:10.3389/fnhum.2016.00210.
Boulkenafed, Malika, Fabrice Michel, and Rejeb Sfar. 2019. ‘(73) Assignee: DASSAULT SYSTEMES, Velizy Villacoublay (FR )’, 15.
Brenner, Neil. 2014. Neil Brenner : Urban Ideologies and the Critique of Neoliberal Urbanization.
https://www.youtube.com/watch?v=7wjLEdK0LP0&f eature=youtu.be.
———. 2018. ‘Debating Planetary Urbanization: For an Engaged Pluralism’. Environment and Planning D: Society and Space 36 (3): 570–90.
doi:10.1177/0263775818757510.
Cairns, Graham, ed. 2017. Visioning Technologies: The Architectures of Sight. London ; New York: Routledge, Taylor & Francis Group.
https://doi.org/10.4324/9781315548029
Chalmers, David J., Robert M. French, and Douglas R. Hofstadter. 1992. ‘High-Level Perception,
Representation, and Analogy: A Critique of Artificial Intelligence Methodology’. Journal of Experimental & Theoretical Artificial Intelligence 4 (3): 185–211. doi:10.1080/09528139208953747.
Cullen, Gordon. 1995. The Concise Townscape. Oxford ; Boston: Butterworth-Heinemann.
Cuthbert, Alexander. 2017. ‘Urban Decay and Regeneration: Context and Issues’. Journal of Urban Design 22 (2): 140–43.
doi:10.1080/13574809.2017.1288873.
David Hockney - The Art of Seeing. 2018. https://www.youtube.com/watch?v=Cdqch3-D94A&feature=youtu.be.
De Kock, Pieter M. 2019. ‘The Meaning in Seeing: Visual Sustainability in the Built Environment’. Edited by Ellyn Lester. AMPS Proceedings Series 16. Stevens Institute of Technology, New Jersey. 17 – 19 June.
De Landa, Manuel. 2009. Manuel De Landa. Dualities of Meaning in Gilles Deleuze. 2009 2/8.
https://www.youtube.com/watch?v=mOZ1sq_90N4.
———. 2011. Manuel DeLanda. Deleuze, Subjectivity, and Knowledge. 2011.
https://www.youtube.com/watch?v=rnoKUKax9sw& feature=youtu.be.
———. 2012. Manuel DeLanda. Assemblage Theory, Society, and Deleuze. 2011.
https://www.youtube.com/watch?v=J-I5e7ixw78&feature=youtu.be.
———. 2016. Assemblage Theory. Speculative Realism. Edinburgh: Edinburgh University Press.
‘DeCodingSpaces Toolbox | Computational Analysis and Generation of STREET NETWORKS, PLOTS and BUILDINGS’. 2019.
https://toolbox.decodingspaces.net/.
Duin, A. Hill, D. Willow, J. Abel, A. Doering, L. Dunne, and M. Isaka. 2018. ‘Exploring the Future of
Wearables and Embodied Computing: A Report on Interdisciplinary Collaboration’. In 2018 IEEE International Professional Communication Conference (ProComm), 47–50.
doi:10.1109/ProComm.2018.00018.
Eggers, William D, Rob Hamill, Abed Ali, and
Illustration John Hersey. 2013. ‘Government’s Role in Facilitating the Exchange’, 15.
Evans, James, and Phil Jones. 2008. ‘Rethinking Sustainable Urban Regeneration: Ambiguity, Creativity, and the Shared Territory’. Environment and Planning A 40 (6): 1416–34.
doi:10.1068/a39293.
Farias, Ignacio, and Thomas Bender, eds. 2010. Urban Assemblages: How Actor-Network Theory Changes Urban Studies. Questioning Cities. London ; New York: Routledge.
Feldman, David. 2019a. Fractals and Scaling: A Tour through the Dimensions.
https://www.youtube.com/watch?time_continue=4 84&v=eD53sleWt3E.
———. 2019b. Fractals and Scaling: Summary of Course. https://www.youtube.com/watch?v=-pynRkP-UfY.
Gibson, James J. 1975. ‘Pickford and the Failure of Experimental Esthetics’. Leonardo 8 (4): 319. doi:10.2307/1573011.
Harvard John A. Paulson School of Engineering and Applied Sciences. 2016. A 3-D Material That Folds, Bends and Shrinks on Its Own.
https://www.youtube.com/watch?time_continue=9 0&v=maKILHxcGAE.
Haun, Andrew M., Giulio Tononi, Christof Koch, and Naotsugu Tsuchiya. 2017. ‘Are We Underestimating the Richness of Visual Experience?’ Neuroscience of Consciousness 2017 (1). doi:10.1093/nc/niw023.
Hockney, David. 2019. ‘Digital Movies : Digital : Works | David Hockney’.
http://www.hockney.com/works/digital/movies.
Holland, John H. 2008. Modeling Complex Adaptive Systems.
https://www.youtube.com/watch?v=6aN6PlsvkpY&f eature=youtu.be.
Holland, John H. 2012. Signals and Boundaries: Building Blocks for Complex Adaptive Systems. Cambridge, Mass: MIT Press.
https://doi.org/10.7551/mitpress/9412.001.0001
Itti, Laurent, and Christof Koch. 2001.
‘Computational Modelling of Visual Attention’. Nature Reviews Neuroscience 2 (3): 194–203. doi:10.1038/35058500.
Johnson-Roberson, Matthew, Charles Barto, Rounak Mehta, Sharath Nittur Sridhar, Karl Rosaen, and Ram
Vasudevan. 2016. ‘Driving in the Matrix: Can Virtual Worlds Replace Human-Generated Annotations for Real World Tasks?’ ArXiv:1610.01983 [Cs], October. http://arxiv.org/abs/1610.01983.
https://doi.org/10.1109/ICRA.2017.7989092
Jordan B Peterson. 2017. 2017 Personality 02/03: Historical & Mythological Context.
https://www.youtube.com/watch?v=HbAZ6cFxCeY& index=2&list=PL22J3VaeABQApSdW8X71Ihe34eKN6 XhCi.
Koch, Christof, Marcello Massimini, Melanie Boly, and Giulio Tononi. 2016. ‘Neural Correlates of Consciousness: Progress and Problems’. Nature Reviews Neuroscience 17 (5): 307–21.
doi:10.1038/nrn.2016.22.
Makin, Alexis D J. 2018. ‘The Gap Between Aesthetic Science and Aesthetic Experience’, 30.
Mandelbrot, Benoit. 2010. Benoit Mandelbrot: Fractals and the Art of Roughness.
https://www.youtube.com/watch?v=ay8OMOsf6AQ.
Matzner, Tobias. 2019. ‘The Human Is Dead – Long Live the Algorithm! Human-Algorithmic Ensembles and Liberal Subjectivity’. Theory, Culture & Society 36 (2): 123–44. doi:10.1177/0263276418818877.
McCann, Eugene, Ananya Roy, and Kevin Ward. 2013. ‘Assembling/Worlding Cities’. Urban Geography 34 (5): 581–89.
doi:10.1080/02723638.2013.793905.
McFarlane, Colin. 2009. ‘Translocal Assemblages: Space, Power and Social Movements’. Geoforum 40 (4): 561–67. doi:10.1016/j.geoforum.2009.05.003.
———. 2011. ‘The City as Assemblage: Dwelling and Urban Space’. Environment and Planning D: Society and Space 29 (4): 649–71. doi:10.1068/d4710.
McLeod, S.A. 2008. ‘Visual Perception Theory’. https://simplypsychology.org/perception-theories.html.
Mills, Mark P. 2016. ‘The Internet Of Things Won’t Be Big It’ll Be Huge’. Forbes.
https://www.forbes.com/sites/markpmills/2016/09/ 28/the-internet-of-things-wont-be-big-itll-be-huge/.
———. 2018. Introduction to Complexity: Information, Order, and Randomness.
https://www.youtube.com/watch?time_continue=1 47&v=8UwcOaiA1m8.
———. 2019. Introduction to Complexity: Introduction to Fractals.
https://www.youtube.com/watch?time_continue=1 &v=cdX6w0W3PSY.
Norman, Don. 2011. Living With Complexity. https://www.youtube.com/watch?v=flRuSn0df8Q.
———. 2014. Don Norman: Living with Complexity. https://www.youtube.com/watch?v=Tj96KyC9zdI&f eature=youtu.be.
Ortman, Scott. 2011. 2011 - Steps Toward a Cognitive Science of Prehistory.
https://www.youtube.com/watch?v=qMWQja-n2uk&feature=youtu.be.
———. 2012. Reading Ancient Minds: Metaphor, Culture, and Complexity.
https://www.youtube.com/watch?v=fOlYyh3dk8c&f eature=youtu.be.
Owen, Ceridwen, and Kim Dovey. 2008. ‘Fields of Sustainable Architecture’. The Journal of Architecture 13 (1): 9–21. doi:10.1080/13602360701865373.
Pandey, Ananta. 2019. ‘What Makes a Public Space Great?’ Sidewalk Talk. March 29.
https://medium.com/sidewalk-talk/commonsource-app-9b26a6ded800.
Pavez, Eduardo, Philip A. Chou, Ricardo L. de Queiroz, and Antonio Ortega. 2018. ‘Dynamic Polygon Clouds: Representation and Compression for VR/AR’. APSIPA Transactions on Signal and Information Processing 7.
doi:10.1017/ATSIP.2018.15.
Raine, Derek. 2012. Causality and Complexity, Derek Raine.
https://www.youtube.com/watch?v=ZD916r7WN8w &feature=youtu.be.
Reiss, Spencer, and Nicholas Carr. 2007. ‘Q&A: Author Nicholas Carr on the Terrifying Future of Computing’. Wired, December 20.
https://www.wired.com/2007/12/st-qa-3/.
Rezende, Danilo Jimenez, S M Ali Eslami, Shakir Mohamed, Peter Battaglia, Max Jaderberg, and
Nicolas Heess. 2016. ‘Unsupervised Learning of 3D Structure from Images’, 9.
Rodaway, Paul. 2011. Sensuous Geographies: Body, Sense, and Place. 1. iss. in paperback. London: Routledge.
Safitri, Diah Wahyu, and Dwi Juniati. 2017.
‘Classification of Diabetic Retinopathy Using Fractal Dimension Analysis of Eye Fundus Image’. In , 020011. Surabaya, Indonesia.
doi:10.1063/1.4994414.
Sartwell, Crispin. 2017. ‘Beauty’. Edited by Edward N Zalta. The Stanford Encyclopedia of Philosophy, 18.
Searle, John. 2011. John Searle on Language & Social Ontology.
https://www.youtube.com/watch?v=PESRS1EXfQA& feature=youtu.be.
———. 2013. John Searle on Gibson and Direct Perception.
https://www.youtube.com/watch?v=ve0c0B47xJw& feature=youtu.be.
———. 2016. The Problem of Perception & Intentionality (John Searle).
https://www.youtube.com/watch?v=lf_4t0_HUx8.
Searle, John, and Robert Pollie. 2015. John Searle on Perception & Philosophy of Mind.
https://www.youtube.com/watch?v=Oh2NylJZRHs&f eature=youtu.be.
Sharr, Adam. 2007. Heidegger for Architects. Thinkers for Architects. London ; New York:
Routledge. https://doi.org/10.4324/9780203934197
Spehar, Branka, Solomon Wong, Sarah van de Klundert, Jessie Lui, Colin W. G. Clifford, and Richard P. Taylor. 2015. ‘Beauty and the Beholder: The Role of Visual Sensitivity in Visual Preference’. Frontiers in Human Neuroscience 9 (September).
doi:10.3389/fnhum.2015.00514.
Stafford, Barbara Maria. 2012. Iconic Turn: Prof. Dr. Barbara Maria Stafford - Towards a Cognitive Image History.
https://www.youtube.com/watch?v=uwADtbuGmr4 &feature=youtu.be.
———. 2014a. 140409 Barbara Stafford Images Precisely.
———. 2014b. Selective Attention: Neuroscience and the Art Museum.
https://www.youtube.com/watch?v=AvoGEScg0m4 &feature=youtu.be.
———. 2017. Brown Symposium 38 - Barbara M. Stafford.
https://www.youtube.com/watch?v=k0VtPcuVBkU& feature=youtu.be.
UK Government Chief Scientific Adviser. 2014. ‘The Internet of Things: Making the Most of the Second Digital Revolution’, 40.
Wachsmuth, David, David J. Madden, and Neil Brenner. 2011. ‘Between Abstraction and
Complexity: Meta-Theoretical Observations on the Assemblage Debate’. City 15 (6): 740–50.
doi:10.1080/13604813.2011.632903.
Wang, June. 2017. ‘Assemblage Urbanism’. In The Wiley Blackwell Encyclopedia of Urban and Regional Studies.
https://www.researchgate.net/publication/2970828 69_Assemblage_Urbanism.
Warren, Matt. 2018. ‘These Stunning 3D Models Are Transforming Scientists’ Raw Data’. Science | AAAS. May 31.
https://www.sciencemag.org/news/2018/06/these- stunning-3d-models-are-transforming-scientists-raw-data. https://doi.org/10.1126/science.aau3476
Williams, Rosalind. 2010 ‘Second empire, second nature, secondary world’ in Urban Assemblages: How Actor-Network Theory Changes Urban Studies. Questioning Cities. eds. Farias, Ignacio, and Thomas Bender. London ; New York: Routledge. 269-290.
Winter, Dan. 2015. FRACTALS, DNA, GOLDEN RATIO - Dan Winter.