ORIGINAL INVESTIGATION
Prognostic impact of HbA1c variability
on long-term outcomes in patients with heart
failure and type 2 diabetes mellitus
Jun Gu, Jian‑an Pan, Yu‑qi Fan, Hui‑li Zhang, Jun‑feng Zhang and Chang‑qian Wang
*Abstract
Background: The prognostic impact of long‑term glycemic variability on clinical outcomes in patients with heart failure (HF) and type 2 diabetes mellitus (T2DM) remains unclear. We determined and compared hemoglobin A1c (HbA1c) variability and clinical outcomes for patients with HF with preserved ejection fraction (HFpEF), HF with mid‑ range ejection fraction (HFmrEF) and HF with reduced ejection fraction (HFrEF) in a prospective longitudinal study.
Methods: Patients with HF and T2DM, undergone 3 or more HbA1c determinations during the first 18 months, were then followed for 42 months. The primary outcome was death from any cause. Secondary outcome was composite endpoints with death and HF hospitalization. Cox proportional hazards models were used to compare outcomes for patients with HFpEF, HFmrEF and HFrEF.
Results: Of 902 patients enrolled, 32.2% had HFpEF, 14.5% HFmrEF, and 53.3% HFrEF. During 42 months of follow‑up, 270 (29.9%) patients died and 545 (60.4%) patients experienced composite endpoints of death and HF readmission. The risk of all‑cause death or composite endpoints was lower for HFpEF than HFrEF. Moreover, higher HbA1c variabil‑ ity was associated with higher all‑cause mortality or composite endpoints and HbA1c variability was an independent predictor of all‑cause mortality or composite endpoints, regardless of EF.
Conclusions: This prospective longitudinal study showed that the all‑cause death and composite events was lower for HFpEF than HFrEF. HbA1c variability was independently and similarly predictive of death or combined endpoints in the three HF phenotypes.
Keywords: Heart failure, Type 2 diabetes mellitus, Hemoglobin A1c variability, Mortality, Hospitalization
© The Author(s) 2018. This article is distributed under the terms of the Creative Commons Attribution 4.0 International License (http://creat iveco mmons .org/licen ses/by/4.0/), which permits unrestricted use, distribution, and reproduction in any medium, provided you give appropriate credit to the original author(s) and the source, provide a link to the Creative Commons license, and indicate if changes were made. The Creative Commons Public Domain Dedication waiver (http://creat iveco mmons .org/ publi cdoma in/zero/1.0/) applies to the data made available in this article, unless otherwise stated.
Introduction
Heart failure (HF), including HF with preserved ejec-tion fracejec-tion (HFpEF), HF with mid-range ejecejec-tion frac-tion (HFmrEF) and HF with reduced ejecfrac-tion fracfrac-tion (HFrEF), is a progressive disease with high mortality and morbidity, and its prevalence is rising in the aging population [1]. And diabetes mellitus (DM) is a frequent comorbidity of HF, that poses an enormous medical, soci-etal and financial burden worldwide, with more than 40% of patients with HF having DM as a discharge diagnosis
[1, 2]. A number of studies have demonstrated that DM significantly increases the risk of recurrent HF hospitali-zations and the duration of hospital stay in HF patients, and it is associated with a significantly higher mortality compared with those without DM [2, 3].
Glycemic variability is a general denomination to sev-eral measures of short-term or long-term fluctuations in glucose level. Short-term glycemic variability refers to within-day or between-days glycemic fluctuations, and is usually measured by continuous glucose monitoring. Long-term glycemic variability refers to glycemic fluc-tuations over months to years and is generally meas-ured by visit-to-visit variability in either hemoglobin A1c (HbA1c) or fasting glucose. A limited number of literatures have indicated that both higher short-term
Open Access
*Correspondence: [email protected]
variability and long-term glycemic variability increase the risk of cardiovascular disease (CVD) morbidity and mortality in diabetic patients [4–7]. Our recent studies showed that long-term glycemic variability was asso-ciated with the new-onset atrial fibrillation (AF) and HFpEF progression in patients with type 2 DM (T2DM) [8, 9]. However, little is known about the prognostic importance of long-term glycemic variability in patients with HF and T2DM.
The aim of this study was to evaluate the prognostic value of long-term HbA1c variability for all-cause mor-tality as well as combined endpoints of death or HF read-mission in our HF comorbidity with T2DM cohort study.
Methods
Study design and population
We conducted a prospective longitudinal study of adults with HF from Shanghai Ninth People’s Hospital. Patients were those over age 18 years with a clinical diagnosis of HF and T2DM, according to the attending physician between January 2008 and March 2013. Recruitment occurred either where the patient was in hospital for a primary diagnosis of HF (assessment was done follow-ing stabilization of the acute HF) or in the out-patient setting within 6 months of an episode of decompensated HF (requiring hospitalization or treatment in an out-patient setting). Enrolled out-patients had experienced at least 3 HbA1c measurements during the first 18 months (baseline HbA1c variability), and were then followed for 42 months. Exclusion criteria included severe valve dis-ease, transient acute pulmonary edema in the context of primary acute coronary syndrome, end-stage renal fail-ure (estimated glomerular filtration rate, eGFR < 30 mL/ min/1.73 m2), specific HF subgroups (including constric-tive pericarditis, congenital heart disease, hypertrophic cardiomyopathy, cardiac amyloid, and chemotherapy-associated cardiomyopathy), isolated right HF, life-threatening comorbidity with life expectancy < 1 year. Patients who experienced all-cause death or HF hospi-talization during the period of baseline HbA1c variabil-ity (the first 18 months) were also excluded. The study protocol was approved by the local ethics committee and informed consent was obtained from all patients.
Long‑term glycemic variability measurements
The intra individual mean (HbA1c-mean) was calcu-lated from the mean value of serially measured HbA1c in each participant. HbA1c variability was measured as the standard deviation of serial HbA1c measure-ments (HbA1c-SD), the coefficient of variation of HbA1c (HbA1c-CV) was used to correct for the mean. On account of the lack of standard cutoff value for HbA1c variability indices at present, we categorized the subjects
into two groups (high group and low group) on the basis of the median value of each HbA1c variability index as we previously described [8, 9].
Echocardiography
Transthoracic echocardiography was performed using the Cardiovascular Ultrasound System (GE VIVIDT, GE Healthcare, LaMarquel, TX, USA) as we previously described [10–12]. Briefly, the frequency of the ultrasonic probe was 2.5 MHz. The cardiac structure and function were assessed from the M-mode guided by two-dimen-sional imaging to obtain the echocardiographic vari-ables. The average of three measurements was used for each variable. Left ventricular (LV) volumes were meas-ured using the biplane method of disks, and LVEF was determined using biplane modified Simpson’s measure-ments. HFpEF was defined as LVEF ≥ 50% or qualitatively ‘normal’ EF; HFmrEF as LVEF 40–49%, and HFrEF as LVEF < 40% according to 2016 ESC guidelines [1]. Tis-sue Doppler was performed in the apical four chamber view to obtain mitral annulus velocities. The sample was placed at the junction of the LV lateral wall with the mitral annulus and at the junction of the posterior inter-ventricular septum with the mitral annulus; then, the early (e′) diastolic mitral annulus velocities and the E/e′ ratio were determined.
Endpoints
The primary outcome was defined as all-cause mortal-ity. The secondary outcome was composite endpoints of death or HF hospitalization.
Follow‑up
Most of the patients visited our out-patient clinic at least every 3 months. However, if the patients did not appear at their scheduled clinic, they were interviewed by tele-phone annually. Information regarding the primary and secondary outcomes was documented in chart records and via telephone interviews. For each patient, the time to death or cardiovascular events was calculated from the initial date of follow-up to the date that the primary or secondary outcome occurred.
Statistical analysis
with Chi squared test. Cox proportional hazards regres-sion model was used to explore the association between risk factors and the risk of all-cause mortality or com-posite endpoints. All predictors with a significance of P ≤ 0.10 in the uni-variable analysis and forced inclusion variables that were considered as important predictors of clinical endpoints were entered into the multivariable model. Hazard ratios (HR) and corresponding 95% confi-dence intervals (CIs) are reported. Freedom from occur-rence of all-cause mortality or composite endpoints at 42 months was analyzed with Kaplan–Meier statistics, with difference between groups assessed using the log-rank test. All values were two-tailed, and a P value < 0.05 was considered statistically significant.
Results
Screening, recruitment and baseline clinical characteristics
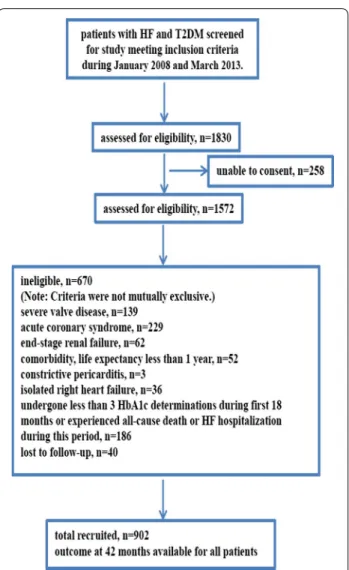
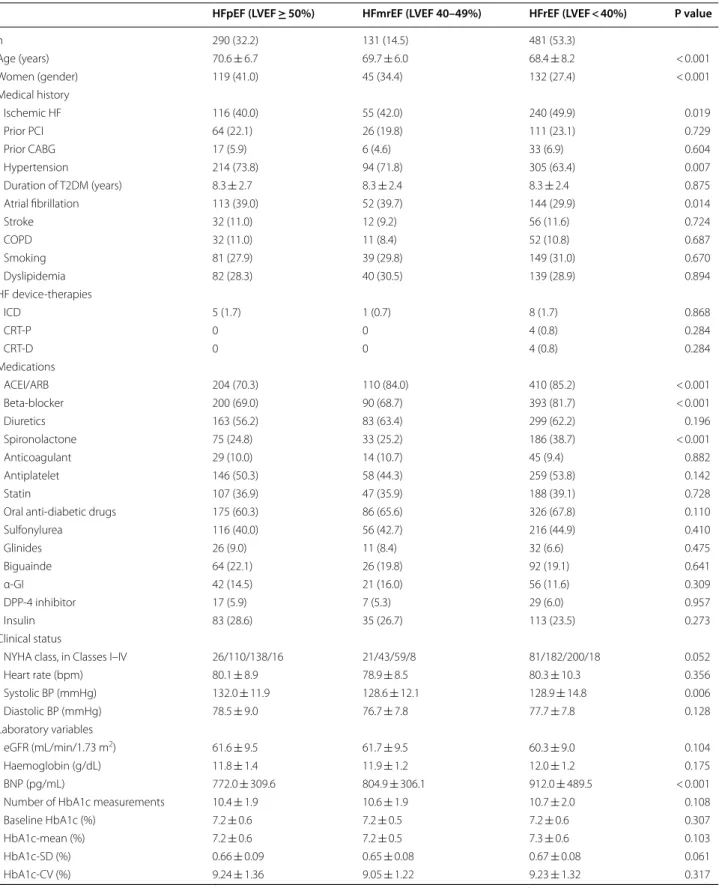
A total of 1830 patients were potentially eligible for the study, 258 were unable to provide informed consent, and a further 670 met one or more of the study exclusion cri-teria, leaving 902 patients included in the study (Fig. 1). Overall, mean age was 69.3 ± 7.5 years, and 296 (32.8%) were women (Table 1). Compared to patients with HFrEF, those with HFpEF were older (mean age 70.6 years vs. 68.4 years), more often female (41.0% vs. 27.4%), more likely to have a history of hypertension (73.8% vs. 63.4%) and AF (39.0% vs. 29.9%) and less often ischemic HF (40.0% vs. 49.9%). HF medications were commonly used at the time of the baseline assessment, with 724 (80.3%) of the whole group receiving an angiotensin converting enzyme inhibitor (ACEI)/angiotensin receptor blocker (ARB) and 683 (75.7%) receiving a beta-blocker, how-ever, more HFrEF patients received ACEI/ARB (70.3% in HFpEF, 85.2% in HFrEF) or beta-blocker (69.0% in HFpEF, 81.7% in HFrEF) therapy. Furthermore, spironolactone was more frequently prescribed in HFrEF patients (24.8% in HFpEF, 38.7% in HFrEF). Functional status (New York Heart Association, NYHA class) was similar in HFpEF and HFrEF. The clinical characteristics of the patients with HFmrEF were similar to the HFpEF group, except for systolic blood pressure (SBP), which was similar to HFrEF (Table 1). In regard to the echocardiographic find-ings, patients had a relative lower E/e′ ratio and smaller left atrium diameter (LAD) in HFpEF. And B-type natriu-retic peptide (BNP) in HFrEF was higher compared with HFpEF or HFmrEF. The median value of HbA1c-SD and HbA1c-CV were 0.6722 and 9.1896%, respectively. All patients were followed-up for 42 months.
All‑cause mortality
Data on death status was available for all patients. Dur-ing 42 months of follow-up, 270 (29.9%) patients died from any cause, 75 (25.9%) patients with HFpEF, 35
(26.7%) patients with HFmrEF and 160 (33.3%) patients with HFrEF (HFpEF vs HFrEF: P = 0.031). There were 74 (95% CI 57–91) deaths/1000-patient years in those with HFpEF, 76 (95% CI 54–99)/1000-patient years in those with HFmrEF and 95 (95% CI 84–106)/1000-patient years among those with HFrEF). For multivariable regres-sion analysis in model 1, variables (age, gender, medi-cal history, HF device-therapies, medications, clinimedi-cal status, laboratory variables and echo data) were entered into the univariate regression analysis, and variables with P < 0.10 [age, HbA1c-SD (high or low), eGFR, ACEI/ARB, beta-blockers, BNP level (tertiles), ischemic HF, NYHA functional class, E/e′ and LVEF (≥ 50, 40–49, < 40%)] and forced inclusion variables that were considered as important predictors of clinical endpoints or associated with HbA1c variability (gender, HbA1c-mean, baseline HbA1c, number of HbA1c measurements) were further entered into the multivariable Cox regression model.
Table 1 Baseline characteristics
HFpEF (LVEF ≥ 50%) HFmrEF (LVEF 40–49%) HFrEF (LVEF < 40%) P value
n 290 (32.2) 131 (14.5) 481 (53.3)
Age (years) 70.6 ± 6.7 69.7 ± 6.0 68.4 ± 8.2 < 0.001
Women (gender) 119 (41.0) 45 (34.4) 132 (27.4) < 0.001
Medical history
Ischemic HF 116 (40.0) 55 (42.0) 240 (49.9) 0.019
Prior PCI 64 (22.1) 26 (19.8) 111 (23.1) 0.729
Prior CABG 17 (5.9) 6 (4.6) 33 (6.9) 0.604
Hypertension 214 (73.8) 94 (71.8) 305 (63.4) 0.007
Duration of T2DM (years) 8.3 ± 2.7 8.3 ± 2.4 8.3 ± 2.4 0.875
Atrial fibrillation 113 (39.0) 52 (39.7) 144 (29.9) 0.014
Stroke 32 (11.0) 12 (9.2) 56 (11.6) 0.724
COPD 32 (11.0) 11 (8.4) 52 (10.8) 0.687
Smoking 81 (27.9) 39 (29.8) 149 (31.0) 0.670
Dyslipidemia 82 (28.3) 40 (30.5) 139 (28.9) 0.894
HF device‑therapies
ICD 5 (1.7) 1 (0.7) 8 (1.7) 0.868
CRT‑P 0 0 4 (0.8) 0.284
CRT‑D 0 0 4 (0.8) 0.284
Medications
ACEI/ARB 204 (70.3) 110 (84.0) 410 (85.2) < 0.001
Beta‑blocker 200 (69.0) 90 (68.7) 393 (81.7) < 0.001
Diuretics 163 (56.2) 83 (63.4) 299 (62.2) 0.196
Spironolactone 75 (24.8) 33 (25.2) 186 (38.7) < 0.001
Anticoagulant 29 (10.0) 14 (10.7) 45 (9.4) 0.882
Antiplatelet 146 (50.3) 58 (44.3) 259 (53.8) 0.142
Statin 107 (36.9) 47 (35.9) 188 (39.1) 0.728
Oral anti‑diabetic drugs 175 (60.3) 86 (65.6) 326 (67.8) 0.110
Sulfonylurea 116 (40.0) 56 (42.7) 216 (44.9) 0.410
Glinides 26 (9.0) 11 (8.4) 32 (6.6) 0.475
Biguainde 64 (22.1) 26 (19.8) 92 (19.1) 0.641
α‑GI 42 (14.5) 21 (16.0) 56 (11.6) 0.309
DPP‑4 inhibitor 17 (5.9) 7 (5.3) 29 (6.0) 0.957
Insulin 83 (28.6) 35 (26.7) 113 (23.5) 0.273
Clinical status
NYHA class, in Classes I–IV 26/110/138/16 21/43/59/8 81/182/200/18 0.052
Heart rate (bpm) 80.1 ± 8.9 78.9 ± 8.5 80.3 ± 10.3 0.356
Systolic BP (mmHg) 132.0 ± 11.9 128.6 ± 12.1 128.9 ± 14.8 0.006
Diastolic BP (mmHg) 78.5 ± 9.0 76.7 ± 7.8 77.7 ± 7.8 0.128
Laboratory variables
eGFR (mL/min/1.73 m2) 61.6 ± 9.5 61.7 ± 9.5 60.3 ± 9.0 0.104
Haemoglobin (g/dL) 11.8 ± 1.4 11.9 ± 1.2 12.0 ± 1.2 0.175
BNP (pg/mL) 772.0 ± 309.6 804.9 ± 306.1 912.0 ± 489.5 < 0.001 Number of HbA1c measurements 10.4 ± 1.9 10.6 ± 1.9 10.7 ± 2.0 0.108
Baseline HbA1c (%) 7.2 ± 0.6 7.2 ± 0.5 7.2 ± 0.6 0.307
HbA1c‑mean (%) 7.2 ± 0.6 7.2 ± 0.5 7.3 ± 0.6 0.103
HbA1c‑SD (%) 0.66 ± 0.09 0.65 ± 0.08 0.67 ± 0.08 0.061
The result showed that HbA1c-SD (HR 1.649, 95% CI 1.288–2.110, P ≤ 0.001) as well as other variables (LVEF, BNP and E/e′) were associated with an increased risk of all-cause mortality, ACEI/ARB or beta-blockers therapies were associated with a decreased risk of all-cause mortal-ity (Table 2). When using CV instead of HbA1c-SD in model 2, HbA1c-CV, BNP, LVEF and E/e′ were associated with an increased risk of all-cause mortality, ACEI/ARB or beta-blockers therapies were associated with a decreased risk of all-cause mortality (Table 2).
Combined all‑cause mortality and heart failure hospitalization
During 42 months of follow-up, 545 patients (60.4%) either died from any cause or were hospitalized for HF, 161 (55.5%) patients with HFpEF, 73 (55.7%) patients with
HFmrEF and 311 (64.7%) patients with HFrEF (P = 0.021). For multivariable regression analysis in model 3, variables (age, gender, medical history, HF device-therapies, medi-cations, clinical status, laboratory variables and echo data) were entered into the univariate regression analysis, and variables with P < 0.10 [age, HbA1c-SD (high or low), eGFR, beta-blockers, BNP (tertiles), ischemic HF, NYHA, E/e′ and LVEF (≥ 50, 40–49, < 40%)] and forced inclu-sion variables (gender, HbA1c-mean, baseline HbA1c, number of HbA1c measurements) were further entered into the multivariable Cox regression model. The result showed that HbA1c-SD (HR 1.485 95% CI 1.251–1.763, P ≤ 0.001) as well as BNP and E/e′ were associated with an increased risk of composite endpoints, beta-blocker therapy was associated with a decreased risk of compos-ite endpoints (Table 3). When using HbA1c-CV instead of HbA1c-SD in model 4, HbA1c-CV, LVEF, BNP and
Table 1 (continued)
HFpEF (LVEF ≥ 50%) HFmrEF (LVEF 40–49%) HFrEF (LVEF < 40%) P value
Echo data
LVEF (%) 59.3 ± 4.8 44.3 ± 2.0 34.4 ± 2.6 < 0.001
LAD (mm) 41.9 ± 3.9 41.8 ± 4.3 43.0 ± 4.6 0.001
E/e′ 13.0 ± 2.0 12.9 ± 2.2 13.5 ± 2.6 0.005
Data are presented as mean ± SD or number (%) of subjects
HF heart failure, PCI percutaneous coronary intervention, CABG coronary artery bypass graft, T2DM type 2 diabetes mellitus, COPD chronic obstructive pulmonary disease, HF heart failure, ICD implantable cardioverter defibrillator, CRT-P cardiac resynchronization therapy-pacemaker, CRT-D cardiac resynchronization therapy-defibrillator, ACEI/ARB angiotensin converting enzyme inhibitor/angiotensin II receptor blocker, α-GI alpha-glucosidase inhibitor, DPP dipeptidyl peptidase, NYHA
New York Heart Association functional class, BP blood pressure, eGFR estimated glomerular filtration rate, BNP B-type natriuretic peptides, HbA1c hemoglobin A1c,
HbA1c-SD standard deviation of HbA1c, HbA1c-CV coefficient of variation of HbA1c, LVEF left ventricular ejection fraction, LAD left atrium diameter, E/e’ mitral Doppler early velocity/mitral annular early velocity
Table 2 Multivariable Cox analysis for all-cause mortality
HbA1c hemoglobin A1c, HbA1c-SD standard deviation of HbA1c, HbA1c-CV coefficient of variation of HbA1c, E/e′ mitral Doppler early velocity/mitral annular early velocity, LVEF left ventricular ejection fraction, eGFR estimated glomerular filtration rate, ACEI/ARB angiotensin converting enzyme inhibitor/angiotensin II receptor blocker, BNP B-type natriuretic peptides, MI myocardial infarction, NYHA New York Heart Association functional class
HR (model 1) 95% confidence
interval P value HR (model 2) 95% confidence interval P value
HbA1c‑SD (high, low) 1.649 1.288–2.110 < 0.001 – – –
HbA1c‑CV (high, low) – – – 1.558 1.216–1.997 < 0.001
E/e′ 1.069 1.015–1.125 0.011 1.063 1.010–1.119 0.019
LVEF (≥ 50, 40–49, < 40%) 1.159 1.003–1.340 0.045 1.178 1.019–1.362 0.021
Age 1.014 0.997–1.030 0.109 1.014 0.997–1.031 0.104
eGFR 0.990 0.977–1.003 0.142 0.989 0.976–1.003 0.115
ACEI/ARB 0.705 0.526–0.945 0.019 0.701 0.523–0.940 0.018
Beta‑blocker 0.738 0.564–0.965 0.026 0.719 0.549–0.941 0.016
BNP (tertiles) 1.335 1.146–1.555 < 0.001 1.317 1.131–1.534 < 0.001
Ischemic HF 1.076 0.846–1.370 0.550 1.067 0.838–1.359 0.598
NYHA 1.103 0.994–1.287 0.217 1.019 0.949–1.296 0.191
Gender 1.098 0.849–1.421 0.475 1.111 0.859–1.438 0.423
Baseline HbA1c 1.045 0.850–1.285 0.674 1.036 0.843–1.274 0.733
Number of HbA1c measurements 1.034 0.974–1.098 0.277 1.030 0.970–1.094 0.332
E/e′ were associated with an increased risk of combined endpoints, beta-blocker therapy was associated with a decreased risk of combined endpoints (Table 3).
HbA1c variability and all‑cause mortality/composite endpoints
Over a follow-up of 42 months, the percentage of sub-jects who experienced all-cause mortality or combined endpoints was higher in those with higher glycemic vari-ability group (HbA1c-SD or HbA1c-CV) compared with lower glycemic variability group in total patents as well as subgroups of HFpEF, HFmrEF and HFrEF (see Addi-tional file 1: Table S1). The Kaplan–Meier plot for the occurrence of all-cause mortality or composite end-points between different HbA1c variability levels were presented in Fig. 2 (HF) and Additional file 2: Figure S1 (HFpEF), Additional file 3: Figure S2 (HFmrEF) and Additional file 4: Figure S3 (HFrEF).
Discussion
In the present study, we prospectively followed a cohort of HF comorbidity with T2DM over a long-term follow-up period and summarized possible prognostic factors associated with mortality and HF hospitalization. Our current data showed that overall mortality and risk of HF readmission of HFpEF were lower than in HFrEF. Our result further revealed that higher HbA1c variabil-ity was associated with elevated all-cause mortalvariabil-ity and HF hospitalization and was an independent predictor of all-cause mortality and HF hospitalization, regardless of
EF, and a given level of HbA1c variability portended the same risk of death in HFpEF, HFmrEF, and HFrEF. Our study suggested that increase in the long-term glycemic variability might have a detrimental effect on prognosis in patients with HF and T2DM.
Over the years, compared with HFrEF, the clinical out-comes for patients with HFpEF are uncertain and con-troversial. More than a decade ago, two epidemiological studies reported similar outcomes for patients with these two HF phenotypes [13, 14]. However, a meta-analysis demonstrated that overall those patients with HFpEF had a lower risk of death than patients with HFrEF [15]. The subsequent MAGGIC meta-analysis reported that patients with HFpEF had lower risk of death from any cause compared with those with HFrEF independent of clinical covariates [16]. A recent prospective multi-cen-tre longitudinal study in New Zealand and Singapore showed that the prevalence and mortality were lower in HFpEF than HFrEF [17]. Our present study also indicated that the all-cause mortality and HF hospitalization were lower in HFpEF than HFrEF.
HF, as well as T2DM, is one of the most concerning public health problem worldwide [1, 2]. Diabetic patients with both reduced and preserved EF show increased mortality and morbidity rates compared with patients without diabetes [2, 3]. This increased risk is observed in those diabetic patients of both ischaemic and non-ischaemic origin [2]. In most international guidelines for diabetes management, reducing the blood glucose level, measured by HbA1c, to optimal level is a well-recognized
Table 3 Multivariable Cox analysis for composite endpoints
HbA1c hemoglobin A1c, HbA1c-SD standard deviation of HbA1c, HbA1c-CV coefficient of variation of HbA1c, E/e′ mitral Doppler early velocity/mitral annular early velocity, LVEF left ventricular ejection fraction, eGFR estimated glomerular filtration rate, ACEI/ARB angiotensin converting enzyme inhibitor/angiotensin II receptor blocker, BNP B-type natriuretic peptides, MI myocardial infarction, NYHA New York Heart Association functional class
HR (model 3) 95% confidence interval
P value HR (model 4) 95% confidence interval P value
HbA1c‑SD (high, low) 1.485 1.251–1.763 < 0.001 – – –
HbA1c‑CV (high, low) – – – 1.378 1.160–1.638 < 0.001
E/e′ 1.045 1.008–1.084 0.018 1.040 01.003–1.079 0.034
LVEF (≥ 50, 40–49, < 40%) 1.093 0.989–1.208 0.081 1.106 1.001–1.222 0.048
age 1.011 0.999–1.022 0.069 1.010 0.999–1.022 0.073
eGFR 0.995 0.985–1.004 0.262 0.994 0.984–1.003 0.184
Beta‑blocker 0.810 0.668–0.982 0.032 0.794 0.655–0.964 0.020
ACEI/ARB 1.029 0.827–1.280 0.799 1.018 0.818–1.266 0.873
BNP (tertile) 1.149 1.035–1.276 0.009 1.136 1.017–1.261 0.017
Ischemic HF 1.097 0.925–1.300 0.288 1.095 0.924–1.298 0.296
NYHA 1.075 0.963–1.201 0.199 1.085 0.971–1.212 0.148
Gender 0.916 0.760–1.103 0.354 0.921 0.764–1.109 0.386
Baseline HbA1c 0.994 0.862–1.146 0.933 0.987 0.856–1.137 0.854
Number of HbA1c measurements 1.010 0.968–1.154 0.646 1.007 0.965–1.051 0.739
goal to minimize the risk of CVD and death [2]. How-ever, the optimal glucose level has not been well char-acterized in patients with HF. Some studies showed that higher HbA1c was associated with increased mortality in HF patients [18, 19]. Other data support a paradoxi-cal or J-shaped relationship between HbA1c and cliniparadoxi-cal outcomes [20, 21], indicating that hypoglycemia might mitigate possible benefits of lower HbA1c. A large cohort study of HF patients with DM showed a U-shaped rela-tionship between HbA1c and mortality, with the lowest
based upon the perceived risk of hypoglycemia as well as the potential for adverse sequelae related to hypogly-cemia [24, 25]. And hypoglycemia may be particularly concerning in HF patients, due to the predisposition for arrhythmias and ischemic events [26, 27]. In the present study, after categorized at clinically meaningful cut-off values (≤ 7.0, 7–8 and ≥ 8%), HbA1c-mean was not asso-ciated with the incidence of all-cause mortality and HF hospitalization. Moreover, HbA1c-mean was also not a risk factor for the incidence of all-cause mortality and HF hospitalization in our enrolled patients after multivari-able Cox regression.
Apart from the optimal level, there is an emerging con-cern about the detrimental effect of glucose fluctuation among diabetic populations [28, 29]. Many studies have indicated that the glycemic variability is a potential pre-dictor for diabetic complications and mortality and might play an important role in clinical risk assessment [28, 29]. Literatures have demonstrated that the short-term effect of higher level of fluctuation in blood glucose is an inde-pendent predictor of mortality [4, 5]. Nevertheless, a few studies have investigated the long-term effect of variabil-ity in HbA1c [29]. As a whole, most agree that glycemic variability predicts all-cause mortality, fatal or non-fatal CVD in T2DM [30–34]. However, there were opposing reports for these outcomes, the RIACE study revealed that HbA1c variability did not have a major effect on macrovascular complications including coronary or cer-ebrovascular events, myocardial infarction, or stroke [35]. The discrepancy between previous reports might be explained by differences in the study design and dif-ferent degree of HbA1c variability, baseline HbA1c level, or ethnicity. Our previous study further revealed that higher HbA1c variability was associated with greater left ventricular diastolic dysfunction and was an independent predictor of new onset of symptomatic HFpEF [8]. More-over, in patients with T2DM, elevated HbA1c variability was significantly associated with future AF development [9]. In the present study, HbA1c variability was found to be associated with all-cause mortality and HF hospi-talization and was an independent predictor of all-cause mortality and HF hospitalization after adjusting for clini-cal covariates, including EF.
In the pathophysiological rationale, intermittent hyper-glycemia rather than chronic hyperhyper-glycemia exacerbates the production of reactive oxygen, impairs endothelial function and induces cytokines release and long-lasting epigenetic changes, which will lead to increased risk of CVD and mortality [36]. Besides, hypoglycemia might contribute to the increase in the progression of CVD and mortality though induction of inflammation, blood coagulation abnormality, sympathoadrenal response and endothelial dysfunction [37]. Some studies revealed that
glucose fluctuation might be associated with the risk of hypoglycemia [37]. The importance of hypoglycaemia has also been highlighted by the EPHESUS study that found a 38% increased risk of a poorer outcome among patients with hypoglycaemia complicating HF post-myocardial infarction [38]. Rates of severe hypoglycemia are more common among older adults and those with chronic conditions, such as chronic kidney disease, CVD, HF and depression, as well as among those who are on insulin or take secretagogues. Many of the new agents to treat diabetes are less likely to cause hypoglycemia than the older classes of medications [37]. In addition to metformin, glucagon-like peptide-1 (GLP-1) agonists, dipeptidyl peptidase-4 (DPP-4) inhibitors and sodium– glucose cotransporter 2 (SGLT-2) inhibitors are all excel-lent choices for people who are at risk of hypoglycemia [23, 37, 39, 40]. More interestingly, it has been noted that some interventions (a1-glucosidase inhibitor or SGLT-2 inhibitors) that ameliorate glycemic variability have been found to reduce CVD compared to therapeutics that show less effect on glycemic variability [23, 39, 40].
Predictive values of other parameters in patients HF or diabetes have also been reported. Glycemic variability, as assessed by variability over time in HbA1c, might be an important factor in understanding mortality risk in older people with diabetes [41]. Low 1,5-anhydroglucitol lev-els, which indicate postprandial hyperglycemia, predict long-term cardiac mortality even in acute coronary syn-drome patients with HbA1c levels ≤ 7.0% [42]. Moreo-ver, advanced glycation end-products (AGEs) or soluble receptor of AGE (sRAGE), high-sensitivity troponin T (hs-TnT) and ST2 are also useful markers of HF progres-sion [43, 44].
Study limitation
in China, and it is uncertain whether these findings can be generalized to other ethnic groups.
Conclusions
Overall, the risk of all-cause mortality or combined death and HF hospitalization was lower for HFpEF than HFrEF. HbA1c variability related independently and similarly to risk of all-cause mortality or composite endpoints in the three HF phenotypes. These findings will inform projec-tions of health care needs and the design of therapeutic trials in HF and T2DM around the world.
Abbreviations
HF: heart failure; HFpEF: heart failure with preserved ejection fraction; HFmrEF: heart failure with mid‑range ejection fraction; HFrEF: heart failure with reduced ejection fraction; DM: diabetes mellitus; CVD: cardiovascular disease; AF: atrial fibrillation; T2DM: type 2 diabetes mellitus; HbA1c: hemoglobin A1c; eGFR: estimated glomerular filtration rate; HbA1c‑SD: standard deviation of HbA1c; HbA1c‑CV: coefficient of variation of HbA1c; LV: left ventricular; LVEF: left ventricular ejection fraction; HR: hazard ratios; CIs: confidence intervals; CAD: coronary artery disease; ACEI: angiotensin converting enzyme inhibitor; ARB: angiotensin receptor blocker; NYHA: New York Heart Association func‑ tional class; SBP: systolic blood pressure; DBP: diastolic blood pressure; LAD: left atrium diameter; BNP: B‑type natriuretic peptide; α‑GI: alpha‑glucosidase inhibitor; GLP: glucagon‑like peptide‑1; DPP‑4: dipeptidyl peptidase‑4; SGLT‑2: sodium–glucose cotransporter 2; AGEs: advanced glycation end‑products; sRAGE: soluble receptor of AGE; hs‑TnT: high‑sensitivity troponin T.
Authors’ contributions
JG conducted the study, collected the data, analysed the data, and wrote the manuscript. JAP collected the data and contributed to the introduction. YQF and HLZ contributed to the introduction, reviewed/edited the manuscript. JFZ and CQW designed the study, contributed to the discussion, and edited the manuscript. All authors read and approved the final manuscript.
Acknowledgements
Not applicable.
Competing interests
The authors declare that they have no competing interests.
Availability of data and materials
All data generated or analyzed during this study are included in this published article and its additional files.
Additional files
Additional file 1: Table S1. HbA1c variability and the outcome of HF. Additional file 2: Figure S1. Kaplan–Meier curves of freedom from all‑cause mortality (A, B) and composite endpoints (C, D) for low and high HbA1c variability after 42‑month follow‑up in HFpEF. The numbers at the bottom of the figure are “number at risk”.
Additional file 3: Figure S2. Kaplan–Meier curves of freedom from all‑cause mortality (A, B) and composite endpoints (C, D) for low and high HbA1c variability after 42‑month follow‑up in HFmrEF. The numbers at the bottom of the figure are “number at risk”.
Additional file 4: Figure S3. Kaplan–Meier curves of freedom from all‑cause mortality (A, B) and composite endpoints (C, D) for low and high HbA1c variability after 42‑month follow‑up in HFrEF. The numbers at the bottom of the figure are “number at risk”.
Consent for publication
Not applicable.
Ethics of approval and consent to participate
The study protocol was approved by the local ethics committee (Shanghai Ninth People’s Hospital, Shanghai Jiaotong University School of Medicine) and informed consent was obtained from all patients.
Funding
This study was supported by National Nature Science Foundation of China (81670293 to JG) and research projects from Shanghai Science and Technol‑ ogy Commission (18411950500), Shanghai Shenkang Hospital Development Center (16CR2034B to CQW) and Clinical Research Program of 9th People’s Hospital affiliated to Shanghai JiaoTong University School of Medicine (JYLJ017 to CQW).
Publisher’s Note
Springer Nature remains neutral with regard to jurisdictional claims in pub‑ lished maps and institutional affiliations.
Received: 4 May 2018 Accepted: 26 June 2018
References
1. Ponikowski P, Voors AA, Anker SD, Bueno H, Cleland JG, Coats AJ, Falk V, González‑Juanatey JR, Harjola VP, Jankowska EA, Jessup M, Linde C, Nihoyannopoulos P, Parissis JT, Pieske B, Riley JP, Rosano GM, Ruilope LM, Ruschitzka F, van der Rutten FH, Meer P, Authors/Task Force Members; Document Reviewers. 2016 ESC Guidelines for the diagnosis and treat‑ ment of acute and chronic heart failure: the Task Force for the diagnosis and treatment of acute and chronic heart failure of the European Society of Cardiology (ESC). Developed with the special contribution of the Heart Failure Association (HFA) of the ESC. Eur J Heart Fail. 2016;18(8):891–975. 2. Rosano GM, Vitale C, Seferovic P. Heart failure in patients with diabetes
mellitus. Cardiac Failure Rev. 2017;3(1):52–5.
3. MacDonald MR, Petrie MC, Varyani F, Ostergren J, Michelson EL, Young JB, Solomon SD, Granger CB, Swedberg K, Yusuf S, Pfeffer MA, McMurray JJ, CHARM Investigators. Analysis of the Candesartan in Heart failure: assess‑ ment of reduction in mortality and morbidity (CHARM) programme. Eur Heart J. 2008;29(11):1377–85.
4. Al‑Dorzi HM, Tamim HM, Arabi YM. Glycaemic fluctuation predicts mortal‑ ity in critically ill patients. Anaesth Intensive Care. 2010;38(4):695–702. 5. Kuroda M, Shinke T, Otake H, Sugiyama D, Takaya T, Takahashi H, Terashita
D, Uzu K, Tahara N, Kashiwagi D, Kuroda K, Shinkura Y, Nagasawa Y, Saka‑ guchi K, Hirota Y, Ogawa W, Hirata K. Effects of daily glucose fluctuations on the healing response to everolimus‑eluting stent implantation as assessed using continuous glucose monitoring and optical coherence tomography. Cardiovasc Diabetol. 2016;15:79.
6. Luk AO, Ma RC, Lau ES, Yang X, Lau WW, Yu LW, Chow FC, Chan JC, So WY. Risk association of HbA1c variability with chronic kidney disease and car‑ diovascular disease in type 2 diabetes: prospective analysis of the Hong Kong Diabetes Registry. Diab Metab Res Rev. 2013;29(5):384–90. 7. Lee EJ, Kim YJ, Kim TN, Kim TI, Lee WK, Kim MK, Park JH, Rhee BD. A1c
variability can predict coronary artery disease in patients with type 2 diabetes with mean a1c levels greater than. Endocrinol Metab Seoul. 2013;28(2):125–32.
8. Gu J, Fan YQ, Zhang JF, Wang CQ. Association of hemoglobin A1c variabil‑ ity and the incidence of heart failure with preserved ejection fraction in patients with type 2 diabetes mellitus and arterial hypertension. Hellenic J Cardiol. 2017. https ://doi.org/10.1016/j.hjc.2017.08.001 (Epub ahead of print).
9. Gu J, Fan YQ, Zhang JF, Wang CQ. Impact of long‑term glycemic variability on development of atrial fibrillation in type 2 diabetic patients. Anatol J Cardiol. 2017;18(6):410–6.
11. Gu J, Fan YQ, Bian L, Zhang HL, Xu ZJ, Zhang Y, Chen QZ, Yin ZF, Xie YS, Wang CQ. Long‑term prescription of beta‑blocker delays the progres‑ sion of heart failure with preserved ejection fraction in patients with hypertension: a retrospective observational cohort study. Eur J Prev Cardiol. 2016;23(13):1421–8.
12. Gu J, Fan YQ, Zhang HL, Zhang JF, Wang CQ. Serum uric acid is associ‑ ated with incidence of heart failure with preserved ejection fraction and cardiovascular events in patients with arterial hypertension. J Clin Hypertens (Greenwich). 2018;20(3):560–7.
13. Owan TE, Hodge DO, Herges RM, Jacobsen SJ, Roger VL, Redfield MM. Trends in prevalence and outcome of heart failure with preserved ejec‑ tion fraction. N Engl J Med. 2006;355(3):251–9.
14. Bhatia RS, Tu JV, Lee DS, Austin PC, Fang J, Haouzi A, Gong Y, Liu PP. Outcome of heart failure with preserved ejection fraction in a population‑based study. N Engl J Med. 2006;355(3):260–9.
15. Somaratne JB, Berry C, McMurray JJV, Poppe KK, Doughty RN, Whalley GA. The prognostic significance of heart failure with preserved left ven‑ tricular ejection fraction: a literature‑based meta‑analysis. Eur J Heart Fail. 2009;11(9):855–62.
16. Poppe KK, Squire IB, Whalley GA, Køber L, McAlister FA, McMurray JJV, Pocock S, Earle NJ, Berry C, Doughty RN, Meta‑Analysis Global Group in Chronic Heart Failure. Known and missing left ventricular ejection frac‑ tion and survival in patients with heart failure: a MAGGIC meta‑analysis report. Eur J Heart Fail. 2013;15(11):1220–7.
17. Lam CSP, Gamble GD, Ling LH, Sim D, Leong KTG, Yeo PSD, Ong HY, Jau‑ feerally F, Ng TP, Cameron VA, Poppe K, Lund M, Devlin G, Troughton R, Richards AM, Doughty RN. Mortality associated with heart failure with preserved vs. reduced ejection fraction in a prospective international multi‑ethnic cohort study. Eur Heart J. 2018. https ://doi.org/10.1093/ eurhe artj/ehy00 5 (Epub ahead of print).
18. Gerstein HC, Swedberg K, Carlsson J, McMurray JJ, Michelson EL, Olofs‑ son B, Pfeffer MA, Yusuf S, CHARM Program Investigators. The hemo‑ globin A1c level as a progressive risk factor for cardiovascular death, hospitalization for heart failure, or death in patients with chronic heart failure: an analysis of the Candesartan in Heart failure: assessment of Reduction in Mortality and Morbidity (CHARM) program. Arch Intern Med. 2008;168(15):1699–704.
19. Romero SP, Garcia‑Egido A, Escobar MA, Andrey JL, Corzo R, Perez V, Garcia‑Domiguez GJ, Gomez F. Impact of new‑onset diabetes mellitus and glycemic control on the prognosis of heart failure patients: a propensity‑matched study in the community. Int J Cardiol. 2013;167(4):1206–16.
20. Tomova GS, Nimbal V, Horwich TB. Relation between hemoglobin a (1c) and outcomes in heart failure patients with and without diabetes mellitus. Am J Cardiol. 2012;109(12):1767–73.
21. Eshaghian S, Horwich TB, Fonarow GC. An unexpected inverse relation‑ ship between HbA1c levels and mortality in patients with diabetes and advanced systolic heart failure. Am Heart J. 2006;151:91.
22. Elder DH, Singh JS, Levin D, Donnelly LA, Choy AM, George J, Struthers AD, Doney AS, Lang CC. Mean HbA1c and mortality in diabetic indi‑ viduals with heart failure: a population cohort study. Eur J Heart Fail. 2016;18(1):94–102.
23. Zinman B, Wanner C, Lachin JM, Fitchett D, Bluhmki E, Hantel S, Mattheus M, Devins T, Johansen OE, Woerle HJ, Broedl UC, Inzucchi SE, EMPA‑REG OUTCOME Investigators. Empagliflozin, cardiovas‑ cular outcomes, and mortality in type 2 diabetes. N Engl J Med. 2015;373(22):2117–28.
24. Inzucchi SE, Bergenstal RM, Buse JB, Diamant M, Ferrannini E, Nauck M, Peters AL, Tsapas A, Wender R, Matthews DR. Management of hyperglycaemia in type 2 diabetes: a patient‑centered approach. Posi‑ tion statement of the American Diabetes Association (ADA) and the European Association for the Study of Diabetes (EASD). Diabetologia. 2012;55(6):1577–96.
25. Ismail‑Beigi F, Moghissi E, Tiktin M, Hirsch IB, Inzucchi SE, Genuth S. Individualizing glycemic targets in type 2 diabetes mellitus: implica‑ tions of recent clinical trials. Ann Intern Med. 2011;154(8):554–9. 26. Kannel WB, Wilson PW, D’Agostino RB, Cobb J. Sudden coronary death
in women. Am Heart J. 1998;136(2):205–12.
27. Uretsky BF, Thygesen K, Armstrong PW, Cleland JG, Horowitz JD, Mas‑ sie BM, Packer M, Poole‑Wilson PA, Ryden L. Acute coronary findings at autopsy in heart failure patients with sudden death: results from
the assessment of treatment with lisinopril and survival (ATLAS) trial. Circulation. 2000;102(6):611–6.
28. Cheng D, Fei Y, Liu Y, Li J, Xue Q, Wang X, Wang N. HbA1C variability and the risk of renal status progression in diabetes mellitus: a meta‑analysis. PLoS ONE. 2014;9(12):e115509.
29. Gorst C, Kwok CS, Aslam S, Buchan I, Kontopantelis E, Myint PK, Heatlie G, Loke Y, Rutter MK, Mamas MA. Long‑term glycemic variability and risk of adverse outcomes: a systematic review and meta‑analysis. Diab Care. 2015;38(12):2354–69.
30. Hirakawa Y, Arima H, Zoungas S, Ninomiya T, Cooper M, Hamet P, Mancia G, Poulter N, Harrap S, Woodward M, Chalmers J. Impact of visit‑to‑visit glycemic variability on the risks of macrovascular and microvascular events and all‑cause mortality in type 2 diabetes: the ADVANCE trial. Diab Care. 2014;37(8):2359–65.
31. Bonke FC, Donnachie E, Schneider A, Mehring M. Association of the average rate of change in HbA1c with severe adverse events: a longi‑ tudinal evaluation of audit data from the Bavarian Disease Manage‑ ment Program for patients with type 2 diabetes mellitus. Diabetologia. 2016;59(2):286–93.
32. Wan EY, Fung CS, Fong DY, Lam CL. Association of variability in hemoglobin A1c with cardiovascular diseases and mortality in Chinese patients with type 2 diabetes mellitus—a retrospective population‑ based cohort study. J Diab Compl. 2016;30(7):1240–7.
33. Laiteerapong N, Karter AJ, Moffet HH, Cooper JM, Gibbons RD, Liu JY, Gao Y, Huang ES. Ten‑year hemoglobin A1c trajectories and outcomes in type 2 diabetes mellitus: the diabetes & aging study. J Diab Compl. 2017;31(1):94–100.
34. Lee MY, Hsiao PJ, Huang YT, Huang JC, Hsu WH, Chen SC, Shin SJ. Greater HbA1c variability is associated with increased cardiovascular events in type 2 diabetes patients with preserved renal function, but not in moderate to advanced chronic kidney disease. PLoS ONE. 2017;12(6):e0178319.
35. Penno G, Solini A, Zoppini G, Orsi E, Fondelli C, Zerbini G, Morano S, Cavalot F, Lamacchia O, Trevisan R, Vedovato M, Pugliese G, Renal Insuf‑ ficiency and Cardiovascular Events (RIACE) Study Group. Hemoglobin A1c variability as an independent correlate of cardiovascular disease in patients with type 2 diabetes: a cross‑sectional analysis of the renal insufficiency and cardiovascular events (RIACE) Italian multicenter study. Cardiovasc Diabetol. 2013;12:98.
36. Monnier L, Mas E, Ginet C, Michel F, Villon L, Cristol JP, Colette C. Activa‑ tion of oxidative stress by acute glucose fluctuations compared with sustained chronic hyperglycemia in patients with type 2 diabetes. JAMA. 2006;295(14):1681–7.
37. Skyler JS, Bergenstal R, Bonow RO, Buse J, Deedwania P, Gale EA, Howard BV, Kirkman MS, Kosiborod M, Reaven P, Sherwin RS, American Diabetes Association; American College of Cardiology Foundation; American Heart Association. Intensive glycemic control and the prevention of cardiovascular events: implications of the ACCORD, ADVANCE, and VA Diabetes Trials: a position statement of the American Diabetes Association and a Scientific Statement of the American Col‑ lege of Cardiology Foundation and the American Heart Association. J Am Coll Cardiol. 2009;53(3):298–304.
38. Ukena C, Dobre D, Mahfoud F, Kindermann I, Lamiral Z, Tala S, Ros‑ signol P, Turgonyi E, Pitt B, Böhm M, Zannad F. Hypo‑ and hypergly‑ cemia predict outcome in patients with left ventricular dysfunction after acute myocardial infarction: data from EPHESUS. J Card Fail. 2012;18(6):439–45.
39. Chiasson JL, Josse RG, Gomis R, Hanefeld M, Karasik A, Laakso M. Acar‑ bose treatment and the risk of cardiovascular disease and hyperten‑ sion in patients with impaired glucose tolerance: the STOP‑NIDDM trial. JAMA. 2003;290(4):486–94.
40. Rosenstock J, Hansen L, Zee P, Li Y, Cook W, Hirshberg B, Iqbal N. Dual add‑on therapy in type 2 diabetes poorly controlled with metformin monotherapy: a randomized double‑blind trial of saxagliptin plus dapagliflozin addition versus single addition of saxagliptin or dapagli‑ flozin to metformin. Diab Care. 2015;38(3):376–83.
41. Forbes A, Murrells T, Mulnier H, Sinclair AJ. Mean HbA1c, HbA1c vari‑ ability, and mortality in people with diabetes aged 70 years and older: a retrospective cohort study. Lancet Diab Endocrinol. 2018;6(6):476–86. 42. Ouchi S, Shimada K, Miyazaki T, Takahashi S, Sugita Y, Shimizu M,
•fast, convenient online submission
•
thorough peer review by experienced researchers in your field
• rapid publication on acceptance
• support for research data, including large and complex data types
•
gold Open Access which fosters wider collaboration and increased citations maximum visibility for your research: over 100M website views per year
•
At BMC, research is always in progress.
Learn more biomedcentral.com/submissions
Ready to submit your research? Choose BMC and benefit from: Kasai T, Miyauchi K, Daida H. Low 1,5‑anhydroglucitol levels are associ‑
ated with long‑term cardiac mortality in acute coronary syndrome patients with hemoglobin A1c levels less than 7.0. Cardiovasc Diabetol. 2017;16(1):151.
43. Paradela‑Dobarro B, Fernández‑Trasancos Á, Bou‑Teen D, Eiras S, González‑Ferreiro R, Agra RM, Varela‑Román A, Castro‑Pais AI, Carreira MC, Casanueva FF, Álvarez E, González‑Juanatey JR. Evolution and
bad prognostic value of advanced glycation end products after acute heart failure: relation with body composition. Cardiovasc Diabetol. 2017;16(1):115.