AUSTRALIAN JOURNAL OF BASIC AND
APPLIED SCIENCES
ISSN:1991-8178 EISSN: 2309-8414 Journal home page: www.ajbasweb.com
Open Access Journal
Published BY AENSI Publication
© 2017 AENSI Publisher All rights reserved
This work is licensed under the Creative Commons Attribution International License (CC BY).
http://creativecommons.org/licenses/by/4.0/
To Cite This Article: Genilda Canuto Amaral, Ilvan Medeiros Lustosa Junior, Erica Karolina Barros de Oliveira, Francisco Hélcio Canuto Amaral, Gileno Brito de Azevedo, Renato Vinícius Oliveira Castro, Mariana de Aquino Aragão., Diameter distribution of Cerrado – Caatinga forest formations using different Weibull functions forms. Aust. J. Basic & Appl. Sci., 11(9): 1-6, 2017
Diameter distribution of Cerrado – Caatinga forest formations using
different Weibull functions forms
1Genilda Canuto Amaral, 2Ilvan Medeiros Lustosa Junior, 2Erica Karolina Barros de Oliveira, 3Francisco Hélcio Canuto Amaral, 2Gileno Brito de Azevedo, 4Renato Vinícius Oliveira Castro, 1Mariana de Aquino Aragão
1Departament of Wood and Forest Science. Federal University of Espírito Santo. ZIP code: 29550-000. Jerônimo Monteiro, Brazil. 2Departamento de Engenharia Florestal, Universidade de Brasília, Caixa Postal 04357, Asa Norte, Brasília
3Departamento de Ciência do Solos. Universidade Federal de Lavras, Caixa Postal 37200-970, Lavras, Brazil.
4Departmento de Ciências Agrárias. Universidade Federal de São João Del Rei, Caixa Postal 36307-352, São João Del Rei, Brazil.
Address For Correspondence:
Ilvan Medeiros Lustosa Junior, Departamento de Engenharia Florestal, Universidade de Brasília, Caixa Postal 04357, Asa Norte, Brasília, DF, 70.910-900, Brazil.
E-mail: [email protected]; Phone: +55 61 9 81777356
A R T I C L E I N F O A B S T R A C T
Article history:
Received 28 March 2017 Accepted 22 May 2017
Available online 16 June 2017
Keywords:
Probability densityfunctions, Brazilian Northeast, Kolmogorov-Smirnov test.
The vegetation from the Piaui State when considering the behavior and dynamics of the arborous specimens, lacks information. Aspects such as growth and mortality are fundamental to implant management plans, aiming to use natural resources in a sustainable manner. Besides, the existence of transition areas must be highlighted, since it indicates the interaction between climatic, geomorphologic and edaphic factors, resulting in elevated levels of biodiversity and species distribution (Emperaire, 1989).This study aimed to evaluate the application of different Weibull distribution methods, with two and three coefficients, and to describe the diameter distribution in a Brazilian BiomesCerrado and Caatinga in Piaui. The functions with two and three parameters, and truncated right function were adjusted for 12 plots allocated in a 29 ha fragment, located in Canto das Macambiras, in BatalhaCounty, Piaui, Brazil. The Weibull p.d.f. was adjusted using different functions and adjustment methods(two-parameter function adjusted by the maximum likelihood and linear approximation, truncated right function and three-parameter function adjusted using the maximum likelihood method). The Adherence data was evaluated by the Kolmogorov-Smirnov test (α = 0,01). The four functions forms tested obtained adhesion according to the Kolmogorov-Smirnov test, when analyzed for all species. In other hand, for the U. tomentosa, none of the four functions tested adhered the data observed. The two-parameter Weilbull distribution was not efficient to estimate the diameter distribution of the species. The three-parameter Weilbull distribution and the truncated right function estimate, the frequency of specimens per diameter class for the C. xanthocarpa and B. ungulataspecies, therefore, it is recommended to carry out subsequent surveys to verify the distribution behavior.
INTRODUCTION
Brazil is characterized for its continental differences and elevated biodiversity indexes. The Piaui State, harbors a large natural diversity, characterized by continental Biomes, such as Caatinga, Cerrado and Mata dos Cocais, beyond the ecotones that form the vegetation that, according to Oliveira (2008).
The Caatinga is a genuinely Brazilian biome and considered as the most heterogeneous vegetation in Brazil (Engler, 1951; Rizzini, 1997), but one of the least known (Loiolla; Roque; Oliveira, 2012) is explored in disorder for energy purposes. The Cerrado is the second largest biome in the country and constitutes the richest ecosystem in the world in biodiversity, composed of several ecosystems (Silva, 2005). Making it necessary to promote scientific studies based on the development of conservation actions, which will ensure sustained management of this vegetation.
Aspects such as growth and mortality are fundamental to implant management plans, aiming to use natural resources in a sustainable manner. Besides, the existence of transition areas must be highlighted, since it indicates the interaction between climatic, geomorphologic and edaphic factors, resulting in elevated levels of biodiversity and species distribution (Emperaire, 1989).
Based on this assumption, one of the important tools to generate knowledge about the structure of a native
forest is the study of the diametric distribution (Dalla Lana et al., 2013). This tool makes it possible to distinguish
different forest types and provides a basis for identifying the intensity of natural regeneration at the species level and for the forest as a whole, and may indicate the potential for utilization of forest resources, especially when
working with multiproducts. (Scolforo, 2006; Araujo Jr. et al., 2010). However, the application of diametric
distribution models in natural forests is still incipient in Brazil.
The diameter distribution models (DDM) are used to analyze growth and production per diameter class, consisting, therefore, in one of the methods applied to evaluate the forestry dynamics, in order to quantify the volume per diameter class.
The basic principle of the diametric distribution models (DDM) adjustments consists on applying probability density functions (p.d.f.), being the Weilbull distribution frequently used, due its flexibility that allows modeling different distribution trends (Campos and Leite, 2013) end And due to the high correlation between the parameters
of the function and the characteristics of the settlement (Binoti et al., 2015).
The p.d.f. are used for analyzing variable structures in the forests, such as, frequency distribution per diameter
class at different ages, sites and densities (Bartoszeck et al., 2004), volume prognosis per diameter class (Abreu
et al., 2002), only to cite a few applications.
According to Robinson (2004), the diameter distribution is a histogram for diameter frequency at 1,30 m (DAP) of trees. It presents several forms, such as, negative exponential, unimodal, bimodal or irregular, depending on the forestry structure. The author adds that even though the diameter distribution generates an approximate modeling, it is enough to suggest a management plan.
Aiming to establish bases for the sustainable management in natural forests, the diameter distribution modeling is an excellent alternative to understand forest structure at diameter class level. It is highlighted the need to apply the modeling in the studied fragment. Considering that, this work aimed to evaluate the application of different adjustment methods applied to the Weibull distribution, with two and three parameters, and to describe the diameter distribution in a Cerrado-Caatinga transition area in the Brazilian State Piaui.
MATERIALS AND METHODS
The data used was obtained through a forestry inventory performed in 29 ha of a Caatinga-Cerrado transition area, located in Canto das Macambiras, in Batalha town, North region of the Brazilian State Piaui, under the following coordinates: 04º01'38'' South latitude, 41º55'59'' West longitude and 46 m of average altitude.
Twelve sampling units were installed, measuring 20 m x 20 m each, totalizing 4.800 m² of sampling area. These areas were selected based on simple random sampling process. Inside each unit, all specimens that presented circumference at 1,30 (CAP) equal or over 6 cm were identified, following the protocols stablished by the Caatinga Management Network (RMFC, 2005).
In order to describe the behavior of the diameter distribution of the species in the fragment, the Weibull probability density function was adjusted, using functions and adjustment methods. The two-coefficient (2P) was adjusted by the maximum likelihood and linear approximation methods. While the truncated right and three-coefficients functions (3P) were adjusted by the Maximum Likelihood method (Table 1), resulting in four adjustments in the function for the three most frequent species and for the total of species found in the area.
Table 1: Forms and methods of theWeibull probability density functions. Adjustment Function
From Adjustment Method Function Formula
1 2P Linear approximation 𝑓(𝑥) = (𝛽
𝜎) . ( 𝑥 𝛽)
𝛽−1 . 𝑒𝑥𝑝 (𝑥
𝛽) 𝛽
2 2P Maximum likelihood 𝑓(𝑥) = (𝛽
𝜎) . ( 𝑥 𝛽)
𝛽−1 . 𝑒𝑥𝑝 (𝑥
𝛽) 𝛽
3 3P Maximum likelihood 𝑓(𝑥) = (𝛽
𝜎) . ( 𝑥 − 𝛼
𝜎 )
𝛽−1
. 𝑒𝑥𝑝 [− (𝑥 − 𝛼
𝜎 )
𝛽 ]
4 Truncated
right Maximum likelihood 𝑓(𝑥; 𝛽; 𝛾) =
In which: For the Weibull distribution, with 2 and 3 parameters (𝛽 = parameter indicating the initial location
of the minimum diameter distribution; 𝜎 = scale value; 𝑥 = random variable observed; 𝑓(𝑥)= frequency per area
unit); truncated function (β = scale variable; 𝛾 = form variable; 𝑥 = random variable, in this case, the DBH class,
being x>0, β>0, γ>0; T = point of truncation (maximum diameter). The T value was considered the larger diameter observed in each plot, and the inferior limit of the distribution calculated was the smaller.
The functions were adjusted using the Weibull Trunc software, considering a 5 cm amplitude to obtain the frequencies per diameter class (Soares, Paula Neto and Souza, 2011). To analyze the adjustments quality of the p.d.f. adjustments, the Kolmogorov-Smirnov (K-S) test was applied at 1% probability (Arce, 2004; Gibbons and Subhabrata, 1992; Sokal and Rohlf, 1981). This test compares the estimated frequency accumulated; the most
divergent class was the test statistics (dn):
Dcalc=SUP|F(x)–S(x)| (1)
In which: F(x) = value of the theoretical cumulative frequency distribution; S(x) = value of the cumulative
frequency distribution observed.
After obtaining the p.d.f. Welbull coefficients, for each adjustment evaluated (for the total of species and for the three most frequent species). It was possible to estimate the number of specimens per hectare in each diameter class, using an accumulative function, considering the inferior and superior limit of each diameter class, in accordance to Campos and Leite (2013).
RESULTS AND DISCUSSION
The amount of trees measured in the forestry inventory was 1.801, in which 63 were classified as dead and
were not used in the modeling process. It was observed that three species: Campomanesia xanthocarpa Berg,
Bauhinia ungulate L. and Uncaria tomentosa Willd were the most frequent in the area (88% of the specimens), the number of individuals for these species was 602, 501 and 404, respectively. The maximum diameter found in
the fragment studied corresponded to 92,5 cm. The most frequent specie was the C. xanthocarpa Berg, with 36%
of the number of individuals. This specie registered the lower diameter values, which were inferior to 17,5 cm. As seen on Table 2, the four functions tested obtained significant adjustments by the Kolmogorov-Smirnov test when extrapolated for all species, in other words, the distribution observed in the function was statistically different from the distribution observed. Scolforo (2006) stated that applying this kind of test is preferable over the chi-square test, since the last can present tendentious values when the number of observations per diameter class is bellow five units.
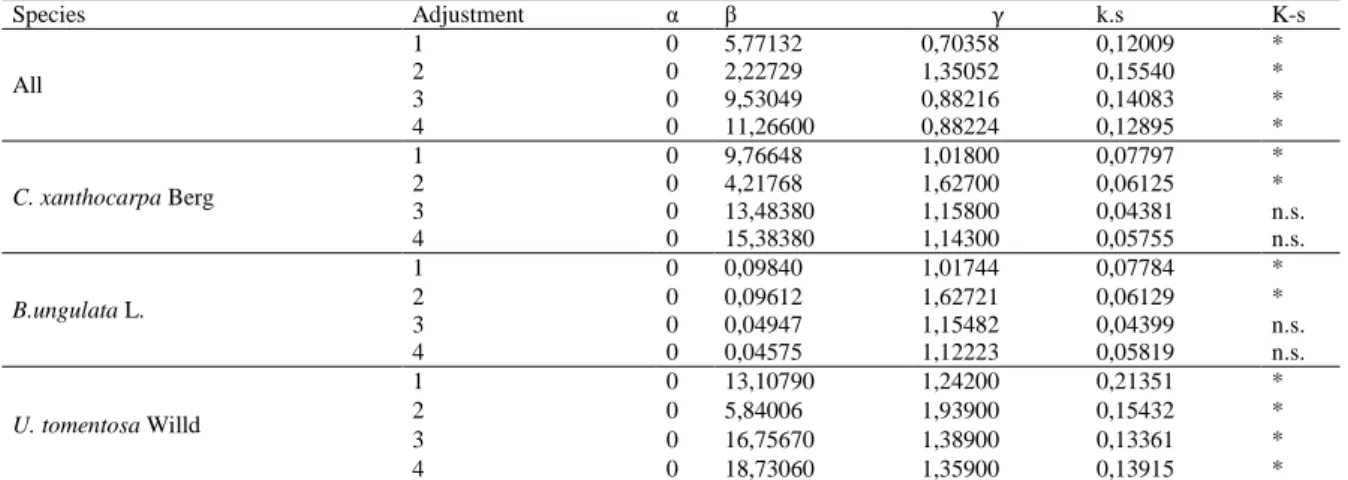
Table 2: Coefficients estimated in the four forms probability density functions, for total species and higher frequency species (C. xanthocarpa Berg, B. ungulata L. and U.tomentosa Willd.) in a Cerrado-Caatinga transition area, Batalha, Piaui.
Species Adjustment α β γ k.s K-s
All
1 0 5,77132 0,70358 0,12009 *
2 0 2,22729 1,35052 0,15540 *
3 0 9,53049 0,88216 0,14083 *
4 0 11,26600 0,88224 0,12895 *
C. xanthocarpa Berg
1 0 9,76648 1,01800 0,07797 *
2 0 4,21768 1,62700 0,06125 *
3 0 13,48380 1,15800 0,04381 n.s.
4 0 15,38380 1,14300 0,05755 n.s.
B.ungulata L.
1 0 0,09840 1,01744 0,07784 *
2 0 0,09612 1,62721 0,06129 *
3 0 0,04947 1,15482 0,04399 n.s.
4 0 0,04575 1,12223 0,05819 n.s.
U. tomentosa Willd
1 0 13,10790 1,24200 0,21351 *
2 0 5,84006 1,93900 0,15432 *
3 0 16,75670 1,38900 0,13361 *
4 0 18,73060 1,35900 0,13915 *
In which: ns =non-significant (p>0,01); * = significant at 1% of probability.
It is noted that the functions applied obtained non-significant values for the 3P function and truncated in the
right function by the maximum likelihood method for the C. xanthocarpa and B. ungulate species, respectively.
In a Mixed Rain Forest fragment, Orellana (2009) analyzed the diameter distribution of 20 species with higher importance value (IV), concluding that the three-parameter Weibull distribution resulted in the best estimated in 10 of the 20 species.
Figure 1 presents the graphics containing the values observed and estimated by the Weibull probability density functions. From the illustrations below, it is possible to infer that the vegetation shape presented a diameter
distribution typical of inverted-J natural forests. This result corroborates those found by Alves Junior et al. (2009)
Allspecies
Adjustment 1 Adjustment 2 Adjustment 3 Adjustment 4
C. xanthocarpa
Adjustment 1 Adjustment 2 Adjustment 3 Adjustment 4
B. ungul
Adjustment 1 Adjustment 2 Adjustment 3 Adjustment 4
U. tomentosa
Adjustment 1 Adjustment 2 Adjustment 3 Adjustment 4
Fig. 1: Diameter distribution curves of allspecies, C. xanthocarpa, B. ungul and U. tomentosa estimated by probability density functions on the observed frequencies histogram in a fragment of Cerrado-Caatinga
transition area - Batalha, Piaui, Brazil. In which: the observed frequency = and estimated
frequency = .
In C. xanthocarpa Bergand B. ungulata L. species, it was verified that the Weibull truncated right functions and the Weibull 3P, both adjusted by the Maximum Likelihood Method, presented the best adherencefor the diameter distribution. Since the test was non-significant for the estimates, it is possible to infer the lack of
the function of Weibull 3 parameters was the most outstanding for modeling the diametric distribution of the
species of Poincianella bracteosa, Mimosa ophthalmocentra and Manihot carthaginensis.
For Campos and Leite (2013), the most efficient method to apply the Weibull function is the maximum likelihood, due its adjustment flexibility that allows modeling different distribution trends.
According to Bailey and Dell (1973), Ribeiro et al. (2014), the maximum likelihood method, for the Weibull
distribution adjustment provides reliable estimates with little tendentiousness, different from other methods. In other hand, the Weibull 2P (Linear approximation) and Weibull 2P (Maximum likelihood) do not present a good
data adherence for C. xanthocarpa Berg and B. ungulate; therefore, they were not efficient to describe the diameter
distribution in these species.
By evaluating the diameter distribution of four Lauraceae species in a Mixed Rain Forest, Machado et al.
(2010) concluded that the 3P Weibull function was one of the most efficient and flexible functions in the adjustment for diameter distribution of the species. While the 2P Weibull function presented one of the worse performances to estimate the frequency of species per diameter class. It is important to highlight that there are not works applying this method in a Cerrado-Caatinga transition area, which difficult tracing contrast lines among the methods’ performance in this research.
By adjusting the p.d.f. in an Araucaria angustifolia (Bert.) O. Ktze settlement, Loureiro et al. (2013),
concluded that the best adjustment for the aforementioned specie was obtained using the Weibull 3P function.
Machado et al. (2009) stated that the Weibull 2P function presented the worse performance to estimate the
frequency per diameter class for the Araucaria angustifolia, in a Mixed Rain Forest Fragment.
For the U. tomentosa Willd specie, none of the four functions tested adhered the data observed, being
inadequate to describe its diameter distribution. This behavior might be due competitive matters, as well, atrophic interventions or even associated to some natural disturbance that affected the behavior of this specie’s distribution.
According to Imaña-Encinas et al. (2009), studies regarding diameter distribution of a forestry community
and its species are fundamental to provide a regeneration diagnosis, mortality rate and internal and external events that affect the forestry environment. Therefore, it is recommended to develop more studies regarding diameter distribution of these species, as well as evaluating the applicability of other density probability functions to describe the frequency of specimens per diameter class, since these studies are important to subside the management and preservation of these species.
The information generated from the results presented are pertinent to characterize the studied vegetation, serving as a base to consolidate more complex studies involving methods testings that facilitate the decision
making process in regards the Caatinga Biome preservation. According to Pulz et al. (1999), it can enable several
actions, such as defining the harvest cycle for the forest or species and evaluating the economic viability to practice or not the forest management. It will also subside, based on the species, developing criteria to help deciding which species can be removed from the forest, without affecting the maintenance of the floristic diversity.
Conclusions:
The two-parameter Weibull distribution is not efficient to estimate the diameter distribution of species, regardless the adjustment (linear approximation and maximum likelihood). Therefore, based on the results obtained in this research, it is concluded that these adjustments are not adequate for this type of vegetation.
The tree-parameter Weibull distribution and the truncated right function, however, estimate precisely the
specimens’ frequency per diameter class for the Campomanesia xanthocarpa Berg and Bauhinia ungulate L
species.
It is recommended to monitor the species studied at later intervals in order to analyze the behavior of the diametric distribution by means of the p.d.f.
REFERENCES
Abreu, E.C.R., J.R.S. Scolforo, A.D. de Oliveira, J.M. de Mello and J.R.H. Kanegae, 2002. Modelagem para
prognose precoce do volume por classe diamétrica para Eucalyptus grandis. ScientiaForestalis, 61: 86-102.
Alves Junior, F.T., R.L.C. Ferreira, J.A.A. Silva, L.C. Maragon, R.F. Costa Junior, 2009. Estrutura diamétrica de um fragmento de Floresta Atlântica em matriz de cana-de-açúcar, Catende, Pernambuco. Revista Brasileira de Engenharia Agrícola e Ambiental, 13(3): 328-333.
Araújo Júnior, C.A., G.S. Nogueira, M.L.R. Oliveira, R.O.V. Miranda, R.V.O. Castro and E. Pelli, 2010. Projeção da distribuição diamétrica de povoamentos de eucalipto em diferentes amplitudes de classe. Pesquisa agropecuária brasileira, 45(11): 1275-1281.
Arce, J.E., 2004. Modelagem da estrutura de florestas clonais de Populus deltoides Marsh. através de
distribuições diamétricas probabilísticas. Ciência Florestal, 14(1): 149-164.
Bartoszeck, A.P.S., S.A. Machado, A. Figueiredo Filho and E.B.A. Oliveira, 2004. Distribuição diamétrica para bracatingais em diferentes idades, sítios e densidades da região metropolitana de Curitiba. Revista Floresta, 34(3): 305-324.
Binoti, D.H.B., M.L.M.S. Binoti, H.G. Leite, 2015. Modelagem da distribuição diamétrica de povoamentos equiâneos de eucalipto utilizando a função logística generalizada. Revista Árvore, 39(4): 707-711.
Campos, J.C. and H.G. Leite, 2013. Mensuração florestal: perguntas e respostas. 4 ed. Editora UFV, p: 605. Castro, A.A.J.F., 2000. Cerrados do Brasil e do Nordeste: produção, hoje, deve também incluir manutenção da biodiversidade. p. 79-87. In: A. H. Benjamin & J. M. C. Sícoli (eds.). Agricultura e Meio Ambiente. IMESP
Dalla Lana, M., C.F.L.S. Brandão, S. Péllico Netto, L.C. Maragon, F.A.S. Retslaff, 2013 Distribuição diamétrica de Escheweilera ovata em um fragmento de dloresta ombrófila densa – Igarassu, PE. Floresta, 43(1): 59-68.
Emperaire, L., 1989. Végetation er festion dês resources naturelles dans la caatinga du sud-est du Piauí (Brésil). 398 f. Doctorat, Université Pierre et Marie Curie.
Engler, W.A., 1951. Contribuição ao estudo da caatinga pernambucana. Revista Brasileira de Geografia, 13(4): 51-63.
Gibbons, J.D. and C. Subhabrata, 1992. Nonparametric statistical inference. 3.ed. New York: Marcel Dekker, p: 544.
Imaña-Encinas, J., O.A. Santana, G.S. Ribeiro and C.R. Imanã, 2009. Estrutura diamétrica de um trecho de floresta estacional semidecidual na área do Ecomuseu do Cerrado, Goiás. Cerne, 15(2): 155-165.
Loiola, M.I.B., A.A. Roque, A.C.P. Oliveira, 2012. Caatinga: Vegetação do semiárido brasileiro. Ecologia 4: 14-19.
Loureiro, G.H., R.A. Curto, S. Péllico Netto, N.C. Roso and G.P. Marangon, 2013. Ajuste de funções de
distribuição diamétrica para um povoamento de Araucaria angustifolia (Bert.) O. Ktze antes e após desbaste.
Enciclopédia Biosfera, 9(16): 1874.
Machado, S.A., A.L.D. Augustynczik, R.G.M. Nascimento, S.J. Téo, E.P. Miguel, M.A. Figura and L.C.R. Silva, 2009. Funções de distribuição diamétrica em um fragmento de Floresta Ombrófila Mista. Ciência Rural, 39(8): 2428-2434.
Machado, S.A., A.A.P. Santos, R.G.M. Nascimento, A.L.D. Augustynczik and N.T. Zamin, 2010. Modelagem da Distribuição Diamétrica de Quatro Espécies de Lauraceae em um Fragmento de Floresta Ombrófila Mista. Revista Ciências Exatas e Naturais, 12(1): 91-105.
Marangon, G.P., R.L.C. Ferreira, J.A.A. Silva, P.R. Schneider, G.H. Loureiro, 2016. Modelagem da distribuição diamétrica de espécies lenhosas da Caatinga, semiárido pernambucano. Ciência Florestal, 26(3): 863-874.
Oliveira, V.S.A., 2008. viabilidade de corredor ecológico em área de ocupação humana: o caso do corredor ecológico capivara-confusões, no Piauí. 112 p. Dissertação, Universidade Federal do Piauí, PI.
Orellana, E., 2009. Funções densidade de probabilidade no ajuste da distribuição diamétrica de um fragmento de Floresta Ombrófila Mista, Irati, PR. 122 p. Dissertação, Universidade Estadual do Centro-Oeste, PR.
Pulz, F.A., J.R.S. Scolforo, A.D. Oliveira, J.M. Mello and A.T. Oliveira Filho, 1999. Acuracidade da predição da distribuição diamétrica de uma floresta inequiânea com a matriz de transição. Cerne, 5(1): 1-14.
Ribeiro, A., A.C. Ferraz Filho, J.R.S. Scolforo, S. Péllico Netto and S.A. Machado, 2014. Estrutura da
distribuição diamétrica em plantio experimental de candeia (Eremanthus erythropappus (DC.) MacLeish).
Ciência Florestal, 24(4): 1055-1065.
Rizzini, C.T., 1997. Tratado de fitogeografia do Brasil. Âmbito cultural. Edições Ltda. p: 157.
RMFC (REDE DE MANEJO FLORESTAL DA CAATINGA), 2005. Protocolo de medições de parcelas permanentes / Comitê Técnico Cientifico. Recife: Associação Plantas do Nordeste, p: 21.
Robinson, A., 2004. Preserving correlation while modeling diameter distributions. Canadian Journal of Forest Research, 34(1): 221-232.
Scolforo, J.R.S., 2006. Biometria florestal: Modelos de crescimento e produção florestal. Editora Universidade Federal de Lavras. p: 393.
Silva, A.A., 2005. Uso de sensoriamento remoto para o monitoramento ambiental dos Cerrados. In: Anais do Simpósio Brasileiro de Geografia Física Aplicada, 9. Universidade de São Paulo.
Soares, C.P.B., F. Paula Neto and A.L. Souza, 2011. Dendrometria e inventário florestal. Editora Universidade Federal de Viçosa. p: 272.