181
© 2017 by the Serbian Biological Society How to cite this article: Peng Y, Ma H, Chen S. De novo characterization of the Lycium ruthenicum transcriptome and analysis of its digital gene expression profiles during fruit development and ripening. Arch Biol Sci. 2017;69(1):181-90.
De novo
characterization of the
Lycium ruthenicum
transcriptome and analysis of its
digital gene expression profiles during fruit development and ripening
Yong Peng1, Huiqin Ma2 and Shangwu Chen1,3,*
1Beijing Laboratory for Food Quality and Safety, College of Food Sciences and Nutrition Engineering, China Agricultural
University, Beijing, China
2College of Horticulture, China Agricultural University, Beijing, China
3Beijing Advanced Innovation Center for Food Nutrition and Human Health, China Agricultural University, Beijing, China
*Corresponding author: [email protected]
Received: January 23, 2016; Revised: March 16, 2016; Accepted: April 4, 2016; Published online: November 11, 2016
Abstract: Lycium ruthenicum Murr., which belongs to the family Solanaceae, is a resource plant for Chinese traditional medicine and nutraceutical foods. In this study, RNA sequencing was applied to obtain raw reads of L. ruthenicum fruit at different stages of ripening, and a de novo assembly of its sequence was performed. Approximately 52.45 million 100-bp paired-end raw reads were generated from the samples by deep RNA-seq analysis. These short reads were assembled to obtain 164814 contigs, and the contigs were assembled into 84968 non-redundant unigenes using the Trinity method. Assembled sequences were annotated with gene descriptions, gene ontology, clusters of orthologous group and KEGG (Kyoto Encyclopedia of Genes and Genomes) pathway terms. Digital gene expression analysis was applied to compare gene-expression patterns at different fruit developmental stages. These results contribute to existing sequence resources
for Lycium spp. during the fruit-ripening stages, which is valuable for further functional studies of genes involved in L.
ruthenicum fruit nutraceutical quality.
Key words: de novo characterization; digital gene expression profiles; fruit development; Lycium ruthenicum; transcriptome
INTRODUCTION
L. ruthenicum Murr., from the genus Lycium of the fam-ily Solanaceae, is mainly distributed in the desert area of northwestern China and Central Asia. In China, it is mainly found in Qinghai, Ningxia and Xinjiang prov-inces. It is an ideal plant for preventing soil desertifica-tion and alleviating soil salinity and alkalinity because of its specific physiological characteristics of drought- and salt-resistance, which are very important for the ecosystem and agriculture in arid areas [1].
The fruit of L. ruthenicum, a Chinese traditional herb, is used in Tibetan medicine for the treatment of heart disease, abnormal menstruation and meno-pause, as well as a nutraceutical food [2]. Studies on L. ruthenicum have mainly focused on chemical components such as anthocyanins [3-5], essential oils [6], polysaccharides [7] and their pharmacological properties [8,9]. Recently, an increasing number of
studies has aimed to reveal the genetic information of L. ruthenicum in shrub population and structure, sequence-related amplified polymorphism (SRAP) markers [10] and simple sequence repeats (SSRs) markers [11]. These researches have enriched the ge-netic knowledge of L. ruthenicum. SSRs are variable and ubiquitous in eukaryotic genomes, and are use-ful tools for evaluating genetic diversity, population structure and fingerprint mapping [12,13]. Recently, next-generation sequencing (NGS) technology was created as an innovative approach for high-through-put sequence determination and it has dramatically improved the speed and efficiency of gene discovery.
glu-copyranoside [15]. The anthocyanin pathway is regu-lated by the MYB-bHLH-WD40 transcription factor complexes comprising of R2R3-MYB, basic-helix-loop-helix (bHLH) and WD-repeat (WDR) proteins. Meanwhile, the R3-MYB and R2R3-MYB repressors play a role in reducing anthocyanin production [16].
The aim of this study was to uncover transcrip-tome information for L. ruthenicum fruit and compare its digital gene expression (DGE) profiles at various developmental stages. Initially, we sequenced the transcriptome of L. ruthenicum fruit with Illumina se-quencing technology. Furthermore, we compared the gene expression profiles of fruits among different fruit ripening stages by the digital gene expression system, aiming to characterize the transcriptome related to biosynthesis of anthocyanins of L. ruthenicum. The as-sembled, annotated transcriptome sequences and gene expression profiles provide valuable information for a better understanding of gene expression patterns at different fruit developmental stages of L. ruthenicum.
MATERIALS AND METHODS Plant material
L. ruthenicum fruits were collected in a semi-wild, semi-desert area near Yinchuan, Ningxia province, China. Thefruits were harvested at different develop-mental stages: the green fruit peel period (P1), initia-tion of peel color change (P2) and the fully mature, black peel period (P3) (Fig. 1). Collected fruits were cleaned, frozen by liquid nitrogen and stored at -80°C. RNA extraction and RNA sequencing
Total RNA was extracted from the whole fruit by the CTAB method [17] and treated with DNaseI (Taka-ra Biotech Incorpo(Taka-ration) to remove contaminating
DNA. The cDNA library for reference transcriptome was prepared by pooling the extracted RNA from the different fruit-ripening stages (P1, P2 and P3). Beijing Genome Institute (BGI, Shenzhen, China) operated the subsequent enrichment of mRNAs, fragment interrup-tion, addition of adapters, PCR amplification and RNA sequencing according to the next-generation RNA-seq protocol and manufacturer’s instructions [18-20]. The quality and integrity of the RNA samples were exam-ined using the Agilent 2100 Bioanalyzer, and samples with RNA integrity number (RIN) values higher than 7.0 were used. Poly (A) mRNA was isolated using mag-netic beads (Illumina) bonding with oligo (dT), the mRNA was fragmented, and cDNA was synthesized using random hexamer primers (Sangon Biotech) and reverse transcriptase (Invitrogen). The libraries were sequenced using the Illumina HiSeq 2000 platform af-ter end-repair, adaptor ligation and PCR amplification. Libraries that gave reads unevenly distributed among the gene regions were discarded and replaced. Assembly and annotation of the reference transcriptome
The raw sequencing reads were first filtered by remov-ing invalid and low-quality reads, which included reads with adaptor contamination, with N percentages greater than 5% and reads with more than 50% bases with qual-ity lower than Q20 level (an error probabilqual-ity of 1%) in one sequence. The short reads were first assembled into longer but gapless contigs using Trinity software [20], and the contigs were further assembled to obtain the unigenes that could not be extended on either end. We used Blast2GO to obtain gene ontology (GO) annotations of the unigenes [21] and classified the unigenes’ GO function by using WEGO software [22] and connecting some unigenes with metabolic path-ways using the KEGG database [23] (E-value ≤1.0E-5). The sequence direction of the unigenes was deter-mined according to the best alignment results. When the results were conflicting among databases, the di-rection was determined successively by the NCBI non-redundant protein sequence database (NR), Swiss-Prot, KEGG and clusters of orthologous groups (COG). When a unigene would not align to any database, we applied ESTScan to predict coding regions and deter-mine sequence direction [24]. SSR was screened by the
SSR detecting program MicroSAtellite (MISA) (http:// pgrc.ipk-gatersleben.de/misa/misa.html). The criteria for SSR identification were as follows: 12 nt for mono-nucleotide, di-nucleotide and tri-nucleotide SSRs; 16 nt for tetra-nucleotide SSRs; 20 nt for penta-nucleotide SSRs; and 24 nt for hexa-nucleotide SSRs.
Preparation and sequencing of DGE library
After extracting total RNAs from the samples, mRNAs of samples were enriched by using the oligo (dT) mag-netic beads (Illumina) from the total RNAs. By us-ing the fragmentation buffer (Life Technologies), the mRNAs were fragmented into short fragments (about 200 bp), then the first-strand cDNAs were synthesized by random hexamer-primer (Sangon Biotech) using the mRNA fragments as templates. Buffer, dNTPs, RNase H and DNA polymerase I (Invitrogen) were added to synthesize the second strand. The double-strand cDNAs were purified with a QiaQuick PCR extraction kit and washed with ethidium bromide (0.5 μg/ml) buffer for end repair and poly(A) addition. Finally, sequencing adaptors were ligated to the frag-ments. The fragments were purified by agarose gel electrophoresis and enriched by PCR amplification using adapters as primers. The library products were sequenced using the Illumina HiSeq 2000 platform. DGE analysis and mapping
The original image data were transferred into se-quence data via base calling. Filtering and quality control checks (base composition analysis, per base sequence quality and per sequence quality scores) were performed using FastQC (http://www.bioinfor-matics.bbsrc.ac.uk/projects/fastqc/). We filtered the reads with adapters, with unknown bases more than 5% and low-quality reads with more than 50% of bases with quality lower than Q20 level.
Clean reads were mapped to reference sequences by using the SOAP2 [25] aligner. No more than 2 mismatches were allowed in the alignment. Qual-ity control of alignment included the statistics of alignment analysis, sequencing saturation analysis, distribution of reads on reference genes analysis and coverage analysis. For gene expression analysis, we used the RPKM (Reads Per Kilo base of exon model
per Million mapped reads) [26] method to calculate the gene expression level. Based on gene expression, we selected differentially expressed genes (DEGs) and carried out further functional analysis.
Evaluation of DGEs
We analyzed the expression levels to compare the gene expression in three different fruit ripening periods. We used “false discovery rate (FDR) ≤0.001 [27] and the absolute value of log2 Ratio >1” as the threshold to judge the significance of the differences in gene expression. In the pathway analysis, we mapped the differentially expressed genes in the KEGG database and identified significantly enriched genes related to metabolic or signal-transduction pathways.
RESULTS
Sequencing and assembly of clean reads
We obtained an overview of the gene-expression profiles of L. ruthenicum fruit at different stages of ripening. Approximately 52.45 million 100-bp paired-end raw reads were generated from the L. ruthenicum
fruit by deep RNA-seq analysis. After filtering out the repetitive, low-complexity and low-quality reads, we obtained 51.39 million clean 100-bp reads. These short reads were assembled into 164814 contigs ranging from 200 to over 3000 bp, with a mean size of 323 bp. Q20 level and GC content were 99.01% and 45.78%, respectively. The contigs were assembled into 84968 non-redundant unigenes with a mean size of 610 bp using the Trinity method for paired-end joining and gap-filling. The 84968 unigenes’ total consensus se-quences were divided into 9377 distinct clusters and 64432 distinct singletons after clustering.
Functional annotation of unigenes using public databases
sample’s unigenes against the NCBI NR nucleotide database with an E-value of less than 1.0E-5, yield-ing 50880 genes. The E-value distribution statistics revealed that 46.4% of the mapped sequences have strong homology (smaller than 1.0E-50), and 53.6% of the sequences have homology ranging between 1.0E-5 and 1.0E-60. The similarity distribution showed that 63.6% of the sequences have higher than 80% similar-ity, and the highest percentage of unigenes mapped to
Solanum tuberosum sequences (Table 2).
The unigenes were annotated with Enzyme Com-mission (EC) numbers from BLASTx alignments against the KEGG database (E-value ≤1.0E-5) to
determine the biological pathways in L. ruthenicum
fruit. KEGG analysis assigned 26269 unigenes to ap-proximately 38635 items and 128 known metabolic or signaling pathways, of which 6330 (24.1%) unigenes were related to metabolic pathways, 3380 (12.87%) to biosynthesis of secondary metabolites, 1479 (5.63%) to plant-pathogen interactions, 1404 (5.34%) to RNA transport, 1304 (4.96%) to plant hormone signal trans-duction and 497 (including 420 individual unigenes) to flavonoid-biosynthesis pathway categories, closely related to flavonoid, flavone, flavonol, isoflavonoid and anthocyanin biosynthesis for nutraceutical qual-ity formation.
Table 1. Summary of the fruit transcriptome of L. ruthenicum
annotation against different databases.
Unigenes in database Number Percentage
Total number of unigenes 84968 100
NR 50880 59.88
NT 54876 64.58
Swiss-Prot 33868 39.86
COG 17133 20.16
GO 30874 36.34
KEGG 26269 30.92
NR − NCBI non-redundant protein sequences, NT − NCBI non-redundant nucleotide sequences, COG − Clusters of Orthologous Groups, GO − Gene Ontology, KEGG − Kyoto Encyclopedia of Genes and Genomes.
Table 2. Characteristics of homology search of unigenes of L. ruthenicum against the NCBI nr database.
Distribution Percentage
E-value distribution
0 20.94
0~1E-100 13.26
1E-100~1E-60 12.25
1E-60~1E-45 8.01
1E-45~1E-30 13.1
1E-30~1E-15 18.68
1E-15~1E-5 13.76
Species distribution
Solanum tuberosum 28.36
Solanum lycopersicum 15.05
Pyrenophora teres f. teres 0-1 1.7 Pyrenophora tritici-repentis
Pt-1C-BFP 1.67
Nicotiana tabacum 1.35
Vitis vinifera 1.22
Others 15.31
Similarity distribution
18%~40% 3.76
40%~60% 10.55
60%~80% 22.1
80%~95% 50.26
95%~100% 13.33
COG and GO classification
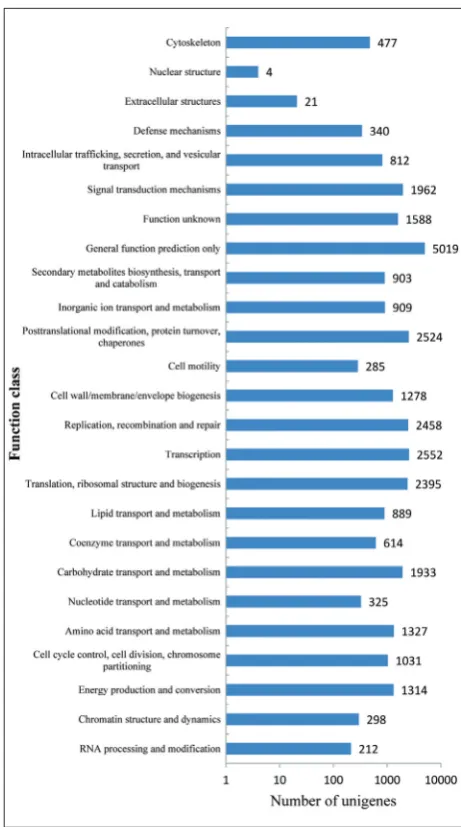
We aligned the unigenes to the COG database to predict their possible functions and analyzed their functional classification. A total of 17133 unigenes were assigned to 25 COG classification groups (Fig. 2). Among these groups, the “general function predic-tion only” cluster (5019; 29.29%) ranked as the larg-est group, followed by “transcription” (2552; 14.9%), “posttranslational modification, protein turnover, chaperones” (2524; 14.73%) and “replication,
recom-bination and repair” (2458; 14.34%). Secondary me-tabolites and related transporters were run in the third group. However, only a few unigenes were matched to the “nuclear structure” (4, 0.02%) and “extracellular structures” (21; 0.12%) categories. In addition, 1588 (9.27%) unigenes were related to “function unknown” and could be undiscovered genes in L. ruthenicum.
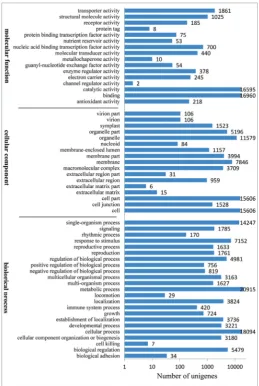
GO is the system for sorting gene descriptions according to three ontology categories and func-tional subcategories. A total of 30874 unigenes of the
pooled sample of L. ruthenicum fruit were assigned for GO annotation and functional classification using Blast2GO and WEGO. In the biological process (BP) category, the major function terms were “metabolic process” (20915 terms), “cellular process” (18094), “single-organism process” (14247) and “response to stimulus” (7152). Within the cellular component (CC) category, most unigenes were assigned to “cell” (15606 terms), “cell part” (15606), “organelle” (11579) and “membrane” (7846). In the molecular function (MF) category, the dominating function terms were “bind-ing” (16960), “catalytic activity” (16595), “transporter activity” (1861) and “structural molecule activity” (1025) (Fig. 3).
Frequency and distribution of SSRs
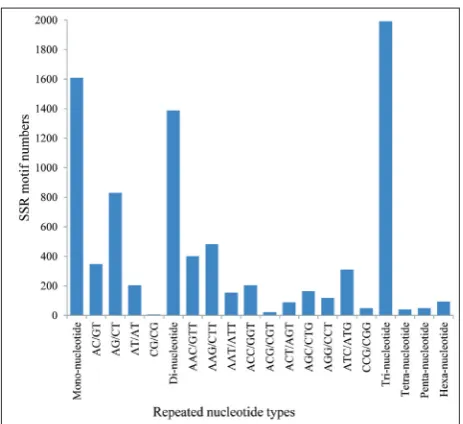
All of the unigenes were analyzed for SSR motifs, and in 4653 (5.48%) unigenes 5172 SSRs were identified, with the average frequency of one SSR per 10.01 kb. Most unigenes contained 1 SSR, while there were 499 unigenes containing multiple SSRs with up to 212 SSRs present in compound formation. The trinucleotide re-peats were most abundant (38.5%) followed by mono-nucleotide (31.11%) and dimono-nucleotide repeats (26.84%) in various groups of SSRs. The hexanucleotide (1.82%), pentanucleotide (0.95%) and tetranucleotide (0.79%)
repeats represented a smaller proportion of the mo-tif classes. Among the dinucleotide repeats, AG/CT was the most abundant (59.8%) followed by AC/GT (25.07%) and AT/AT (14.7%). The trinucleotide re-peats, including AAG/CTT, AAC/GTT, ATC/ATG and ACC/GGT, were predominant in this part (Fig. 4). Sequences mapping to the reference
transcriptome database
We mapped the tag sequences of the three fruit-stage libraries to the fruit-reference library of L. ruthenicum
with the DGE method. Approximatively 72544, 68100 and 75212 unigenes were mapped to the reference database in the P1, P2 and P3 fruit stages, respectively. For all fruit-stage DGEs, the number of detected genes vs. the sequenced read amount were displayed as a sat-uration function curve, when the clean reads number reached above 10 million. In the 20 most abundantly expressed genes of the P3 stage of L. ruthenicum, genes such as cytochrome P450, 2S sulfur-rich seed stor-age protein, lipid transfer protein LTP1 precursor, flower-specific defensin, chitin-binding lectin 1 and pathogenesis-related proteins were expressed in all three fruit stages.
Differential expression profiles at the different fruit stages
To obtain the digital expression profile of the DEGs among the three fruit development stages of L. ru-thenicum we used the RPKM method to perform gene expression analysis pairwise among the P1, P2 and P3 libraries. In the “P2 vs. P1,” “P3 vs. P2,” and “P3 vs. P1” comparisons we identified 9479, 15953 and 10344 DEGs, respectively, under FDR ≤0.001 and absolute value of log2-ratio >1 (Fig. 5). In total, 6761 upregu-lated and 2718 downreguupregu-lated genes were detected in P2 vs. P1, 6178 upregulated and 9775 downregulated genes in P3 vs. P1, and 1760 upregulated and 8584 downregulated genes in P3 vs. P2 (Table 3). In ad-dition, 2943, 286 and 6155 genes were uniquely ex-pressed in the P1, P2 and P3 stages, respectively, while 62232 genes were expressed during all three stages.
The differential expression profiles obtained by pairwise comparison were further delineated by ana-lyzing the DEGs for enriched GO terms on GO
tology domains of BP, CC and MF and for enriched KEGG pathway ontology (KO) terms illustrating the fruit’s developmental changes. For fruit stages P2 vs. P1, a total 156 functional catalogs were found changed for GO terms by DEGs, including 81 in BP, 41 in CC and 34 in MF. For P3 vs. P1 fruit stages, a total of 246 functional groups were found changed, and in the P3 vs. P2 comparison, 333 functional groups changes were found, including 188, 79 and 66 groups for BP, CC and MP, respectively. The parallel DEGs signed by KO terms for enriched KEGG pathway annotation with pairwise comparisons of the three fruit ripening stages of L. ruthenicum indicated significant changes in biosynthesis of secondary metabolites and metabol-ic pathways during fruit development and ripening.
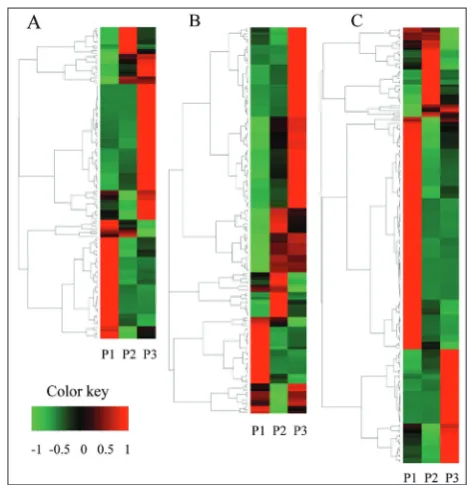
A total of 458 DEGs related to “flavonoid biosyn-thesis” (126), “phenylpropanoid biosynbiosyn-thesis” (156) and “starch and sucrose metabolism” (176) categories were detected during the ripening stages according to gene annotation and biosynthesis pathway analysis
(P ≤0.05). Hierarchical cluster analysis of the DEGs at the different ripening stages was performed to ex-amine the similarity and diversity of gene expression. We clustered the three categories of DEGs mentioned above of the different fruit ripening stages. The expres-sion of genes related to flavonoid biosynthesis was downregulated in the P2 stage and upregulated in the P3 stage (Fig. 6A). In addition, the overall trend in expression level of genes related to phenylpropanoid biosynthesis was ascending (Fig. 6B), while the overall trend in expression level of genes related to starch and sucrose metabolism successively declined during the fruit ripening (Fig. 6C).
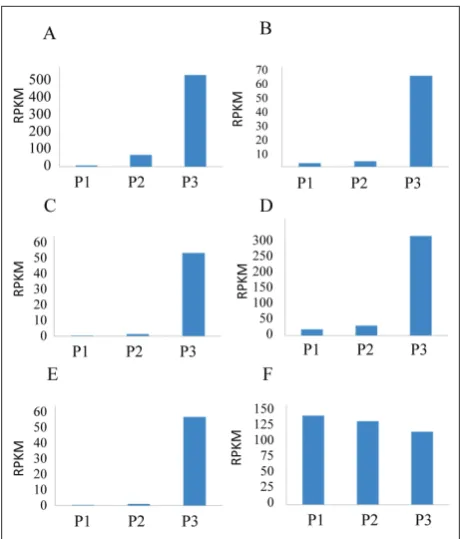
The expression levels of leucoanthocyanidin di-oxygenase, flavonoid 3-glucosyltransferase precursor, anthocyanidin 3-O-glucoside 5-O-glucosyltransferase and flavonoid 3’,5’-hydroxylase [28,29] (Fig. 7A-D), genes related to pigment formation and color, were considerably higher at the fully ripe stage. These incre-ments were positively correlated with the expression of R2R3-Myb [30,31] (Fig. 7 E), the plant
transcrip-Fig. 5. Venn diagram of unique expressed genes pairwise among P1, P2 and P3 fruit stages of L. ruthenicum. The sum of the num-bers in each large circle represents total number of differentially expressed genes between different stages, the overlap part of the circles represents common differentially expressed genes among combinations.
Table 3. Differential expression of genes in different stages of L. ruthenicum.
Compared
groups Differentially expressed genes Up-regulated Down-regulated
P2/P1 9479 6761 2718
P3/P1 15953 6178 9775
P3/P2 10344 1760 8584
tion factor which is highly correlated to the anthocy-anin accumulation, while the expression of translation elongation factor 1, used as a housekeeping gene, was nearly equal during the all three stages (Fig. 7 F).
DISCUSSION
Next-generation sequencing technology has emerged as a timesaving approach in genetic analysis, compara-tive genomics and functional genomics of non-model organisms. The genome information on L. ruthenicum
fruit or related species was absent. In this study, the RNA-seq data from different ripening stages of L. ru-thenicum fruit provides a comprehensive approach for DEG searches and anthocyanin synthesis molecular mechanism researching.
The annotation results imply that the Illumina HiSeq 2000 sequencing project in this study produced a substantial number of assembled transcripts of L.
ruthenicum fruits. The species distribution returned from the NR database demonstrates that the transcrip-tome of L. ruthenicum is more closely related to that of Solanum tuberosum than to other plant genomes present in current public databases.
Overall, “biosynthesis of secondary metabolites” accounted for almost half of unigenes related to meta-bolic pathways in KEGG data mapping, suggesting that the secondary metabolic processes are active pathways in L. ruthenicum fruit development. It is noticeable that 903 unigenes (5.27%) were classified into the group of “secondary metabolite biosynthesis, transport and catabolism” in COG categories, imply-ing that those secondary metabolite processes play crucial roles in L. ruthenicum fruit development.
Among the dinucleotide SSRs, the most abun-dant motif was GA/CT among the dinucleotide re-peats SSRs, similar to the situation in a broad array of species such as Capsicum annuum [32,33], Solanum melongena [13], wheat [34] and barley [35]. AAG/ CTT was the most common trimeric motif present in L. ruthenicum, a situation that almost matches that in peppers (Capsicum) [36], tomato [37], peanut [38] and radish [39]. The SSRs recognized in the present research provide an abundant resource for L. rutheni-cum molecular marker studies.
Based on the DGE data ofL. ruthenicum, multiple genes exhibited different expression patterns in differ-ent ripening stages. A total 2943, 286 and 6155 genes were uniquely expressed in stages P1, P2 and P3, re-spectively, implying that in the fully ripe stage the ex-pression level of genes is higher than in previous stages. In L. ruthenicum, nearly all the structural and reg-ulatory genes involved in anthocyanin pathway were significantly upregulated at the fully ripe stage [29]. The same trend was documented in this study, where the anthocyanin accumulation-related genes were in-creasingly expressed during fruit ripening, reaching significantly increased expression at full ripe stage.
Fruit skin coloration is a unique pattern in the life cycle of fruiting plants and is mainly attributed to anthocyanin pigments [40]. The content of anthocya-nins and color of the fruit skin are related; the increase in anthocyanin biosynthesis-related gene expression causes the anthocyanin accumulation and results in
fruit color deepening. In a anthocyanin biosynthesis-related study, anthocyanin profiling confirmed that anthocyanins were increasingly accumulated during fruit ripening in L. ruthenicum, and sharply increased in fully expanded mature fruit [29]. On the other hand, for the starch and sucrose metabolism-related DEGs, the gene expression decreased during L. ru-thenicum fruit development. This suggests that dur-ing fruit ripendur-ing sucrose synthesis shows a trend of initial increase followed by a decrease [41] and would be reduced in fully ripened fruit.
Availability of supporting data
All clean reads generated by Illumina sequencing have been deposited in the Sequence Read Archive (SRA) data base (http://www.ncbi.nlm.nih.gov/sra) under the accession no. ID SRP071022.
Acknowledgments: We thank the Agriculture and Animal Hus-bandry Bureau of Yinchuan City for providing L. ruthenicum fruit samples.
Authors’ contribution: PY, MHQ and CSW conceived and de-signed the experiments, contributed reagents/materials/analysis tools and wrote the paper. PY performed the experiments and analyzed the data.
Conflict of interest disclosure: The authors declare that no com-peting interests exist.
REFERENCES
1. Chen H, Pu L, Cao J, Ren X. Current Research State and Exploitation of Lycium ruthenicum Murr. Heilongjiang Agr Sci. 2008;5:155-7.
2. Gan QM LG, Li PY, Zhuoma DZ, Chen YR, Zuo ZC. Study on the development and utilization of Tibetan medicine Lycium ruthenicum Murr. Qinghai Sci Tech. 1997;4(1):17-9. 3. Zheng J, Ding C, Wang L, Li G, Shi J, Li H, Wang HL, Suo
YR. Anthocyanins composition and antioxidant activity of wild Lycium ruthenicum Murr. from Qinghai-Tibet Plateau. Food Chem. 2011;126(3):859-65.
4. Li J, Qu W, Zhang S, Lv H. Study on antioxidant activity of pigment of Lycium ruthenicum. China J Chinese Mater Med. 2006;31(14):1179-83.
5. Kosar M, Altintas A, Kirimer N, Baser KHC. Determination of the free radical scavenging activity of Lycium extracts. Chem Nat Compd. 2003;39(6):531-5.
6. Altintas A, Kosar M, Kirimer N, Baser K, Demirci B. Com-position of the essential oils of Lycium barbarum and L. ruthenicum fruits. Chem Nat Compd. 2006;42(1):24-5.
7. Wang JH, Chen XQ, Zhang WJ. Study on hypoglycemic function of polysaccharides from Lycium ruthenicum Murr. fruit and its mechanism. Food Sci. 2009;30(5):244-8. 8. Peng Q, Liu H, Shi S, Li M. Lycium ruthenicum
polysaccha-ride attenuates inflammation through inhibiting TLR4/NF-κ B signaling pathway. Int J Bio Macromol. 2014;67:330-5. 9. Li J, Yuan H, Zeng X-C, Han B, Shi D-H. Toxicological
assessment of pigment of Lycium ruthenicum Murr. Food Sci. 2007;28(7):470-5.
10. Liu Z, Shu Q, Wang L, Yu M, Hu Y, Zhang H, Tao Y, Shao Y. Genetic diversity of the endangered and medically impor-tant Lycium ruthenicum Murr. revealed by sequence-related amplified polymorphism (SRAP) markers. Biochem Syst Ecol. 2012;45:86-97.
11. Chen H, Zhong Y. Microsatellite markers for Lycium rutheni-cum (Solananeae). Mol Biol Rep. 2014;41(9):5545-8. 12. Wang S-Z, Pan L, Hu K, Chen C-Y, Ding Y. Development
and characterization of polymorphic microsatellite mark-ers in Momordica charantia (Cucurbitaceae). Am J Bot. 2010;97(8):e75-e78.
13. Vilanova S, Manzur JP, Prohens J. Development and char-acterization of genomic simple sequence repeat markers in eggplant and their application to the study of diversity and relationships in a collection of different cultivar types and origins. Mol Breeding. 2012;30(2):647-60.
14. Liu W, Lu XY, He GY, Gao X, Li MX, Wu JH, Li ZJ, Wu JH, Wang JC, Luo C. Cytosolic protection against ultravio-let induced DNA damage by blueberry anthocyanins and anthocyanidins in hepatocarcinoma HepG2 cells. Biotechnol Lett. 2013;35(4):491-8.
15. Jin H, Liu Y, Yang F, Wang J, Fu D, Zhang X, Peng XJ, Liang
XM. Characterization of anthocyanins in wild Lycium
ruthenicum Murray by HPLC-DAD/QTOF-MS/MS. Anal
Method. 2015;7:4947-56.
16. Liu J, Osbourn A, Ma P. MYB transcription factors as regu-lators of phenylpropanoid metabolism in plants. Mol Plant. 2015;8(5):689-708.
17. Reid KE, Olsson N, Schlosser J, Peng F, Lund ST. An opti-mized grapevine RNA isolation procedure and statistical determination of reference genes for real-time RT-PCR during berry development. BMC Plant Boil. 2006;6(1):27. 18. Liang C, Liu X, Yiu SM, Lim BL. De novo assembly and
characterization of Camelina sativa transcriptome by paired-end sequencing. BMC Genomics. 2013;14(1):146.
19. Wang H, Jiang J, Chen S, Qi X, Peng H, Li P, Song A, Guan Z, Fang W, Liao Y, Chen F. Next-generation sequencing of the Chrysanthemum nankingense (Asteraceae) transcriptome permits large-scale unigene assembly and SSR marker dis-covery. PloS One. 2013;8(4):e62293.
20. Grabherr MG, Haas BJ, Yassour M, Levin JZ, Thompson DA, Amit I, Adiconis X, Fan L, Raychowdhury R, Zeng Q, Chen Z, Mauceli E, Hacohen N, Gnirke A, Rhind N, di Palma F, Birren BW, Nusbaum C, Lindblad-Toh K, Fried-man N, Regev A. Full-length transcriptome assembly from RNA-Seq data without a reference genome. Nat Biotechnol. 2011;29(7):644-52.
visu-alization and analysis in functional genomics research. Bio-informatics. 2005;21(18):3674-6.
22. Ye J, Fang L, Zheng H, Zhang Y, Chen J, Zhang Z, Wang J, Li ST, Li RQ, Bolund L, Wang J. WEGO: a web tool for plotting GO annotations. Nucleic Acids Res. 2006;34(suppl 2):W293-W297.
23. Kanehisa M, Araki M, Goto S, Hattori M, Hirakawa M, Itoh M, Katayama T, Kawashima S, Okuda S, Tokimatsu T, Yamanishi Y. KEGG for linking genomes to life and the envi-ronment. Nucleic Acids Res. 2008;36(Suppl. 1):D480-D484. 24. Iseli C, Jongeneel CV, Bucher P. ESTScan: a program for
detecting, evaluating, and reconstructing potential coding regions in EST sequences. Proc Int Conf Intell Syst Mol Biol. 1999:138-48.
25. Li R, Yu C, Li Y, Lam T-W, Yiu S-M, Kristiansen K, Wang J. SOAP2: an improved ultrafast tool for short read alignment. Bioinformatics. 2009;25(15):1966-7.
26. Mortazavi A, Williams BA, McCue K, Schaeffer L, Wold B. Mapping and quantifying mammalian transcriptomes by RNA-Seq. Nat Method. 2008;5(7):621-8.
27. Benjamini Y, Yekutieli D. The control of the false discov-ery rate in multiple testing under dependency. Ann Stat. 2001;29(4):1165-88.
28. De Jong W, Eannetta N, De Jong D, Bodis M. Candidate gene analysis of anthocyanin pigmentation loci in the Solanaceae. Theor Appl Genet. 2004;108(3):423-32.
29. Zeng S, Wu M, Zou C, Liu X, Shen X, Hayward A, Liu C, Wang Y. Comparative analysis of anthocyanin biosynthesis during fruit development in two Lycium species. Physiol Plantarum. 2014;150(4):505-16.
30. Kiferle C, Fantini E, Bassolino L, Povero G, Spelt C, Buti S, Giuliano G, Quattrocchio F, Koes R, Perata P, Gonzali S. Tomato R2R3-MYB Proteins SlANT1 and SlAN2: Same Protein Activity, Different Roles. PloS One. 2015;10(8):e0136365.
31. Czemmel S, Heppel SC, Bogs J. R2R3 MYB transcription factors: key regulators of the flavonoid biosynthetic pathway in grapevine. Protoplasma. 2012;249(Suppl 2):S109-S118. 32. Ince A, Onus A, Elmasulu S, Bilgen M, Karaca M. In silico
data mining for development of Capsicum microsatellites. Acta Hortic. 2004;729:123-7.
33. Portis E, Nagy I, Sasvári Z, Stágel A, Barchi L, Lanteri S. The design of Capsicum spp. SSR assays via analysis of in silico
DNA sequence, and their potential utility for genetic map-ping. Plant Sci. 2007;172(3):640-8.
34. Nicot N, Chiquet V, Gandon B, Amilhat L, Legeai F, Leroy P, Bernard M, Sourdille P. Study of simple sequence repeat (SSR) markers from wheat expressed sequence tags (ESTs). Theor Appl Genet. 2004;109(4):800-5.
35. Thiel T, Michalek W, Varshney R, Graner A. Exploiting EST databases for the development and characterization of gene-derived SSR-markers in barley (Hordeum vulgare L.). Theor Appl Genet. 2003;106(3):411-22.
36. Shirasawa K, Ishii K, Kim C, Ban T, Suzuki M, Ito T, Muranaka T, Kobayashi M, Nagata N, Isobe S, Tabata S. Development of Capsicum EST-SSR markers for species identification and in silico mapping onto the tomato genome sequence. Mol Breeding. 2013;31(1):101-10.
37. Shirasawa K, Asamizu E, Fukuoka H, Ohyama A, Sato S, Nakamura Y, Tabata S, Sasamoto S, Wada T, Kishida Y, Tsu-ruoka H, Fujishiro T, Yamada M, Isobe S. An interspecific linkage map of SSR and intronic polymorphism markers in tomato. Theor Appl Genet. 2010;121(4):731-9.
38. Koilkonda P, Sato S, Tabata S, Shirasawa K, Hirakawa H, Sakai H, Sasamoto S, Watanabe A, Wada T, Kishida Y, Tsuruoka H, Fujishiro T, Yamada M, Kohara M, Suzuki S, Hasegawa M, Kiyoshima H, Isobe S. Large-scale develop-ment of expressed sequence tag-derived simple sequence repeat markers and diversity analysis in Arachis spp. Mol Breeding. 2012;30(1):125-38.
39. Shirasawa K, Oyama M, Hirakawa H, Sato S, Tabata S, Fujioka T, Kimizuka-Takagi C, Sasamoto S, Watanabe A, Kato M, Kishida Y, Kohara M, Takahashi C, Tsuruoka H, Wada T, Sakai T, Isobe S. An EST-SSR linkage map of Rapha-nus sativus and comparative genomics of the Brassicaceae. DNA Res. 2011;18(4):221-32.
40. Kayesh E, Shangguan L, Korir NK, Sun X, Bilkish N, Zhang Y, Han J, Song CN, Cheng ZM, Fang JG. Fruit skin color and the role of anthocyanin. Acta Physiol Plant. 2013;35(10):2879-90.