ISSN-L: 2501 - 1235 Available on-line at: www.oapub.org/edu
doi: 10.5281/zenodo.1285865 Volume 4 │ Issue 7 │ 2018
THE EFFECTS OF A 6-MONTHS PROPRIOCEPTION TRAINING
PROGRAM ON AGILITY IN YOUNG FOOTBALL PLAYERS
Dritan Adili, Dhimitraq Skenderi
Sports University of Tirana, Albania
Abstract:
group. Yet the improvement of the result is evident at the experimental group after the application of the 6 months proprioceptive training program, compared to the control group.
Keywords: proprioception training, agility, young football players
1. Introduction
The purpose of this study was to determine if proprioceptive training can be effective for improving male football players’ agility (Christou et al, 2006, Gabbett, T. et al. 2008, Sheppard & Young 2006). The 05 Agility Test (Draper 1985, Mackenzie 2005) is generally used to monitor the development of the athlete's speed and agility. (Mackenzie 2005) notes that with appropriate training between each test, the analysis would indicate an improvement in the athlete's agility and speed. The Illinois Agility Run Test (Getchell 1979, Mackenzie 2000) is generally used to monitor the development of the athlete's agility.
2. Methods
2.1 Participants
Sixty-two students (17 ± 0.3yrs) of the “Drita” high school (Kichevo, Republic of Macedonia) were recruited for this study and divided in two sub-groups [control (CG) and experimental (EXG)] to be involved in a pre- and post- training measurement design.
2.2 Procedures
All participants were football players and were attending a period of six months of football training planned with three 45-minute weekly sessions. In particular the CG (N=31) followed a standard (physical, technical and tactical) football program, while the EXG (N=31) was also exposed to specific proprioceptive drills. The effects of a proprioceptive program, if any, were assessed by means of two specific agility tests: 505 Agility Test (505AT) and Illinois Agility Test (IAT) without the ball.
2.3 Statistical Analyses
3. Results
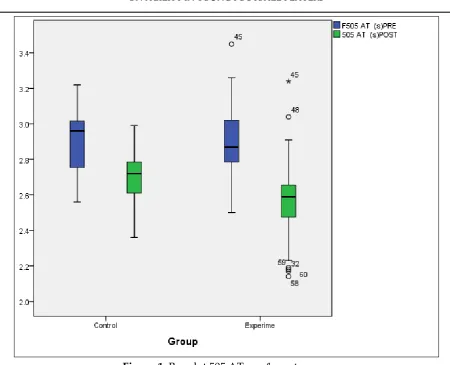
Descriptive statistics results (see table 1) provide a simple summary about the sample and the pre and post measures. The result of the initial state at the 505 AT test in the controlled group is 2.9110, whereas the final result has the value of 2.6926. On the other hand, in the experimental group, the value of the initial state of the same test is 2.8955 sec and after the 6-months training program, the result is improved and is worth 2.5658 sec.
Table 1: Descriptive Statistics Results Case Summaries
Group F505 AT (s)PRE 505 AT (s)POST IART (s)PRE IART (s)POST
Control N 31 31 31 31
Mean 2.9110 2.6926 17.5032 16.0381
Median 2.9600 2.7200 17.2900 15.8800
Std. Deviation .16026 .15792 1.41955 1.13825 Std. Error of Mean .02878 .02836 .25496 .20443
Experimental N 31 31 31 31
Mean 2.8955 2.5658 18.1761 16.3803
Median 2.8700 2.5900 18.1000 16.1300
Std. Deviation .21017 .24732 1.50604 1.42212 Std. Error of Mean .03775 .04442 .27049 .25542
Total N 62 62 62 62
Mean 2.9032 2.6292 17.8397 16.2092
Median 2.9200 2.6300 17.6950 16.0850
Std. Deviation .18551 .21548 1.49050 1.28902 Std. Error of Mean .02356 .02737 .18929 .16371
Repeated Measure for ANOVA Illinois 505 test are presented in the following table.
Table 2: Repeated Measure for ANOVA Illinois 505 test
Source factor1 Type III Sum of Squares df Mean Square F Sig. factor1 Linear 2.328 1 2.328 201.040 .000
factor1 * Group Linear .096 1 .096 8.290 .006
Error(factor1) Linear .695 60 .012
Figure 1: Boxplot 505 AT pre & post scores
Repeated Measure ANOVA for IART is presented in the following table:
Table 3: Repeated Measure for ANOVA IART
Boxplot for IART pre and post scores (Figure 2) was used to give information regarding the shape, variability, and center of the two data sets.
Source factor1 Type III Sum of Squares df Mean Square F Sig. factor1 Linear 82.413 1 82.413 253.294 .000
factor1 * Group Linear .847 1 .847 2.604 .012
Figure 2: Boxplot for IART pre & post scores
The results revealed a significant difference between pre and post measures in 505 AT (p<0.05). The result of the initial state at the IAT test in the control group is 17.5032 sec whereas the final result has the value 16.0381sec. On the other hand, in the experimental group, the value of the initial state of the same test is 18.1761 sec and after the 6-months training program, the result is improved and is worth 16.3803 sec.
4. Conclusions
experimental group. But at the IAT test in both states the control group has somewhat better results compared to the experimental group. Yet the improvement of the result is evident at the experimental group after the application of the 6 months proprioceptive training program, compared to the control group.
References
1. Christou, M., Smilios, I., Sotiropoulos, K., Volaklis, K., Pilianidis, T., and Tokmakidis, S.P. (2006). Effects of resistance training on the physical capacities of adolescent soccer players. Journal of Strength Condition Research, 20: 783-791. 2. Gabbett, T. et al. (2008) Speed, change of direction speed, and reactive agility of
rugby league players. The Journal of Strength & Conditioning Research, 22 (1), p. 174-181
3. Getchell, G. (1979) Physical Fitness a way of life, 2nd ed. New Jersey, John Wiley and Sons
4. Mackenzie, B. (2005) 505 Agility Test [WWW] Available from:
https://www.brianmac.co.uk/agility505.htm [Last Retrieved 3/09/2017]
5. Mackenzie, B. (2000) Illinois Agility Run Test [WWW] Available from:
https://www.brianmac.co.uk/illinois.htm [Last Retrieved 1/09/2017]
6. Miller, M. G., Herniman, J. J., Ricard, M. D., Cheatham, C. C., & Michael, T. J. (2006). The effects of a 6-week plyometric training program on agility. Journal Of Sports Science & Medicine, 5(3), 459-465.
Creative Commons licensing terms