Sharif University of Technology
Scientia IranicaTransactions C: Chemistry and Chemical Engineering www.scientiairanica.com
Research Note
The construction and application of a simplied pore
network model based on computerized tomography
Y.T. Xie
a;, Z.H. Chen
band Z.M. Du
ba. State Key Lab of Oil and Gas Reservoir Geology and Exploitation, Southwest Petroleum University, Chengdu, China. b. School of Oil & Natural Gas Engineering, Southwest Petroleum University, Chengdu, China.
Received 11 April 2015; received in revised form 1 October 2015; accepted 2 February 2016
KEYWORDS Pore network model; Flow capacity; Non-linear ow; Computerized tomography.
Abstract. A simplied pore network model, which divided pore structure into cube lattices, was developed based on the digital core extracted from micro computerized tomography (-CT) in this study. It rolled the complex topology and connectivity of pore structure into adjacent cubes. The static property of each cube was determined by the statistic CT data. The connectivity of adjacent cubes and ow regime were determined by the capillary pressure dierence which is a function of tunnel size, interfacial tension, wet contact angle, and external pressure gradient. In this simplied pore network model, the ow capacity properties are determined by number and size distribution, mobile tunnels, and uid viscosity. The ow velocity and sweep eciency are non-linear as mobile tunnels increase nonlinearly with increasing driving force before all tunnels start owing. The critical pressure gradient that changed the non-linear ow to linear ow was performed as the threshold pressure gradient. The dynamic mobile performance of Oil In Place (OIP) is determined by the number of mobile tunnels and their diameter distribution for dierent pressure gradients. The relationship of microscopic sweep eciency, water cut, and pressure gradient to oil recovery can be quantied by ow simulation in this pore network model. © 2016 Sharif University of Technology. All rights reserved.
1. Introduction
The formation ow capacity is a crucial factor in well productivity and ultimate oil eld development eciency from a theoretical seepage perspective [1]. Flow capacity depends on the rock permeability and uid viscosity. Small core samples are usually drilled from a full diameter core obtained from the target payzone in the reservoir. The samples are used in laboratory experiments after a series of procedures such as washing, drying, and saturating. The in-situ absolute permeability under dierent overburden pressures and the relative permeability performance
*. Corresponding author. Tel.: +86 13438353246; Fax: +86 028 83033316
E-mail address: [email protected] (Y.T. Xie)
under dierent phase saturations are measured in core ooding experiments via changes in temperature, pres-sure, and uid saturation. These evaluation methods may not be suitable for heavy oil reservoir [2]. Most of the formation in heavy oil reservoirs is weakly consolidated and may even be unconsolidated. It is dicult to obtain a standard complete cylindrical core from the target layer using the routine coring barrel. In the small core drilling process, the rock skeleton structure suers structure damage due to the vibration in the sample drilling process. Liquid nitrogen is typically used to freeze loose rock, but the volume expansion of the ice formed from the connate water can change the micro-structure in porous media. During the core washing, drying, and uid saturation processes, the lead sheath or heat shrinkable sleeve used to maintain the loose core integrity cannot guarantee
that the inner structure remains intact [3-5]. For core analysis experiments, a conning pressure, 1-1.5 MPa, greater than the inow pressure is needed to maintain seal in core surface and inner wall of core tank [6]. The radial deformation, caused by sealing procedure, in combination with the internal rock skeleton structure damage, caused by uid dis-placement, leads to erroneous analysis of experimental results.
Meanwhile, the development of computational methods to analyze the 3-dimensional (3D) structure of pore networks has made signicant advances with the advent of X-ray micro computerized tomography (-CT) which allows for the visualization of the internal structure of a rock sample at the micron scale [7-11]. There are no obstacles to obtaining high quality images of the spatial microscopic structure of unconsol-idated rock samples without causing any damage [12]. Petrophysical properties such as sound speed, electrical properties, nuclear magnetic resonance response, and ow characteristics that are usually derived from lab-oratory experiments can now be simulated using CT images [13-14].
Pore scale modelling is another method to de-scribe internal rock structure and study multiphase ow and transport in porous media. It was rst introduced by Fatt in the 1950s in his tubes network model [15]. To simplify operations, he replaced the three-dimensional network by a two-dimensional net-work. Within that model, he calculated the capillary pressure curve and obtained pore size distribution. Since then, many scholars have put lots of eorts on the construction and application of pore network model. Percolation theory was used to describe multiphase ow properties [16-17]. Micro model experiments were used for parameters adjustment. Permeability, wettability, interfacial area, dissolution rate, rela-tive permeability, mass transfer coecient, and many other physical properties have been predicted [18-25]. Geometry, spatial correlation, and other topological characteristics have been discussed in description of the pore space. Matching geometric parameters with available experiments to build a regular network model or directly modeling the random topology of the pore space were two mainstreams in 1990s [26-28]. Both of them faced limitation; regular network model is limited in prediction because the coordination of data with experiments is non-unique and essential features of the pore space are missing; while, random network models would have similar ow properties if the grain size distributions inferred from thin section analysis were similar to each other [29].
Reconstruction of pore network from -CT-scanning images has been studied [30-34]. Com-putational Fluid Dynamics (CFD) method was the direct method in pore-scale modeling to simulate the
uid ow by solving the Navier-Stokes equations in 2000s [35]. The dimensions of CT images were more than 1000 1000 1000 voxels. A pore network based on these images, without simplication, represents a large data set which requires a large amount of memory in CFD application [36]. Due to irregular uid-solid boundaries and the deformability of uid-uid inter-faces, direct models are computationally expensive and may not be suitable for studying uid ow [37]. With the introduction of more sophisticated seepage theories in conventional reservoirs and more unconventional reservoirs being developed, non-linear ow phenomena and their governing mechanisms are receiving increased attention. The pore network modeling technology based on -CT image post-processing has gradually be-come one of the main technologies and methods used in the oil industry [38]. Reconstructing the pore structure from -CT scan images more accurately, modeling the pore network more reasonably, and simulating the uid ow of the pore network more eciently continue to be the main objectives in this eld.
This study aimed at developing a pore network that characterized reservoir rocks more eciently and simulated the uid ow process dominated by the combined eects of capillary pressure, viscous forces, and driving pressure within the pore networks. High resolution CT scan was conducted on the core samples obtained from the target layer. The pore spatial location and the pore structure parameters were ex-tracted. Connectivity of each pair of adjacent cubes was investigated under certain condition. A Cartesian coordinate overlapped the sample unit and it was divided into 1000 1000 1000 blocks. The porosity of each block was calculated from the size and location of each pore. Oil and water two-phase hydrodynamic balance was checked in each connected tunnel to determine the ow ability. The multi-pipe Poiseulle's law and Darcy's equation were applied to calculate the eective permeability that indicated the ow capacity of this scan rock sample. The dynamic eective ow parameters and the non-linear ow mechanism were studied through applying the above procedures in dierent external pressure gradients and dierent oil and water saturations. The methodology may then be applied to oil development processes such as studying the ow properties and non-linear ow mechanisms for dierent external pressure gradients and dierent water saturations. This will help to validate the 3D description of irreducible oil and to predict the changes in the recoverable reserves.
2. Procedures of modelling 2.1. Obtaining the digital core
Data applied in this pore network model was originally based on -CT scan of actual rock samples from Bohai
Bay with a resolution of approximately 10 m. Dier-ent mineral types and subject thicknesses in rock were reected by the X-ray in variable energy attenuation. The intensity of X-ray was measured after it penetrated the rock sample and then the absorption coecient was calculated. The two-dimensional (2D) micro-structure of matrix and pores in a rock slice was extracted from 2D images and then the 3D micro-structure was reconstructed by image processing algorithms of the projection slices in the same direction. Each 3D pore was described by the maximum ball method. Then, the size and spatial location of each pore were compiled into data sets. The data sets associated with the microscopic pore structure in the rock sample are the so-called digital core.
2.2. Model description 2.2.1. Model construction
The rock model was constructed by stacked particles with dierent sizes, shapes, and contact relationships. The diameters and connectivity of the inside tunnel network were variously dependent on particle sizes. The status of both ow regime and ow rate depends on the balance between capillary pressure dierence which is a function of tunnel size, interfacial tension, wet contact angle, and external pressure gradient. 2.2.2. Model assumptions
There was no absolutely dead end tunnel in the rock;
The size and connectivity of a tunnel depended on particle size;
There was no rock deformation during the produc-tion period;
The surface of rock tunnels was completely water wet;
All tunnels were initially saturated with water;
The inside tunnel network was saturated with water and oil;
The ow was assumed to be laminar. 2.2.3. Flow process
The external pressure gradient arises either from buoy-ancy due to the density dierence between oil and water or from the pressure drawdown of production well. If the external pressure gradient is higher than the threshold pressure in the largest tunnel in the pore network, the uid initially starts owing through that tunnel. With increase in driving pressure, uid starts owing in the smaller tunnel. As a result, the volumetric sweep eciency in the pore network increases and the ow capacity of rock is enhanced. Therefore, the apparent ow velocity, which is the function of ow section area, is non-linear since the ow section area increases as more tunnels are involved.
2.2.4. Saturation history
During the hydrocarbon accumulation period, some tunnels were gradually displaced by the oil with lighter density under the action of buoyancy. Meanwhile, the others were still saturated with water since the buoyancy was less than the threshold pressure. The oil displaced by water in each tunnel obeyed the sequence of resistance from small to large. At the end of water ooding, all pores were saturated with water, completely.
2.3. Construction of digital core
The setting of CT-scanning resolution aects the image clarity and the accuracy of pore structure identica-tion. With higher resolution setting, the intensity and penetrability of X-ray will be higher and stronger. Improper resolution setting may bring in overexpo-sure or underexpooverexpo-sure that result in poor imaging of pore structure inside a rock sample. The grain size-distribution of target rock sample ranges from 20 to 300 m, then the scanning resolution should be set at 10 m.
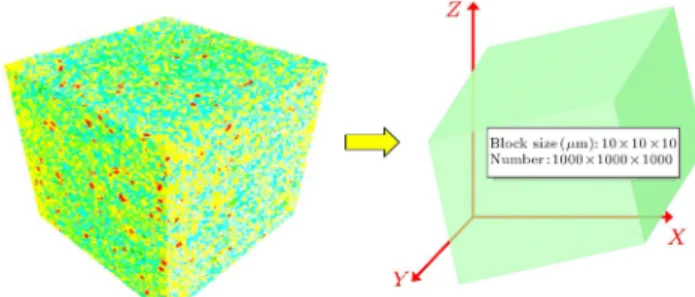
After CT-scanning of the rock sample, a three-dimensional Cartesian coordinate system, correspond-ing to the in-situ ow direction in the reservoir, is created. The diameter of core plug is 2.5 cm. To exclude the impact of cutting process on inner pore structure, the center of scanning area is placed at the core of the rock sample and the scanning area is set as a cube with 1 cm of length of edge. Based on the 10 m scanning resolution and 1 cm length of the scanning area, the digital core unit is divided into 1000 1000 1000 blocks. The edge length of each cube is 10 m (Figure 1).
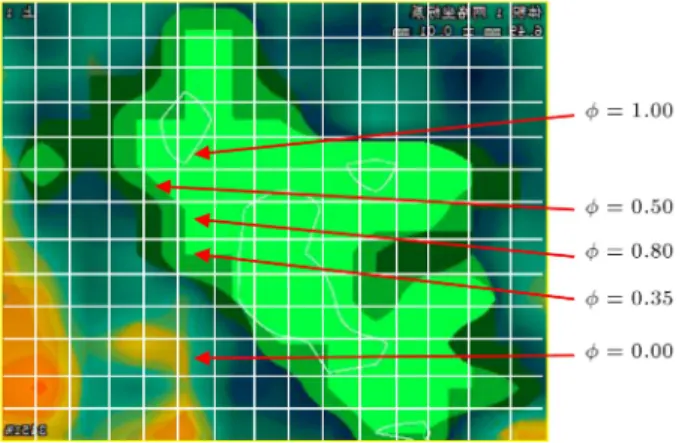
The porosity of the digital core is dened as the ratio of identied pore volume to the total volume of scanning area. The porosity of each block is based on the size and location of each recognized pore in the digital core (Figure 2). Equivalent sphere should be used to identify the radius and location of each pore from each 2D scanning image. Eq. (1) is applied to calculate porosity of the 3D digital core. The threshold of pore color is determined by the digital core porosity tted with rock porosity from experiment.
The connectivity between blocks i 1 and i + 1 is
Figure 2. Porosity in the blocks.
Figure 3. Connection between blocks.
Figure 4. Flow status in a tunnel of varying diameters.
determined by the radius of a cylinder whose volume is equal to block i (Figure 3). If the porosity of block i is greater than 0, blocks i 1 and i + 1 will be connected. If the porosity of block i 1 is equal to the porosity of block i + 1, the radius of the cylinder-connected blocks i 1 and i + 1 will be the same at each end, which means there is no ow resistance between blocks i 1 and i + 1.
Otherwise, the radius of the cylinder-connected blocks i 1 and i + 1 will be dierent at each end. The ow resistance can be calculated by Eq. (5). The capillary pressure dierence is the resistance in a water wet tunnel of varying sizes (Figure 4). Only when the
driving pressure gradient overcomes the ow resistance will the uid start owing.
2.4. Flow parameters calculation
Based on the geometry of each tunnel in the block system of the digital core, the porosity of the pore network unit is dened as:
= Pn
i=1r2iiL
L =
n
X
i=1
r2
ii: (1)
The total ow rate of all tunnels in cross-section is expressed, using Poiseulle's law, as:
q = 8
n
X
i=1
ar4
i
P
L: (2)
Substituting Eq. (2) into Darcy's equation, the perme-ability of the pore network unit can be expressed as:
K =Aq LP =
8
Pn
i=1
ar4
i P L
A
L P =8
n
X
i=1
r4 i
i: (3)
The relationship between porosity and permeability is given as:
K ='8 Xn
i=1
r
2
i: (4)
The capillary pressure between each pair of connected blocks is given as:
Pc= 2owcos ow
1 r1
1 r2
: (5)
2.5. Flow capacity evaluation
For the underground reservoir, the pressure gradient increases gradually from 0 to a steady value with the increased well production. For pore network model, the capillary pressure was calculated by Eq. (5) for each pair of connected blocks in ascending order. The blocks that have a capillary pressure lower than the driving pressure but have not been displaced are identied. The driving pressure increases and the searching pro-cess is repeated until no more blocks can be displaced. This is the process of pressure propagation in the pore network model.
The curve for the number of mobile tunnels can be obtained using the number of all the involved blocks for dierent driving pressures.
The eective permeability of each phase is cal-culated by Eq. (3) based on the size of all mobile tunnels saturated with the given phase. Based on
microscopic oil-water two phase displacement process, sweep eciency under dierent pressure gradients and eective permeability at variable water saturation can be determined.
Applying Eq. (2) can get the ow velocity in pore network model. The ow velocity in one pore network unit is converted to apparent ow velocity in a rock sample (dividing ow velocity by cross-sectional area) for analysis of the relationship between the apparent ow velocity and the external pressure gradient. The relation of ow velocity to pressure gradient is nonlin-ear before all the tunnels start owing. The threshold pressure gradient and the initial pressure gradient of the linear ow were determined when all the tunnels in the pore network were mobile.
The pore volume percentage in the mobile area and its contribution to oil recovery were calculated for dierent driving pressures. The additional driving pressure gradient required to increase the recovery factor was predicted based on the amount of reserves available at each pressure gradient level. Water ood-ing process in pore network model was simulated by increasing driving pressure. The simulated results of how oil recovery changed with water cut increase can be used to evaluate the EOR potential. Based on parallel-pipe ow principle { the ow velocity in the pipe is proportional to the square of pipe diameter { the elapsed time to reach a given recovery factor corresponding to a particular pressure gradient can be calculated.
3. Case study and discussion 3.1. Geometric characteristics
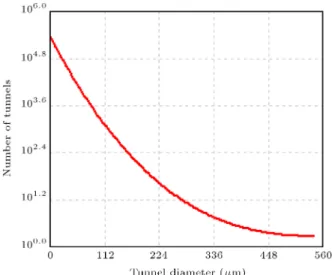
The data of digital core based on CT-scanning of target layer rock sample shows that there is a reciprocal relationship between number of tunnels and tunnel diameter (Figure 5). The relationship between the pore
Figure 5. Tunnel diameter distribution.
Figure 6. Distribution of tunnel volume.
volume and tunnel diameter resembles a skewed normal distribution (Figure 6), which agrees with core lab experiments. Many core particle size tests show that the size of mineral particles in rock sample is roughly normally distributed and the number of particles is exponentially distributed.
Controlled by lithology of parent rocks, deposition and diagenesis, reservoir formation is heterogeneous and anisotropic. The size, space form, and connectivity of pores in porous media are complex to describe mathematically. Applying statistics from digital core can be used as an alternative method. The statistics of digital core show that there are more small pores than large ones in the rock, but the total volume is smaller. Medium size pores own the largest number and occupy most of the volume of the rock sample. All these characteristics will aect the storage and ow capacity of a reservoir.
3.2. Flow properties and ow regime
Based on the method described in Section 2 and the statistics of digital core from CT-scanning, the pore network model of rock sample has been built using the percolation theory described in Section 2 to calculate the ow capacity and simulate the ow process in the pore network model. The pore network simulation shows that the number of mobile tunnels and the microscopic sweep eciency start at zero and increase with higher driving pressure gradients (Figures 7 and 8). Tunnels with larger diameter turn to mobile more easily than smaller ones that have a higher resistance. As a result, the ow is non linear in porous media like rocks that are characterized by variable pore size and connectivity. Figure 9 shows that the permeability gradually increases with increase in the pressure gradient. It plateaus at the absolute permeability if no more tunnels can become mobile and contribute to the ow capacity in the porous network as the driving pressure increases. Figure 10 shows
Figure 7. Ratio of mobile tunnels.
Figure 8. Volumetric sweep eciency.
Figure 9. Eective permeability.
that the apparent ow velocity changes from standstill through a non-linear regime to a linear ow regime as the driving pressure gradient is increased.
3.3. Recoverable reserves during pressure depletion
The in-situ pressure continuously decreases with the pressure decrease propagating from the drawdown
Figure 10. Non-linear ow mechanism.
Figure 11. Maximum driven pressure gradient.
point to the remaining portions of the reservoir. From a microscopic point of view, large tunnels become mobile rst followed by smaller tunnels. At any moment, the recoverable reserve is the total amount of oil in each mobile tunnel in the pore network. The dynamic mobile performance of Oil In Place (OIP) was studied based on the number of mobile tunnels and their diameter distribution for dierent pressure gradients. Figure 11 shows that the pressure gradient required to achieve a given amount of recovery for dierent microscopic volumetric sweep eciencies. A lower pressure gradient is required to reach the same recovery factor for lower sweep eciencies, since the larger tunnels have a higher oil content and lower resistance to becoming mobile. As shown in Figure 12, a higher microscopic sweep eciency is achieved if more small tunnels are mobile at higher pressure gradients.
The microscopic mechanism can explain how reservoirs with a higher porosity and permeability can achieve a higher recovery using a lower production drawdown. In addition, the production rate
dramati-Figure 12. Minimum mobile tunnels.
cally decline in low-mobility reservoirs such as heavy oil and compact reservoirs. This is because the eective in-situ ow capacity in this kind of reservoir is lower than those in the laboratory. As a result, only larger tunnels are mobile for lower sweep eciencies and mobile area. In this situation, oil recovery can be enhanced using the mobility of smaller tunnels by applying higher pressure gradients through production well inll and an increase in production drawdown.
3.4. Recoverable reserves during water displacement
The saturation and distribution of connate water formed during hydrocarbon accumulation are depen-dent on the viscosity and density of oil and the diameters of tunnels of the rock. Oil initially satu-rates tunnels of larger diameter and good connectivity. Therefore, smaller tunnels with poor connectivity are saturated with water. Initial oil migration simulations show that the saturation and distribution of connate water vary based on oil viscosity and pore size (Fig-ure 13).
A higher oil viscosity leads to a higher initial water saturation and a lower initial mobility of oil, as shown in Figure 14. The results of the simulations
Figure 14. Relative permeability (Kr) at dierent oil viscosities.
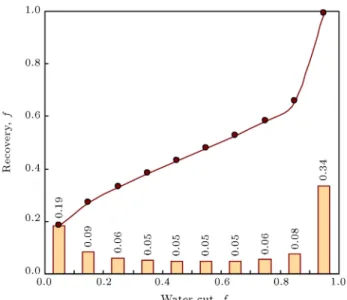
show that oil and water coexist in the heterogeneous reservoir. There is initially connate water in heavy oil reservoir. This means that there is no unied oil and water contact surface and no piston-like displacement even in this microscopic pore network. Connate water will be mobile and will be produced when the pressure gradient is greater than the resistance in the tunnels. This is governed by capillary pressure dierence in tunnels with varying diameters. During water ooding, the mobile water will rst access the largest tunnel in a pore node with dierent ow directions and tunnel diameters, then enter the second largest tunnel at a higher pressure gradient. This dynamic process is quantitatively and visually simulated by the current pore network model and the relationship between the water cut and recovery is shown in Figure 15. In the rock model unit, the largest tunnels are rst displaced by water until the water cut reaches 0.1 and the oil recovery is 0.19 which corresponds to the oil content in the tunnels. As the pressure gradient increases, the oil in smaller mobile tunnels is displaced by water and more oil is produced by water ooding, as shown in
Figure 15. Period of recovery, decimal, during water cut.
Figure 15. The water cut increases to 0.2 and the oil recovery increases to 0.28. The relationship between the water cut and oil recovery is non-linear because the size distribution and connectivity in tunnels are non-uniform. The residual oil saturation is 0.34 and the water cut reaches 1.0. Therefore, it can be concluded that the amount of oil stored in the non-mobile smaller tunnels at this pressure gradient is signicantly higher than that in larger ones. The oil recovery can be enhanced by increasing the pressure gradient to improve the sweep eciency.
3.5. Performance of oil recovery
In the current microscopic pore network model, the dimensionless production period is dened as the ratio of the end time of displacement in the smallest tunnel to the end time in the largest tunnel. Compared to a large-scale reservoir, the end time of displacement in the largest tunnel can be regarded as the period of water breakthrough into production well. Hence, the production period to reach a certain recovery can be based on the dimensionless time.
Simulations were performed for three rock sam-ples with average permeability values of 193 mD, 482 mD, and 1066 mD. The results show that the recovery will reach 0.37, 0.40, and 0.45 after 20 production periods and will reach 0.52, 0.57, and 0.63 after 40 production periods. Theoretically, the oil recovery could reach 0.80 in the dimensionless production periods of 83, 102, and 132 for each rock sample, respectively (Figure 16). This shows that a higher recovery can be achieved in a reservoir with higher permeability and over a shorter production time. As development continues, the recovery increment will gradually slow down since the produced oil mainly comes from smaller tunnels with poor connectivity during pressure depletion and water ooding. In the
Figure 16. Maximum recovery at dierent dimensionless production period.
pay layer of the reservoir, it is a reasonable assumption that the in-situ pressure gradient due to production is greater than buoyancy. Therefore, it is theoretically possible to recover 100% of the oil as each tunnel that has been lled with oil can be displaced with water. However, this is not the case in practice, because the development life cycle is limited due to technological constraints, economical factors, the lease period, and other factors. The optimized production rate can be estimated using the proposed methodology based on the development, cost, and prot targets.
4. Conclusions
1. As an alternative of laboratory core experiments, pore network model, based on micro Computerized Tomography (-CT), can be used to determine porosity, permeability, and ow capacity properties (relative permeability, ow velocity, sweep e-ciency, etc.) of a rock sample;
2. The simplied pore network model was built to characterize the pore structure of reservoir rock and simulate the transport in such porous media, more eciently. It rolls the complex topology and connectivity of pore structure into adjacent cubes. The static property of each cube is determined by the statistics of CT data. The connectivity and ow regime are determined by the capillary pressure dierence of adjacent cubes. The pressure dierence is a function of tunnel size, interfacial tension, wet contact angle, and external pressure gradient;
3. In this simplied pore network model, the ow ca-pacity properties are determined by the number and size distribution, mobile tunnels, and uid viscosity.
The ow velocity and sweep eciency are non-linear as the mobile tunnels increase nonnon-linearly with increase in driving force before all tunnels start owing. The critical pressure gradient that changed the non-linear ow to linear ow was performed as the threshold pressure gradient;
4. The dynamic mobile performance of Oil In Place (OIP) is determined by the number of mobile tunnels and their diameter distribution for dierent pressure gradients. Higher microscopic sweep e-ciency can be achieved as more small tunnels are available at higher pressure gradients;
5. Since oil and water coexist in the heterogeneous reservoir, there is no unied oil and water contact surface and no piston-like displacement even in mi-croscopic pore network. The relationship between the water cut and oil recovery is non-linear because the size distribution and connectivity in tunnels are non-uniform. However, oil recovery is roughly proportional to the pressure gradient increment. It can be quantied by ow simulation in this pore network model. The production period to reach a certain recovery can be based on the dimensionless time;
6. In further studies, specic micrometer-scale core experiments are needed to verify the method. More tting methods are needed to improve the accuracy of simulation of pore network model.
Acknowledgment
The authors are grateful for the nancial support of Open Fund Project (No. CCL2013RCPS0235GNN) provided by the State Key Laboratory of Oshore Oil Exploitation of China.
Nomenclature
A Cross-sectional area of pore network unit, cm2
a Tunnel cross-sectional area, cm2
K Permeability, m2
N; n Area density of tunnels, m 2
q Volumetric ow rate, cm3/s
r; r1; r2 Tunnel radius, cm
Swc Connate water saturation, %
L Length of core and length of pore network unit, cm
P; P d Displacement pressure, MPa P c Capillary pressure dierence, MPa Tunnel tortuosity, dimensionless
Porosity, %
ow Oil-water interfacial tension, N/m
ow Wetting contact angle, angle
Viscosity, mPa.s
References
1. Aghaei, A. and Piri, M. \Direct pore-to-core up-scaling of displacement processes: Dynamic pore network modeling and experimentation", Journal of Hydrology, 522, pp. 488-509 (2015).
2. Kaviani, D. and Jensen, J.L. \Reliable connectivity evaluation in conventional and heavy oil reservoirs: A case study from Senlac heavy oil pool", In Proceed-ings of the Canadian Unconventional Resources and International Petroleum Conference, Alberta, Canada. SPE-137504-MS (2010).
3. Torabi, F., Zarivnyy, O. and Mosavat, N. \Developing new Corey-based water/oil relative permeability cor-relations for heavy oil systems", In Proceedings of the SPE Heavy Oil Conference-Canada, Alberta, Canada. SPE-165445-MS (2013).
4. Mattax, C., Mckinley, R. and Clothier, A. \Core anal-ysis of unconsolidated and friable sands", Journal of Petroleum Technology, 27(12), pp. 1423-1432 (1975).
5. Bretz, R.E., Specter, R.M. and Orr Jr, F.M. \Eect of pore structure on miscible displacement in laboratory cores", SPE Reservoir Engineering, 3(03), pp. 857-866 (1988).
6. Musin, K., Khisamov, R. and Dinmuhamedov, R. \Solution to problem of evaluation of unconsolidated heavy oil reservoirs in tatarstan", In SPE Russian Oil and Gas Conference and Exhibition., Society of Petroleum Engineers (2010).
7. Professional committee for standardization of oil and gas eld development, The Oil and Gas Industry Stan-dard of the People's Republic of China-SY/T 5336-1996-Method of Core Routine Analysis, China national petroleum corporation (1996).
8. Honarpour M.M., Cromwell V., Hatton D., et al. Reservoir Rock Descriptions Using Computed Tomog-raphy (CT). In SPE Annual Technical Conference and Exhibition, Society of Petroleum Engineers (1985).
9. Pierret, A. and Moran, C. \Quantication of orienta-tion of pore patterns in x-ray images of deformed clay", Microscopy Microanalysis Microstructures, 7, pp. 421-431 (1996).
10. Okabe, H. and Blunt, M.J. \Pore space reconstruction using multiple-point statistics", Journal of Petroleum Science and Engineering, 46, pp. 121-137 (2005).
11. Maga~na, B.O., Domnguez, J.D., Ruelas, R., Tarquis, A.M., Gomez-Barba, L. and Andina, D. \Identication of pore spaces in 3D CT soil images using PFCM partitional clustering", Geoderma, 217-218, pp. 90-101 (2012).
12. Likos, W.J. \Quantication of grain, pore, and uid microstructure of unsaturated sand from x-ray com-puted tomography images", Geothechnical Testing Journal, 35(6), pp. 911-923 (2012).
13. Elliott, J.C. and Dover, S.D. \X-ray micro-tomography", Journal of Microscopy, 126, pp. 211-213 (1982).
14. Dvorkin, J., Fang, Q. and Derzhi, N. \Etudes in computational rock physics: Alterations and bench-marking", Geophysics, 77(3), pp. D45-D52 (2012).
15. Youssef S., Rosenberg E., Kenter J., et al. \High res-olution CT and pore-network models to assess petro-physical properties of homogeneous and heterogeneous carbonates", In SPE/EAGE Reservoir Characteriza-tion and SimulaCharacteriza-tion Conference., Society of Petroleum Engineers (2007).
16. Fatt, I. \The network model of porous media I. Capillary pressure characteristics", Trans AIME, 207, pp. 144-159 (1956).
17. Koplik, J. \Creeping ow in two-dimensional net-works", Journal of Fluid Mechanics, 119, pp. 219-247 (1982).
18. Wilkinson, D. and Willemsen, J.F. \Invasion percola-tion: A new form of percolation theory", Journal of Physics A: Mathematical and General, 16(14), p. 3365 (1983).
19. Larsen, J.K., Bech, N. and Winter, A. \Three-phase immiscible WAG injection: Micromodel experiments and network models", In SPE/DOE Improved Oil Recovery Symposium., Society of Petroleum Engineers (2000).
20. Lenormand, R., Zarcone, C. and Sarr, A. \Mechanisms of the displacement of one uid by another in a network of capillary ducts", Journal of Fluid Mechanics, 135, pp. 337-353 (1983).
21. Fenwick, D.H. and Blunt, M.J. \Three-dimensional modeling of three phase imbibition and drainage", Advances in Water Resources, 21(2), pp. 121-143 (1998).
22. Thauvin, F. and Mohanty, K.K. \Network modeling of non-Darcy ow through porous media", Transport in Porous Media, 31(1), pp. 19-37 (1998).
23. Blunt, M.J. \Physically-based network modeling of multiphase ow in intermediate-wet porous media", Journal of Petroleum Science and Engineering, 20(3), pp. 117-125 (1998).
24. Fischer, U. and Celia, M.A. \Prediction of relative and absolute permeabilities for gas and water from soil water retention curves using a pore-scale network model", Water Resources Research, 35(4), pp. 1089-1100 (1999).
25. Man, H.N. and Jing, X.D. \Network modelling of wettability and pore geometry eects on electrical re-sistivity and capillary pressure", Journal of Petroleum Science and Engineering, 24(2), pp. 255-267 (1999).
26. Lerdahl, T.R., Oren, P.E. and Bakke, S. \A predictive network model for three-phase ow in porous media", In SPE/DOE Improved Oil Recovery Symposium., So-ciety of Petroleum Engineers (2000).
27. Jerauld, G.R. and Salter, S.J. \The eect of pore-structure on hysteresis in relative permeability and capillary pressure: Pore-level modeling", Transport in Porous Media, 5(2), pp. 103-151 (1990).
28. Bryant, S.L., King, P.R. and Mellor, D.W. \Network model evaluation of permeability and spatial correla-tion in a real random sphere packing", Transport in Porous Media, 11(1), pp. 53-70 (1993).
29. Hilpert, M. and Miller, C.T. \Pore-morphology-based simulation of drainage in totally wetting porous me-dia", Advances in Water Resources, 24(3), pp. 243-255 (2001).
30. Dong, H. and Blunt, M.J. \Pore-network extraction from micro-computerized-tomography images", Phys-ical Review E StatistPhys-ical Nonlinear & Soft Matter Physics, 80(2), pp. 1957-1974(2009).
31. Delerue J.F., Perrier E., Yu Z.Y., et al. \New algo-rithms in 3d image analysis and their application to the measurement of a spatialized pore size distribution in soils", Physics and Chemistry of the Earth, Part A: Solid Earth and Geodesy, 24(99), pp. 639-644 (1999).
32. Zhang X.H, Q. J, X. B. \Comparisons of static, quasi-static and dynamic 3D porous media scale net-work models for two-phase immiscible ow in porous media", New Trends in Fluid Mechanics Research, Springer Berlin Heidelberg, pp. 530-533 (2009).
33. Al-Kharusi, A.S. and Blunt, M.J. \Network extraction from sandstone and carbonate pore space images", Journal of Petroleum Science and Engineering, 56, pp. 219-231 (2007).
34. Raoof, A. and Hassanizadeh, S.M. \A new method for generating pore-network models of porous media", Transport in Porous Media, 81, pp. 391-407 (2010).
35. Jiang, Z., Dijke, M.I.J.V., Wu, K., et al .\Stochastic pore network generation from 3D rock images", Trans-port in Porous Media, 94(2), pp. 1-23 (2011).
36. Schena G., Favretto S., Piller M., et al. \Pore space characterisation and permeability prediction using fast network extraction and pore throat conductance cal-culation", In 70th EAGE Conference and Exhibition Incorporating SPE EUROPEC (2008).
37. Marcke, P.V., Verleye, B., Carmeliet, J., et al. \An improved pore network model for the computation of the saturated permeability of porous rock", Transport in Porous Media, 85, pp. 451-476 (2010).
38. Aghaei, A. and Piri, M. \Direct pore-to-core up-scaling of displacement processes: Dynamic pore network modeling and experimentation", Journal of Hydrology, 522, pp. 488-509 (2015).
Biographies
Yiting Xie was born in 1987. She is a PhD candidate in the Department of Petroleum and Nature Gas Institute at Southwest Petroleum University, Chengdu, China. She has worked as a part-time sta member in
Titan-Petro Ltd. since 2013. She has been studying porous media ow mechanism experiments and mathe-matic modeling, sand management production control, reservoir numerical simulation, and well production optimization for more than 6 years.
Zhaohui Chen was born in 1970. Dr. Chen is technical director of Titan-Petro Ltd. and a reservoir engineer with more than 20 years of experience in research and oil/gas eld development planning and reservoir evaluation. Also, he has assisted clients to make the most protable reservoir development strategy and worked on underbalanced drilling design, sand management production control, integrated ge-omechanical reservoir simulation, well production opti-mization, EOR, and geomechanical laboratory testing.
He has extensive experience in development of loosen sand heavy oil reservoir and loosen sand multi-layer gas reservoirs.
Zhimin Du was born in 1953. She is the Professor of Petroleum and Nature Gas Institute and the former president of Southwest Petroleum University, Chengdu, China. She received her BSc in Oil Production En-gineering from Southwest Petroleum Institute in 1978 and was a fellow at Germany's Clausthal Technical University from 1985 to 1988. Her research interests include a broad area of topics in the theories and application of complex oil gas reservoirs development. Recently, she has been focusing on grid simulation and parallel computation of fractured oil reservoir based on unstructured hexahedral