Application of a Compact Genetic Algorithm
to Pipe Network Optimization Problems
M.H. Afshar
1Abstract. This paper presents the application of a compact Genetic Algorithm (cGA) to pipe network optimization problems. A compact genetic algorithm is proposed to reduce the storage and computational requirements of population-based genetic algorithms. A compact GA acts like a standard GA, with a binary chromosome and uniform crossover, but does not use a population. Instead, the cGA represents a virtual population for a binary GA by a vector of probabilities representing the chance that the optimal solution has a one at each bit position. The application of the cGA to pipe network optimization problems is considered in this paper and the results are presented for two benchmark examples and compared with existing solutions in the literature. The results show the ability of the cGA to locate the optimal solution of problems, considered with a computational eort, comparable to improved population-based GAs and with much fewer storage requirements.
Keywords: Pipe networks; Optimal design; Compact genetic algorithm.
INTRODUCTION
Genetic Algorithms (GAs) are a class of optimization algorithms motivated by the theory of natural selection and genetic recombination. They have been success-fully used in a wide variety of applications in business, engineering and science [1,2]. A GA tries to nd better solutions by the selection and recombination of promising solutions. It works well in wide varieties of problem domains. However, sometimes, simple selec-tion and crossover operators are not eective enough to get an optimum solution, as they might not eectively preserve important patterns (known as building blocks or partial solutions) in chromosomes. This often happens in problem domains where the building blocks are loosely distributed. The search for techniques to preserve building blocks has led to the emergence of a new class of algorithms called Probabilistic Model Building Genetic Algorithms (PMBGA) [3], also known as Estimation of Distribution Algorithms (EDA) [4]. The principle concept in this new technique is to prevent the disruption of partial solutions contained in a chromosome by giving them a high probability of being presented in the child chromosome. This can be
1. Department of Civil Engineering, Iran University of Science and Technology, Tehran, P.O. Box 16765-163, Iran. E-mail: [email protected]
Received 17 December 2007; received in revised form 28 April 2008; accepted 8 September 2008
achieved by building a probabilistic model to represent a correlation between variables in a chromosome and by using a built model to generate the next population. PMBGA is a developing area in the eld of evolutionary and genetic algorithms.
The PMBGAs are often categorized into three dierent classes by their used probability models, i.e. Univariate, Bivariate and Multivariate [5,6]. Uni-variate algorithms do not consider any dependencies among variables in an individual, i.e. they consider building blocks of order one. Due to its simplicity, the algorithms in this category are computationally very ecient and perform excellently in linear problems, such as function optimization, where the variables are not signicantly interdependent. However, these algorithms fail in complex problems, where variables in-teract with each other. Population Based Incremental Learning (PBIL) [7], Univariate Marginal Distribution Algorithms (UMDA) [4] and compact Genetic Algo-rithms (cGA) [8] use the univariate model of a prob-ability distribution. Recently, Rastgar and Hariri [9] developed a theoretical framework for studying the cGA from the convergence point of view, in which they modeled the cGA by a Markov process and ap-proximated its behavior using an Ordinary Dierential Equation (ODE).
Bivariate algorithms consider pair wise depen-dencies among variables in a chromosome, i.e. they consider the building blocks of order two. Similarly,
the probability model becomes more complex than that of the univariate model and takes the form of a probabilistic network between variables. This class of algorithm performs better in problems with a pair wise interaction among the variable, however, it fails in problems with multiple variable interactions. Mutual Information Maximization for Input Clustering (MIMIC) [10], Combining Optimizers with Mutual In-formation Trees (COMIT) [11] and Bivariate Marginal Distribution Algorithms (BMDA) [12] use the bivariate model of probability distribution.
Multivariate algorithms are those algorithms which take into account the interdependency between variables of an order of more than two. The probability network representing the interdependency of variables obviously becomes more complex and the computation time to construct such a network hugely increases, making it almost impossible to search through all possible models. Due to its simplicity, most of the algorithms in this class use a greedy heuristic to search a good model; however, greedy heuristics does not always guarantee accuracy. Some other complex search algorithms have also been successfully used for this purpose and much current research in PMBGAs is focused on nding good heuristics. Extended Compact Genetic Algorithms (ECGA) [13], Factorised Distribu-tion Algorithms (FDA) [14,15], Bayesian OptimizaDistribu-tion Algorithms (BOA) [6], Learning Factorised Distribu-tion Algorithms (LFDA) [14] and the EstimaDistribu-tion of a Bayesian Network Algorithms (EBNA) [16] use a multivariate model of the probability distribution.
This paper describes the application of one of the promising univariate PMBGA models, known as the compact Genetic Algorithm (cGA) [8], to pipe network optimization problems. In what follows, the basics of the cGA are rst described. The problems of pipe network optimization are then formulated and presented in the next section. The application of the cGA to two benchmark examples in the literature is illustrated in the third section and the results are compared with the existing solutions in the literature. The paper ends with the concluding remarks.
COMPACT GENETIC ALGORITHM (CGA) A Compact Genetic Algorithm is motivated by previ-ous works done in the eld of random walk models [8] and assumes no overlapping building blocks are con-tained in the chromosomes, i.e. considers only building blocks of order 1. A Compact GA acts like a standard GA (sGA) with a binary chromosome and uniform crossover, but does not use a population. Instead, the cGA represents a virtual population for a binary GA by a vector of probabilities, P = [p1; p2; ; pi; ::],
representing the chance that the optimal solution has a one in position i. To begin the cGA, all entries of the
probability vector are initialized to one half. Because this vector represents the probability that each gene has a value of 1, it can be used to randomly generate tourn
candidate solutions or chromosomes, bj = fbj ijj =
1; ; tourn; i = 1; ; Nbits; bji 2 [0; 1]g, where Nbits
is the number of bits in a chromosome. These solutions are then decoded, evaluated and compared, very much as in the tournament selection of a standard GA. The best candidate solution (winner) generated (call it b1
without loss of generality) is then compared, bit by bit, to all other candidate solutions to update the probability vector. For each of the tourn 1 looser
chromosomes, bj, j = 2; ; tourn, the probability
vector is updated in those positions i, where bji 6= b1 i
according to the following rule: pi ! pi 1=Npop; if b1i = 0;
pi ! pi+ 1=Npop; if b1i = 1; (1)
where Npopis an integer that simulates the population
size. The updated probability vector is then used to generate tourn new candidate solutions, and the
process continues iteratively. If any of the pi becomes
less than 0 or greater than 1 during the search, it is assumed to be 0 or 1, respectively, for the purpose of generating new candidates. The algorithm converges when either pi 0 or pi 1 for all Nbits entries of
the probability vector. This algorithm has been shown to be a simple, low-memory alternative to the sGA in its own right, but it can also be used to determine the resilience of a given problem to GA optimization [8]. A note has to be added regarding the role of the population size, Npop. Population size Npop plays
an important role in balancing the explorative and exploitative features of the method. For small values of the population size, it is highly likely that the method converges faster without giving the method enough chance to explore the search space. For big values of population size, on the other hand, exploration dominates the search, leading to a random walk in the search space. A proper value of the population size is, therefore, vital for the best performance of the method. It can be expected, however, for the proper value of the population size to be proportional to the tournament size, as Equation 1 is used tourn 1 times
at each iteration of the method. Here, a modied form of Equation 1 is used, where Npop is replaced by the
product N
poptournto reduce the computational eorts
required for tuning purposes.
PIPE NETWORK OPTIMIZATION
The problem of network optimization requires the determination of pipe sizes from a set of commer-cially available diameters ensuring a feasible least-cost
solution. Various methods with dierent degrees of success have been devised by dierent researchers to solve this problem. These methods can be grouped into three classes: Enumeration, mathematical pro-gramming and random search methods. Enumeration methods, capable of nding a global optimum solution to a pipe network design problem, are very costly and cannot be used for the optimization of real-world networks [17,18]. On the other hand, mathematical programming methods are very ecient from a compu-tational point of view, but are often trapped in saddle points in their search for the global optimum of the pipe network design problem. The computational eciency of mathematical programming methods is, of course, limited to continuous solutions, which are not favored from an engineering point of view [19-25]. Stochastic search methods have shown to logically balance be-tween computational eciency and the capability of approaching a global optimum. Among the stochastic search methods, GA has gained more popularity for pipe network optimization in recent years. The early research was primarily concentrated on developing a methodology for applying GA to pipe network opti-mization problems using simple genetic algorithms [26-30]. More recent investigations on the application of GA to pipe network optimization have focused on the development of new genetic algorithms to yield less costly solutions than those of already existing algorithms. These improvements are mostly achieved via modications of the simple genetic algorithm or introducing new operators and features to the basic algorithms [31-37].
The optimal design of a pipe network with a pre-specied layout in its standard form can be described as:
min Co= N
X
i=1
CiLi; (2)
in which N is the number of existing pipes; Li and
Ci are length and per unit cost of the ith pipe,
respectively, and Co represents the total cost of the
pipes in the network. subject to:
1. Hydraulic constraints: X
i2 in (k)
qi
X
i2 out (k)
qi= Qk; k = 1; ; K;
(3) X
i2p
Ji= 0; p = 1; ; P; (4)
Ji= Li
qi
chi
di; (5)
where K and P are the number of existing nodes and loops in the network, respectively; qi is the
ow rate in pipe i; Qk is the required demand
at consumption node k; Ji is the head loss in
the ith pipe; di is the diameter of pipe i and chi
is the Hazen-Williams coecient for the ith pipe; = 1:852, = 4:871 and = 10:667 for q in cubic meter per hour and d in inches (equivalent to = 4:727 for D in feet and Q in cubic feet per second) are Hazen{Williams constants as used in EPANET 2.0.
2. Nodal head and pipe ow velocity constraints: Hmin Hk Hmax; k = 1; ; K; (6)
Vmin Vi Vmax; i = 1; ; N; (7)
in which Hk is the nodal head; Hminand Hmax are
minimum and maximum allowable nodal head; Vi
is the pipe ow velocity; and Vmin and Vmax are
minimum and maximum allowable ow velocity. 3. Pipe size availability constraints:
di2 d; i = 1; ; N; (8)
in which diis the diameter of pipe i; and d denotes
the set of commercially available pipe diameters. A penalty method is often used to formulate the optimal design of a pipe network as an unconstrained optimization problem, in which head and velocity constraints are included in the objective function, leading to a new problem dened by minimization of the following penalized objective function, subject to the constraints dened in Equation 8.
Cp= N
X
i=1
CiLi+ p CSV;
CSV = (N
X
i=1
1 VVi
min
2
+XN
i=1
Vi
Vmax 1
2 + K X k=1
1 HHk
min 2 + K X k=1 Hk
Hmax 1
2) ;
(9) where CSV represents a measure of the head and velocity constraint violation of the trial solution and p is the penalty parameter, with a large enough value
to ensure that any infeasible solution will have a higher total cost than any feasible solution. It should be noted that in calculating the CSV, the summation ranges over those nodes and pipes at which a violation of constraints 6-7 occurs, i.e. the terms in parenthesis are positive. Here, the penalty parameter is taken as the cost of the most expensive network, i.e. a network with
all its pipes having the largest possible diameter. The hydraulic constraints (constraints 3-5) are satised, via the use of a simulation program, which explicitly solves the set of hydraulic constraints for nodal heads [38]. It should be remarked here that the formulation of the pipe size design of pipe networks dened by Equa-tions 2-9, is valid for gravitational systems under single loading. The extension of the formulation to real world networks with pumping systems and dynamic loading requires the modication of Equation 2, by including the pumping system and corresponding energy cost, the modication of Equation 4 via including the pumping head and, nally, enforcing constraints 3-7 for each loading pattern.
TEST PROBLEMS
The rst problem to be considered is a two-loop network with 8 pipes, 7 nodes and one reservoir, as shown in Figure 1 [39]. All the pipes are 1,000-m long and the Hazen-Williams coecient is assumed to be 130 for all the pipes. The minimum nodal head requirement for all demand nodes is 30 m. There are
Figure 1. Two loop network.
14 commercially available pipe diameters as listed in Table 1. Figure 2 shows the maximum, minimum and average solution cost of ten runs using dierent initial populations against the amount of network analysis required. These solutions are obtained with a tournament size of 10 and a population size of 60. The best ever solution of 419,000 units is obtained at the expense of 3,000 evaluations. This compares favorably with 250; 000 evaluations required by the method of Savic and Walters [33], 53; 000 evaluations required by the method of Cuncha and Sousa [40], 9,201 evaluations required by the Fast Messy Genetic Algorithm of Boulos et al. [35], and 7,467 evaluations required by the Fast Messy Genetic Algorithm of Wu et al. [37], in order to get the least cost solution of 419,000 units. Table 2 compares
Figure 2. Maximum, minimum and average solution costs versus the number of network evaluations for two loop networks.
Table 1. Cost data for the two-loop network.
Diameter (inch) 1 2 3 4 6 8 10 12 14 16 18 20 22 Cost (units/m) 2 5 8 11 16 23 32 50 60 90 130 170 300
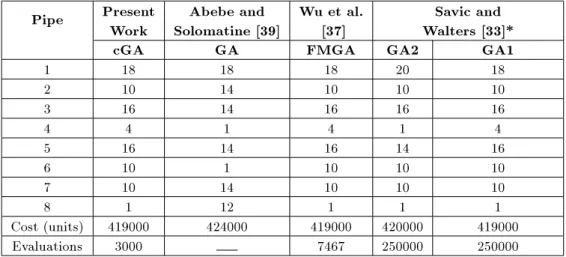
Table 2. Optimal pipe diameters along with some of the available discrete results for a two loop network. Pipe Present
Work
Abebe and Solomatine [39]
Wu et al. [37]
Savic and Walters [33]* cGA GA FMGA GA2 GA1
1 18 18 18 20 18
2 10 14 10 10 10
3 16 14 16 16 16
4 4 1 4 1 4
5 16 14 16 14 16
6 10 1 10 10 10
7 10 14 10 10 10
8 1 12 1 1 1
Cost (units) 419000 424000 419000 420000 419000 Evaluations 3000 7467 250000 250000
the results produced by the presented method to some of the stochastic search results available in the literature.
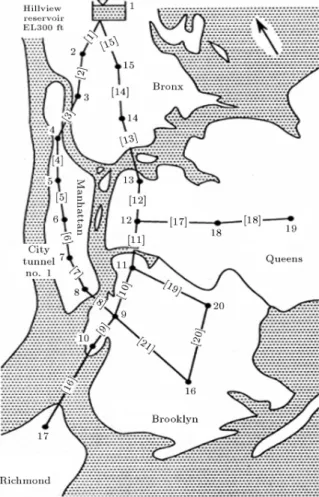
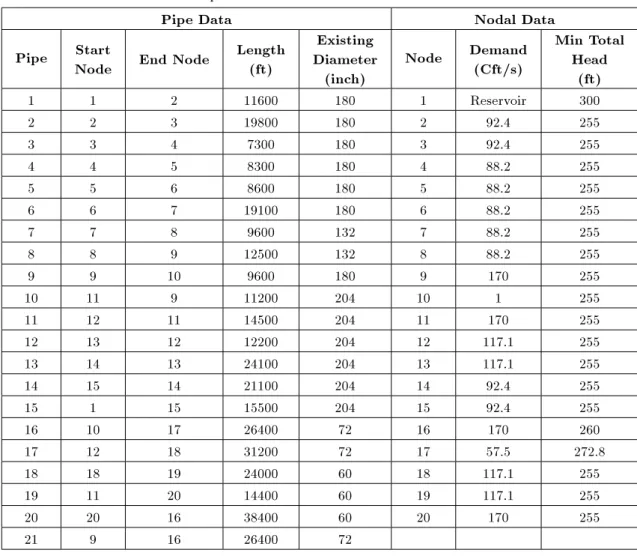
The second test problem concerns the rehabili-tation of the New York City water supply network, with 21 pipes, 20 demand nodes and one reservoir as shown in Figure 3 [31]. The commercially available pipe diameters and their respective costs are listed in Table 3, while the pipe and nodal data of the existing network are shown in Table 4. A more thorough study was carried out on this problem to assess the eect of the tournament size and population size on the quality of the solutions obtained. Table 5 shows the minimum and average solutions obtained during ten runs using dierent initial populations for a range of tournament and population sizes. It is clearly seen that the method was able to locate the optimal solution of 38.64 $M ten times out of twelve runs using dierent tournament and population sizes. The method shows its best performance for a tournament size of 20 using dierent population sizes of 35, 45 and 55. Figures 4 to 6 show the convergence curves of the method for a tournament size of 20 and population size of 35, 45 and 55. It is clearly seen that the convergence of the method is slower for increasing values of population
Figure 3. New York tunnel network.
size. The method is able to nd the optimal solution of 38.64 $M in just 7,760 network evaluations using the tournament and population sizes of 20 and 35, respectively. This compares favorably with 200; 000 evaluations required by the method of Murphy et al. [27] to get the solution of 38.80 $M, 46; 000 evaluations required by Lippai et al. [41] to get their
Figure 4. Maximum, minimum and average solution costs versus the number of network evaluations for New York network (tournament size of 20, population size of 35).
Figure 5. Maximum, minimum and average solution costs versus the number of network evaluations for New York network (tournament size of 20, population size of 45).
Figure 6. Maximum, minimum and average solution costs versus the number of network evaluations for New York network (tournament size of 20, population size of 35).
Table 3. Pipe cost data for New York network.
Diameter (inch) 0 36 48 60 72 84 96 108 Cost ($/ft) 0 93.5 134.0 176.0 221.0 267.0 316.0 365.0 Diameter (inch) 120 132 144 156 168 180 192 204
Cost ($/ft) 417.0 469.0 522.0 577.0 632.0 689.0 746.0 804.0
Table 4. Pipe and nodal data for New York tunnel network. Pipe Data Nodal Data Pipe Start
Node End Node
Length (ft)
Existing Diameter
(inch)
Node Demand (Cft/s)
Min Total Head
(ft) 1 1 2 11600 180 1 Reservoir 300
2 2 3 19800 180 2 92.4 255
3 3 4 7300 180 3 92.4 255
4 4 5 8300 180 4 88.2 255
5 5 6 8600 180 5 88.2 255
6 6 7 19100 180 6 88.2 255
7 7 8 9600 132 7 88.2 255
8 8 9 12500 132 8 88.2 255
9 9 10 9600 180 9 170 255
10 11 9 11200 204 10 1 255
11 12 11 14500 204 11 170 255 12 13 12 12200 204 12 117.1 255 13 14 13 24100 204 13 117.1 255 14 15 14 21100 204 14 92.4 255 15 1 15 15500 204 15 92.4 255 16 10 17 26400 72 16 170 260 17 12 18 31200 72 17 57.5 272.8 18 18 19 24000 60 18 117.1 255 19 11 20 14400 60 19 117.1 255 20 20 16 38400 60 20 170 255 21 9 16 26400 72
Table 5. Maximum, minimum and average solutions of ten runs using dierent values of tournament and population sizes for New York network.
Tournament 10 20 30 40
Population 65 75 85 35 45 55 25 35 45 15 25 35 Maximum ($M) 42.77 43.32 42.28 44.98 41.64 41.13 45.51 42.69 44.15 50.51 45.49 43.94 Average ($M) 40.58 40.51 40.94 40.72 40.08 39.89 41.13 39.96 40.39 42.16 41.29 40.33 Minimum ($M) 38.64 38.64 39.19 38.64 38.64 38.64 38.64 38.64 38.64 39.63 38.64 38.64 Evaluations 10,210 12,770 11,170 7,760 9,540 12,240 8,220 10,500 12,660 4,640 9,480 12,080
solution of 37.83 $M, 1; 000; 000 evaluations required by the method of Savic and Walters [33] to get the solutions of 40.42 $M and 37.13 $M, 37,186 evaluations required by the Fast Messy genetic algorithm of Boulos et al. [35] and Wu et al. [37] to get the solutions of
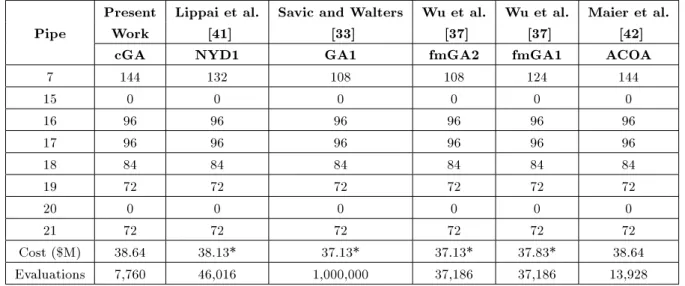
37.83 $M and 37.13 $M and nally 13,928 evaluations required by the ACOA of Maier et al. [42] to get the solution of 38.64 $M. The solution to this problem is shown in Table 6, along with some of the available GA solutions.
Table 6. Optimal duplicate pipe diameters by dierent methods for New York network.
Present Lippai et al. Savic and Walters Wu et al. Wu et al. Maier et al. Pipe Work [41] [33] [37] [37] [42]
cGA NYD1 GA1 fmGA2 fmGA1 ACOA
7 144 132 108 108 124 144
15 0 0 0 0 0 0
16 96 96 96 96 96 96
17 96 96 96 96 96 96
18 84 84 84 84 84 84
19 72 72 72 72 72 72
20 0 0 0 0 0 0
21 72 72 72 72 72 72
Cost ($M) 38.64 38.13* 37.13* 37.13* 37.83* 38.64 Evaluations 7,760 46,016 1,000,000 37,186 37,186 13,928
* Infeasible solution due to the use of dierent numerical conversion constant for the head loss equations.
REFERENCES
1. Goldberg, D.E., Genetic Algorithms in Search, Op-timization, and Machine Learning, Reading, MA, Addison-Wesley (1989).
2. Back, T., Fogel, D.B. and Michalewicz, Z., Handbook of Evolutionary Computation, New York, Inst. Physics Publishing and Oxford Univ. Press (1997).
3. Pelikan, M., Goldberg, D.E. and Lobo, F.G. \A survey of optimization by building and using probabilistic models", Urbana, IL, University of Illinois, Genetic Algorithms Laboratory, IlliGAL Report No. 99018 (1999).
4. Muhlenbein, H. and Paa, G. \From recombination of genes to the estimation of distributions I. Binary parameters", Parallel Problem Solving from Nature, H.-M. Voigt, W. Ebeling, I. Rechenberg, and H.-P. Schwefel, Eds., LNCS 1141, Springer, Berlin, pp. 178-187 (1996).
5. Larranaga, P., Etxeberria, R., Lozano, J.A. and Pena, J.M. \Optimization by learning and simulation of Bayesian and Gaussian networks", Technical Report, University of the Basque Country, KZAA-IK- 99-04 (1999).
6. Pelikan, M., Goldberg, D.E. and Cantu-Paz, E. \BOA: The Bayesian optimization algorithm", in Proceedings of the Genetic and Evolutionary Computation Confer-ence GECCO-99, W. Banzhaf, J. Daida, A.E. Eiben, M.H. Garzon, V. Honavar, M. Jakiela, and R.E. Smith, Eds., I, Orlando, FL, Morgan Kaufmann Publishers, San Francisco, CA, pp. 525-532 (1999).
7. Baluja, S. \Population based incremental learning: A method for integrating genetic search based function optimization and competitive learning", Pittsburgh, PA, Carnegie Mellon University, Technical Report No. CMUCS94163 (1994).
8. Harik, G.R., Lobo, F.G. and Goldberg, D.E. \The compact genetic algorithm", in Proceedings of the IEEE Conference on Evolutionary Computation 1998 (ICEG'98), Piscataway, NJ, IEEE Service Centre, p. 523528 (1998).
9. Rastgar, R. and Hariri, A. \A step forward in studying the compact genetic algorithm", Evolutionary Compu-tation, 14(3), pp. 277-289 (2006).
10. De Bonet, J.S., Isbell, C.L. and Viola, P. \MIMC: Finding optima by estimating probability densities", Advances in Neural Information Processing Systems, M.C. Mozer, M.I. Jordan and T. Petsche, Eds., 9, The MIT Press, Cambridge, p. 424 (1997).
11. Baluja, S. and Davies, S. \Using optimal dependency trees for combinatorial optimization: Learning the structure of the search space", In Proceedings of the 14th International Conference on Machine Learning, pp. 30-38, Morgan Kaufmann (1997).
12. Pelikan, M. and Muhlenbein, H. \The bivariate marginal distribution algorithm", Advances in Soft Computing Engineering Design and Manufacturing, R. Roy, T. Furuhashi, and P.K. Chawdhry, Eds., London, Springer Verlag, pp. 521-535 (1999).
13. Harik, G. \Linkage learning via probabilistic modeling in the ECGA", Urbana, IL, University of Illinois Genetic Algorithms Laboratory, IlliGAL Report No. 99010 (1999).
14. Muhlenbein, H. and Mahnig, T. \Convergence the-ory and applications of the factorized distribution algorithm", Journal of Computing and Information Technology, 7, pp. 19-32 (1999).
15. Muhlenbein, H. and Mahnig, T. \Evolutionary algo-rithms and the Boltzmann distribution", Foundations of Genetic Algorithms (FOGA2002) (2002).
16. Etxeberria, R. and Larra~naga, P. \Global optimization with Bayesian networks. In II Symposium on Articial
Intelligence. CIMAF99", Special Session on Distri-butions and Evolutionary Optimization, pp. 332339 (1999).
17. Yates, D.F., Templeman, A.B. and Boey, T.B. \The computational complexity of the problem of deter-mining least capital cost designs for water supply networks", Engrg. Optimization, 7(2), pp. 142-155 (1984).
18. Gessler, J. \Pipe network optimization by enumera-tion", Wat. Resour. Res., 23(7), pp. 977-982 (1985). 19. Alperovits, E. and Shamir, U. \Design of optimal water
distribution systems", Water Res. Res., 13(6), pp. 885-900 (1977).
20. Quindry, G.E., Brill, E.D. and Liebman, J.C. \Opti-mization of looped water distribution systems", J. of Env. Engg., ASCE, 107(4), pp. 665-679 (1981). 21. Mahjoub, Z. \Contribution a etude de
optimiza-tion des reaseaux mailles. Doctoral thesis (Docteur Etat)", Inst. Nat. Poly-Tech. de Toulouse, pp. 51-142, Toulouse, France, Resour. Plan. Management, ASCE, 129(3), pp. 200-209 (1983).
22. Saphir, Y.N. \Optimization of water distribution sys-tem (in Hebrew)", M.S. Thesis, Technion-Israel Insti-tute of Technology, 150 pages, Haifa, Israel (1983). 23. Fujiwara, O., Aimahakoon, J. and Edirisinghe, N.C.P.
\A modied linear programming gradient method for optimal design of looped water distribution networks", Wat. Resour. Res., 23(6), pp. 997-982 (1987). 24. Kessler, A. and Shamir, U. \Analysis of the linear
programming gradient method for optimal design of water supply networks", Wat. Resour. Res., 25(7), pp. 1469-1480 (1989).
25. Fujiwara, O. and Khang, D.B. \A two-phase decom-position method for optimal design of looped water distribution networks", Wat. Resour. Res., 26(4), pp. 539-549 (1990).
26. Murphy, L.J. and Simpson, A.R. \Pipe optimization using genetic algorithms", Research Report 93, Dept. of Civil Eng., Univ. of Adelaide, 95 pages, Adelaide, Australia (1992).
27. Murphy, L.J., Simpson, A.R. and Dandy, G.C. \Design of a network using genetic algorithms", Water, 20, pp. 40-42 (1993).
28. Dandy, G.C., Simpson, A.R. and Murphy, L.J. \A review of pipe network optimization techniques", Pro-ceedings of Watercomp, 93, Melbourne, Australia, pp. 373-383 (1993).
29. Simpson, A.R., Murphy, L.J. and Dandy, G.C. \Pipe network optimization using genetic algorithms", Pro-ceedings of Wat. Resour. Plng. and Mgmt. Specialty Conference, ASCE, Seattle, WA (1993).
30. Simpson, A.R., Dandy, G.C. and Murphy, L.J. \Ge-netic algorithms compared to other techniques for pipe optimization", J. Wat. Resour. Plng. and Mgmt., ASCE, 120(4), pp. 423-443 (1994).
31. Dandy, G.C., Simpson, A.R. and Murphy, L.J. \An improved genetic algorithm for pipe network optimiza-tion", Wat. Resour. Res., 32(2), pp. 449-458 (1996). 32. Halhal, D., Walters, G.A., Quazar, D. and Savic, D.A.
\Water network rehabilitation with structured messy genetic algorithm", J. Wat. Resour. Plng. and Mgmt, ASCE, 123(3), pp. 137-146 (1997).
33. Savic, D.A. and Walters, G.A. \Genetic algorithms for least-cost design of water distribution networks", J. Wat. Resour. Plng. and Mgmt, ASCE, 123(2), pp. 67-77 (1997).
34. Walters, G.A., Halhal, D., Savic, D. and Quazar, D. \Improved design of anytown distribution network using structured messy genetic algorithms", Urban Water, 1(1), pp. 23-38 (1999).
35. Boulos, P.F., Wu, Z.Y., Orr, C.H. and Ro, J.J. \Least-cost design and rehabilitation of water distribution systems using genetic algorithms", Proceedings of the AWWA IMTech Conference, April 16-19, Seattle, WA (2000).
36. Wu, Z.Y. and Simpson, A.R. \A self-adaptive bound-ary search genetic algorithm and its application to water distribution systems", J. of Wat. Res., 40(2), pp. 191-203 (2002).
37. Wu, Z.Y., Boulos, P.F., Orr, C.H. and Ro, J.J. \Using genetic algorithms to rehabilitate distribution sys-tems", Journal American Water Works Association, 93(11), pp. 74-85 (Nov. 2001).
38. Afshar, M.H. \An element-by-element algorithm for the analysis of pipe networks", Int. J. for Eng. Science, 3(12), pp. 87-100 (2001).
39. Abebe, A.J. and Solomatine, D.P. \Application of global optimization to the design of pipe networks", 3rd Int. Conf. on Hydroinformatics, Copenhagen, pp. 989-996, Balkema, The Netherlands (1999).
40. Cunha, M. and Sousa, J. \Water distribution network design optimisation: simulated annealing approach", J. Wat. Resour. Plng. and Mgmt. ASCE, 125(4), pp. 215-221 (1999)
41. Lippai, I., Heaney, P. and Laguna, M. \Robust water system design with commercial intelligent search opti-mizers", J. of Computing in Civil Engrg. ASCE, 13(3), pp. 133-135 (1999).
42. Maier, H.R., Simpson, A.R., Zecchin, A.C., Foong, W.K., Phang, K.Y., Seah, H.Y. and Tan, C.L. \Ant colony Optimization for design of water distribution systems", J. Water (2003).