Sharif University of Technology
Scientia IranicaTransactions A: Civil Engineering www.scientiairanica.com
Eects of intermediate principal stress parameter on
cyclic behavior of sand
F. Jafarzadeh
and M. Zamanian
Department of Civil Engineering, Sharif University of Technology, Tehran, Iran. Received 7 June 2013; received in revised form 8 October 2013; accepted 13 January 2014
KEYWORDS Sand;
Intermediate principal stress;
Anisotropy;
Cyclic hollow cylinder apparatus;
Stress path.
Abstract. Soils have an anisotropic response, and changing the inclination () and magnitude of the major principal stress will aect collapse potential and brittleness, as well as shear strength and shear stiness. In this paper, the eect of the stress path, with changes in intermediate principal stress, on the dynamic behavior of Babolsar sand, is studied. A series of undrained monotonic and cyclic tests on loose sand with induced anisotropy were conducted by using automatic hollow cylinder apparatus. Special attention was paid to the signicant role of the intermediate principal stress parameter (b) in the deformation behavior of the sand during cyclic loading. Results show that at constant , conning stress and fabric, variation in b has a signicant eect on strain amplitudes, but will not change the contractive or dilative behavior of specimens. Variation of b has a great eect on liquefaction resistance but has no eect on the mobilized friction angle at steady state. It is shown that conning stress has a signicant eect on soil response (strain development, excess pore water pressure generation and shear modulus and damping ratio). Moreover, by increasing the conning stress, the eect of b value on cyclic behavior is more pronounced.
© 2014 Sharif University of Technology. All rights reserved.
1. Introduction
In general, granular soil is inherently anisotropic be-cause of particle orientation in the deposition process. This inherent anisotropy highlights the fact that the response of a granular soil to loading will depend on orientation of the principal stresses with reference to the depositional plane. Additional anisotropy in soils may be induced by stress changes in both magnitude and direction. The impact of anisotropy on the behavior of sand has long been recognized [1,2].
Many researchers have used Hollow Cylinder (HC) apparatus to investigate the cyclic behavior of sandy soils [3-6]. However, the boundary conditions in
*. Corresponding author. Tel.: +98 21 66022727; Fax: +98 21 66014828
E-mail addresses: [email protected] (F. Jafarzadeh); [email protected] (M. Zamanian)
these studies vary greatly, and the primary focus is on regenerating simple shear conditions rather than sys-tematically investigating the eect of principal stress rotation and intermediate principal stress on the cyclic behavior of sands.
Tatsuoka et al. [7] designed a torsional hollow cylinder testing apparatus that could cyclically shear the specimens under undrained simple shear conditions by preventing any axial strain development and in-ner cell volume change. These boundary conditions eliminated changes in the inner and outer radii during shearing. The eect of continuous principal stress rotation was observed only at small strains below 0.2%. Above this strain level, the eect of continuous principal stress rotation was negligible.
Yamashita and Toki [8] conducted undrained cyclic triaxial and torsional HC tests on sand spec-imens. The major principal stress rotation was not varied in a controlled manner and was somewhere
between 0 or 90 from the vertical. They found
that the cyclic strengths obtained from cyclic triaxial tests and torsional HC tests were not equal and the dierences may be more pronounced depending on the sample preparation technique.
Chaudhary et al. [9] studied the eect of major principal rotation on the response of sands (anisotropy) under cyclic loading. The shear modulus and the damping ratio response of sand were independent of the major principal stress rotation during cyclic loading.
Shibuya et al. [10] investigated the eect of and b on the monotonic and cyclic behavior of sands. The pore pressure response of the sand subjected to these stress paths showed that large pore pressures are generated due to continuous principal stress rotation at constant (1 3)=2. Changes in b also caused
changes in excess pore pressure, but the changes were not as signicant as the ones created by the continuous principal stress rotation.
Altun et al. [11] used a cyclic torsional simple shear apparatus similar to the one used by Towhata and Ishihara [12]. They investigated the cyclic undrained behavior of sandy and silty soils. Their testing program did not include investigation of the eect of either or b on the cyclic behavior of sandy or silty soils.
Ishihara et al. [13,14] showed that during earth-quake shaking, two shear stress components act simul-taneously, tangential horizontal shear stresses and the normal stress dierence ((z h)=2). According to
them, this simultaneous application of shear stresses happens in such a way that initial principal stress rotation due to sloping ground conditions remains constant during ground shaking. They also added that this type of stress conguration may be valid, not only under sloping ground conditions, but also under the foundations of superstructures.
Yoshimine et al. [15], Sivathayalan and Vaid [16] and Shibuya et al. [17] compare the response of isotropically and anisotropically consolidated spec-imens during shearing at xed major principal stress directions, . Sivathayalan and Vaid [16] additionally performed tests with continuous rotation of at a single consolidation stress. Shibuya et al. [17] used a combination of anisotropic consolidation along a constant stress ratio line to a single consolidation stress followed by undrained unloading to the isotropic axis before the application of torsional loading along dierent, xed, principal stress directions.
Many researchers [15-23] have shown that the undrained shear strength of sandy soil decreases with changes in and b.
Considering the inadequacy and also the inherent limitations of CT and CSS tests, cyclic HC testing has gained more popularity for investigation of the eect of cyclic loads on soil behavior [7-9].
In this study, the eect of changes in the
interme-diate principal stress ratio (b) on the cyclic behavior and dynamic parameters of Babolsar sand has been investigated as the main objective. Therefore, in all tests, the direction of the major principal stress was kept at a near vertical direction ( = 10) and the
intermediate principal stress parameter was changed from one test to another b. For further details of this trend, two series of tests with dierent mean normal eective stresses have been performed.
2. Experimental apparatus [24]
Advanced testing of geomaterials requires accurate control of loads or deformations. The recent advances in the manufacturing of testing equipment have elimi-nated the necessity for an operator in modern systems. In this study, the closed-loop control system of the dynamic HC apparatus has ve main components: (1) HC software, (2) high-speed Data Acquisition System (DAS), (3) servo valves, (4) vertical and horizontal actuators, and (5) load, pressure and displacement transducers.
In this research, the employed apparatus is man-ufactured by Wykeham Farrance International Com-pany. Figure 1 illustrates the closed-loop control system of the HC apparatus.
This system is computer controlled with ve control channels and up to sixteen data acquisition channels. The specimens had a height of 20 cm, an average diameter of 10 cm, and a wall thickness of 2 cm. The axial actuator can apply an axial load of += 10 kN, with a stroke of += 25 mm, and the torsional actuator can apply a torsional force of += 200 Nm with 90 degrees of rotation. These actuators are able to control up to a 5 Hz single axis.
The inner cell, outer cell and back pressure are applied through digitally controlled air valves in a closed loop with the inner and outer cell and back pressure transducers. Frequencies are able to induce up to 1 Hz on a simultaneous 5 axis control, which is essential for applying the magnitude and direction of the major and minor principal stresses.
The IMACS is a compact self contained unit which provides all critical control, timing and data acquisition functions for the test and the transducers.
Figure 1. Closed-loop control system of the HC apparatus [20].
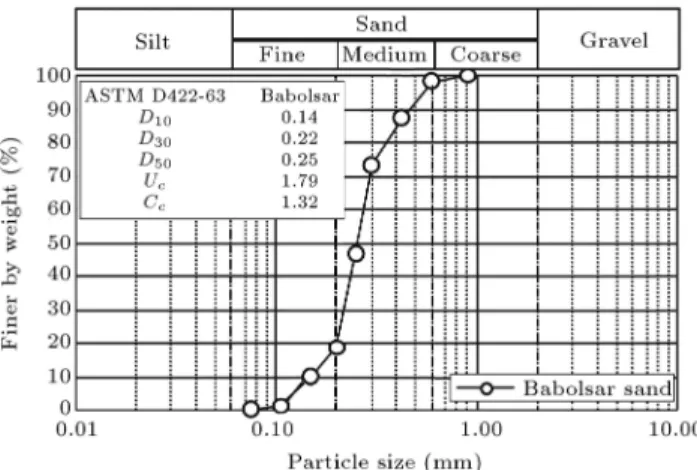
3. Sample preparation and test procedure Uniformly graded medium Babolsar sand was selected as the test material to investigate the eect of stress anisotropy on the cyclic behavior of sand. The soil was obtained from the south coast of the Caspian Sea in Iran. The particle size distribution curve of this clean sand is shown in Figure 2. Principal index tests were performed based on ASTM standards [25-28]. The physical properties of the soil used in the experimental program are summarized in Table 1. According to the USCS denition, the soil materials can be characterized as SP.
The grain size and shape of the tested materials are illustrated in Figure 3. The particle shape of this uniformly graded sand is sub-angular.
Figure 2. Grain size distribution of Babolsar sand.
Figure 3. Particle image of Babolsar sand.
The soil specimens were prepared by the moist under compaction technique [29] and the specimens were prepared to obtain relative densities of Dr t 20%. Two methods were adopted to calculate the relative densities of the specimens. In the rst method, the relative density of the specimens was determined from the initial relative density (after construction), as well as the amount of specimen volume change during saturation and consolidation stages. In the second method, the specimen moisture content was meticulously measured and, then, the specimen void ratio was determined at the end of the experiment using the ! Gs= e Sr formula in which Gsis the specic
gravity of solid particles, Sr represents the saturation ratio at the end of the test which is assumed to be 1, and e is designated as the void ratio at the end of the test. According to index tests, Gs is 2.75 for Babolsar
sand.
For saturation, carbon dioxide was circulated through the specimen to displace any air from the soil pores. Full saturation of soil specimens was achieved through application of relatively low backpressures. After a minimum acceptable B-value (Skempton's parameter) of 0.94 was obtained, the consolidation procedure was initiated.
Isotropic consolidation of the specimen was achieved by linearly increasing the conning pressure to reach 50 kPa or 150 kPa mean normal eective stress as representatives for low and moderate conning stresses.
Following consolidation to the desired mean nor-mal eective stresses, undrained cyclic tests were performed using cycles of vertical load, torque, inner cell pressure and outer cell pressure to keep , b and q=0
0m constant during loading. Because loading
frequency has little to no eect on soil behavior in liquefaction testing [30,31], testing was performed at 1/5 Hz to ensure equilibration of pore water pressure throughout the specimen; thus providing more accurate pore pressure measurements.
In the cyclic tests, the induced cyclic deviator stress to mean normal eective stress ratio (q=0
0m)
was kept as 0.2, and monotonic tests were performed at 0.1%/min strain rate. As shown in Figure 4, in the cyclic tests, the inner and outer cell pressures, vertical load and torque were applied simultaneously as a cycle to keep , b and q=0
0mconstant during loading.
b = 0:1, b = 0:5 and b = 0:9 were selected as the lower, intermediate and upper limits of the b
Table 1. Physical properties of test materials.
Soil type Specic gravity emax emin
Babolsar sand 2.753 0.790 0.531
Toyoura sand 2.645 0.973 0.609
Figure 4. Schematic cycles of vertical load, torque and inner and outer cell pressures during tests: (a) = 10and
b = 0:1; (b) = 10and b = 0:5; and (c) = 10and b = 0:9.
Table 2. Characterization of the specimens and their loading condition.
No. Specimen identication
(degree)
0
(kPa) b Dr(%) e
1 501001
10
50
0.1 21 0.735
2 501005 0.5 20 0.739
3 501009 0.9 22 0.732
4 1506001
150
0.1 18 0.743
5 1501005 0.5 17 0.744
6 1501009 0.9 19 0.741
7 M1501001
150
0.1 22 0.733
8 M1501005 0.5 86 0.566
9 M1501009 0.9 56 0.644
parameters, respectively. The direction of the major principal stress to the vertical was kept constant to eliminate the eect of . With respect to the direction of the major principal stress, under the most common eld loading condition, and in many of the laboratory tests (e.g. cyclic triaxial test apparatus), was selected vertically. The value of was selected at nearly zero ( = 10) to avoid any singularity in calculation of the inner and outer cell pressures, vertical load and torque.
Nine tests under a controlled state of principal stress direction were conducted. Detailed information regarding specimens and their loading details for the aforementioned tests are presented in Table 2. The appellation of monotonic tests has an \M" prex.
4. Test results and discussion
4.1. Stress statuse in anisotropic loading As mentioned, the tests were performed at 50 and 150 kPa mean normal eective stresses, and the shear stresses were induced by application of simultaneous inner and outer cell pressures, vertical load and torque. Therefore, the maximum shear stress in an element of hollow cylinder specimens is a result of two shear stresses. The rst is a shear stress arising from torque (z) and the other is the result of vertical and
horizontal stress dierences ((z )=2) or deviator
stress. The maximum deviator stress is equal to (1 3)=2.
Figure 5 presents a description of the stress state in an element of hollow cylinder specimens. Regarding this gure, r (or 2) is only a function of b, and the
major principal stress direction () changes by z,
and z magnitude.
At any constant value, the stress status of a HC element under dierent values of b is illustrated in Figure 6. Clearly, at b = 0 and b = 1 loading conditions, the shear stress in one plane is zero. Under b = 0 and = 0 conditions, the major principal stress will be applied to the sedimentation direction of particles, unlike the b = 1 loading condition in which, in addition to vertical 1, horizontal 1 is also applied
to the element. So, the specimens under b = 0 loading condition must have a higher shear strength than the case of b = 1.
At b = 0:5, the magnitude of principal stresses is dierent in all directions. This type of loading
Figure 5. Description of stress state: (a) Polar coordinate; (b) principal stresses; (c) three normal and one shear streses conguration; and (d) Mohr circle for the conguration in (c).
Figure 6. Stress status of an HC element under dierent conditions of b value.
will cause shear stresses in three major directions. Therefore, at constant , specimens under b = 0:5 loading condition have to tolerate shear stresses in dierent directions and will be weaker than other b values.
4.2. Strain and strength variations with number of cycles
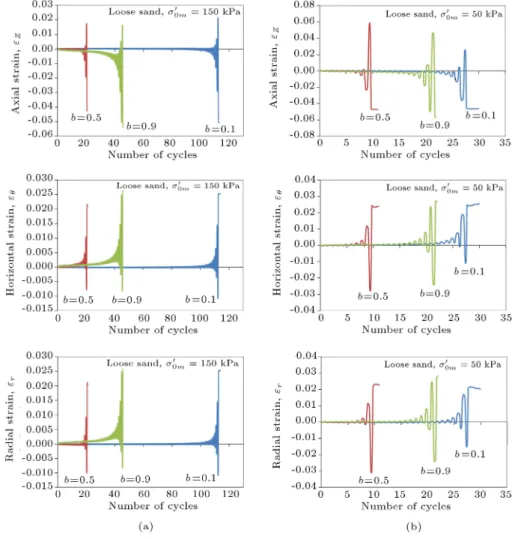
Figure 7 shows the axial, angular and radial strain changes in the specimen that is isotropically consoli-dated at 150 kPa and 50 kPa mean normal eective stresses.
As shown in this gure, the specimens consoli-dated at 50 kPa and 150 kPa conning stress have similar responses to the cyclic loading in which the contractive behavior in the vertical direction and the expansive behavior in horizontal and radial directions were occurred, because of the direction of the major principal stress ( = 10).
The number of cycles to initiate liquefaction could be considered the liquefaction resistance criteria (cyclic strength). In both 50 kPa and 150 kPa conning stresses, specimens tested under b = 0:5 loading conditions showed the weakest strength.
Some researchers [32-34] have shown that the undrained shear strength of sandy soils is constant or decreases with an increase in b. In this research, the eects of and b were not investigated independently. Results showed that the specimen's cyclic resis-tance was signicantly decreased by increasing b from 0.1 to 0.5, however it increased when b increased from 0.5 to 0.9. Changes in shear stress on the main plans caused dierent cyclic resistance in specimens tested under various b conditions. As mentioned, under b = 0:1 and b = 0:9 loading conditions, the shear stress in one plane is near zero. Under b = 0:1 condition, the major principal stress will be applied at the sedimentation direction of the particles, but under b = 0:9 loading condition, in addition to vertical 1, horizontal 1 is also applied to the element. So,
the specimens under b = 0:1 loading condition must have a higher shear strength than in the case of b = 0:9.
At b = 0:5, the magnitude of principal stresses is dierent in all directions. This type of loading will cause shear stresses in three major directions. Therefore, at constant , the specimens tested under b = 0:5 loading condition have to tolerate shear stresses in dierent directions and will be weaker than specimens tested at other b values.
4.3. Excess pore water pressure
The pore water pressure ratio (ru), dened as the
ratio between the pore water pressure and the initial mean eective stress, is a useful representation of the undrained strength. Based on pore pressure-related criteria, soil liquefaction has often been dened as the state at which ru = 1:0. This criterion was selected as
the denition of initial liquefaction.
Laboratory measurements typically indicate that for a given soil, consistency (relative density for sands and gravels) and stress history, there is a non-linear relationship between liquefaction resistance and con-ning stress [35-37].
As shown in Figure 8, for a constant value of , b and Dr, an increase in 0
0m will lead to a 2 to 4 times
increase in the liquefaction resistance of the specimens. The largest increase is for the b = 0:1 case, in which by
Figure 7. Variation of axial, angular and radial strains with number of cycles: (a) 0
om= 150 kPa; and (b) om0 = 50 kPa.
Figure 8. Variation of excess pore pressure ratio with number of cycles: (a) 0
om= 150 kPa; and (b) om0 = 50 kP a.
an increase in 0
0mfrom 50 kPa to 150 kPa, the number
of cycles for the initiation of liquefaction increases from 26 to 114.
In addition, by increasing 0
0m, the eect of b on
cyclic resistance will increase. Under the 0
0m= 50 kPa
and b = 0:1 condition, the number of cycles to initiation of liquefaction will be 3 times that of b = 0:5, and 1.4 times that of b = 0:9. However, under the 0
0m= 150
and b = 0:1 condition, the number of cycles for the
beginning of liquefaction is 5.5 times that of b = 0:5, and 2.6 times that of b = 0:9.
For a better comparison of the generated excess pore water pressure, the rate of increase in ru with
the maximum shear strain (max) generated in one
cycle is shown in Figure 9. As shown, the brittleness of specimens is reduced by an increase in b, as small increases of shear strain will cause rapid increase in excess pore water pressure in specimens tested under
Figure 9. Variation of pore pressure ratio with maximum shear strain at cycle: (a) 0
om= 150 kPa; and (b)
0
om= 50 kPa.
b = 0:1 loading condition. By an increase in b, the rate of excess pore water pressure generation is reduced. 4.4. Variation of deviator stress with mean
normal eective stress
Granular soils mobilize shear resistance through in-terparticle sliding friction and geometrical interfer-ence [38-40]. Interparticle sliding friction is mobilized by way of sliding along two adjacent particle surfaces, and is characterized by an interparticle friction angle ('). The interparticle friction angle depends chiey
on particle surface roughness, and is essentially inde-pendent of conning stress and density [38,39]. Surface roughness is related to the strength, texture and hard-ness of the particles, which, in turn, are determined by the crystal structure of the constituent minerals and intercrystalline bonds [40]. Surface roughness that inuences interparticle friction commonly has smaller amplitude than that constituting particle an-gularity [41]. Since reproducible measurements of '
are dicult to achieve, this parameter is rarely used in practice [42].
Geometrical interference (or interlocking) is mobi-lized as particles push against, climb over, and damage (i.e. abrade, fracture and crush) adjacent particles, and is designated by a geometrical interference friction
Figure 10. Schematics of sand particles and loading direction.
angle ('g) that ranges from 0 at large eective
conning pressures, where particle movement occurs through sliding and particle damage, to about 30
at low eective conning pressures, where particle movement involves pushing or climbing over adjacent particles [42].
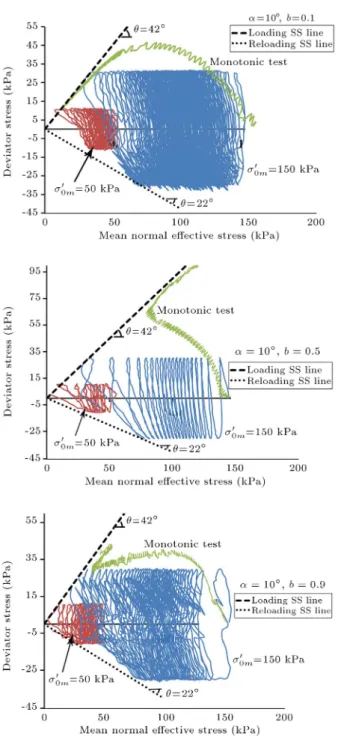
Loading direction has a signicant eect on the internal friction angle of sandy soils [2,8,9,11,15,16,18-20]. The particles interlock will be aected by loading reversion, with respect to the situation of sand particles to others (Figure 10), so, changing loading direction will cause signicant dierences in the internal friction angle in loading and reloading. Because of the deposi-tion direcdeposi-tion of the sand (sample preparadeposi-tion method), the sand particles interlock is stronger at the loading phase than at reloading, as 'ss of the loading phase is
about 50% more than 'ssof reloading. The monotonic
tests were performed for better determination of the steady state line position, while the position of the steady state line could be determined from cyclic tests with good approximation.
Changing the b parameter will change the spec-imens connement (i.e., 0
2 will be increased by
in-creasing b) and has no signicant eect on particles interlock. Research also reported that changing the b parameter has no signicant eect on the internal fric-tion angle of sandy soils [15,16]. As shown in Figure 11, the internal friction angle at loading and reloading will remain constant by changing the b parameter.
4.5. Variations in shear modulus and damping ratio with number of cycles.
Alarcon et al. [32], Drnevich [33] and Isenhower et al. [43] determined the shear modulus (G) and damping ratio (D) of soils by means of cyclic tests (i.e. torsional, triaxial or resonant column tests). Various factors aect the shear modulus and damping ratio of sandy soils. For the shear modulus of sandy soils, the eective parameters are shear amplitude, eective stress, den-sity, or void ratio, and anisotropic consolidation. On the contrary, the degree of Over Consolidation Ratio (OCR) does not signicantly aect the shear modulus of sand. The eect of grain size is less important. The damping ratio of sand varies with strain amplitude and eective stress level.
Figure 11. Variation of deviator stress with mean normal stress.
The shear modulus of sand at any relative density would be increased initially if the imposed shear stress ratio was signicantly lower than the cyclic resistance ratio [44]. Moreover, the shear modulus of specimens in the rst or second cycle of loading may be aected by the specimen preparation process or a slight discontinu-ity between the soil specimen and the base pedestal/top cap. Therefore, the shear modulus of specimens in these cycles of loading may be in error. In this research, the shear modulus of the third cycle of loading has been used as the initial shear modulus.
Variation of the shear modulus ratio (i.e. the
Figure 12. Variation of shear modulus with number of cycles: (a) 0
om= 150 kPa; and (b) 0om= 50 kPa.
shear modulus normalized with the shear modulus of the initial cycle of loading, G=G1) with the number
of loading cycles (N) is shown in Figure 12. The pattern of the G=G1 variation with N can be divided
into two phases in specimens which have a higher cyclic resistance ratio than cyclic stress ratio. In the initial phase, there is not a noticeable change in G=G1 as N
increases because of relatively low excess pore water pressure development. After that, and by imposing the cycles of loading, the development of pore water pressure will reduce the shear modulus of specimens drastically. In specimens with lower cyclic resistance, the initial phase will be short or will disappear.
The number of exerted cycles in the rst phase is related to the imposed shear stress ratio and the specimen cyclic resistance, in which, in specimens with higher cyclic resistance, development of the excess pore water pressure will be postponed. Under b = 0:1 loading condition, the number of exerted cycles in the rst phase is approximately 70 to 80 percent of the total loading cycles. This number will reach 40% under b = 0:9 loading condition and 15% under b = 0:5 loading condition, which shows that the cyclic strength of specimens will be decreased by increases of b from 0.1 to 0.5, followed by an increase as b increases from 0.5 to 0.9.
Figure 13. Variation of damping ratio with number of cycles: (a) 0
om= 150 kPa; and (b) om0 = 50 kPa.
of G=G1 with N is the number of cycles which lead
to liquefaction. Under any loading condition of b, the number of cycles which lead to the failure of specimens is approximately 25 and 10 cycles for 0
0m= 150 kPa
and 0
0m = 50 kPa, respectively. In other words, at
constant 0
0m, a change of b has no eect on the exerted
cycles in the second phase.
The changes in damping ratio with the number of loading cycles are demonstrated in Figure 13. As evident, damping ratio will change in three phases with an increase in N. The damping ratio of most specimens begins from 5%. In the rst phase, with an crease in the number of loading cycles, the damping ratio of the specimen does not change noticeably. The number of cycles in this phase depend on 0
0m and b,
such that the specimens under b = 0:1 and b = 0:5 conditions experience the most and the least number of cycles in this phase, respectively. With the increase in the number of loading cycles and the beginning of the second phase, damping ratio rapidly increases and reaches 0.2. The second phase of changes in D will be proportional to the decrease in the modulus of the soil skeleton. As the third phase begins, the soil skeleton will be destroyed and the specimen will be liqueed.
5. Conclusion
A series of undrained monotonic and cyclic torsional shear tests on hollow cylinder specimens were per-formed for investigating the eect of stress anisotropy on the behavior of loose Babolsar sand. The response of this sand has been investigated under constant loading direction () and controlled value of intermediate principal stress parameter (b).
Results show that stress anisotropy has a signi-cant eect on the cyclic behavior of sand. This eect is intensied by increasing the initial mean normal eective stress.
In these tests, the direction of major principal stress, relative density and grain structure (fabric) were the same, so, the mechanism of deformation depends on conning pressure and b.
Large deformation during cyclic loading occurs due to strain softening. Induced axial deformation during cyclic loading is comparatively small until soil reaches a triggering point of contractive ow defor-mation. However, large strain is induced during ow deformation.
Results show that variations in the b parameter have no eect on the strain phase (i.e. contractive or compressive status) of specimens, and the direction of major principal stress is the predominant factor for strain pattern. In all tests, the specimens showed contractive behavior in an axial direction and dilative behavior in horizontal and radial directions.
Rapid increase of excess pore water pressure with shear strain showed that specimens tested under b = 0:1 loading condition are more brittle than others.
Results showed that changes in b parameter have no eect on the internal friction angle, while the directional dependent characteristic of particle inter-lock was caused by dierent internal friction angles in loading and reloading. The steady state friction angle dierence in loading and reloading phases was about 20 degrees.
Shear modulus changes with the number of cycles was aected by changes in the b parameter, as, under b = 0:5 loading condition, the shear modulus was reduced rapidly by exerting cyclic loads, while much more cycle was required to reduce the shear modulus under b = 0:1 and b = 0:9 loading conditions.
Results showed that the increases of mean normal eective stress will increase the eect of the b param-eter on the cyclic responses of specimens. In other words, increases in conning stress will increase stress anisotropy eects.
Nomenclature
b Intermediate principal stress parameter (b = (2 3)=(1 3))
Inclination of the major principal stress to the vertical direction H Specimen length
HCA Hollow Cylinder Apparatus 0
0m Initial mean normal eective stress
T Torque
q Deviator stress
u Excess pore water pressure z Circumferential shear strain
ru Excess pore water pressure ratio
(ru= u=00m)
Total normal stress 0 Eective normal stress
z; r; Axial, radial and circumferential total
normal stresses
1; 2; 3 Major, intermediate and minor total
principal stresses
'ss Internal friction angle at steady state
0
1; 20; 30 Major, intermediate and minor
eective principal stresses z; z Circumferential shear stresses
pi and po Inner and outer conning pressures,
respectively
ri and ro Inner and outer specimen radii,
respectively References
1. Arthur, J.R.F. and Menzies, B. \Inherent anisotropy in a sand", Geotechnique, 22(1), pp. 115-128 (1972). 2. Oda, M. \Initial fabric and their relations to
me-chanical properties of granular material", Soils and Foundations, 12(1), pp. 17-36 (1972).
3. Ishihara, K. \Liquefaction and ow failure dur-ing earthquakes", Geotechnique, 43(3), pp. 351-415 (1993).
4. Vaid, Y.P. and Sivathayalan, S. \Static and cyclic liquefaction potential of Fraser Delta sand in simple shear and triaxial tests", Can. Geotech. J., 33(2), pp. 281-289 (1996).
5. Riemer, M.F. and Seed, R.B. \Factors aecting the apparent position of steady state line", J. Geotech. Geoenviron. Engng, ASCE, 123(3), pp. 281-288 (1997).
6. Yoshimine, M. and Ishihara, K. \Flow potential of sand during liquefaction", Soils Found., 38(3), pp. 189-198 (1998).
7. Tatsuoka, F., Ochi, K., Fujii, S. and Okamoto, M. \Cyclic undrained triaxial and torsional shear strength of sands for dierent sample preparation methods", Soils and Foundations, 26(3), pp. 23-41 (1986). 8. Yamashita, S. and Toki, S. \Eect of fabric anisotropy
of sand during rotation of principal stress directions", Soils and Foundations, 33(3), pp. 92-104 (1993).
9. Chaudhary, S.K., Kuwano, J., Hashimoto, S., Hayano, Y. and Nakamura, Y. \Eects of initial fabric and shearing direction on cyclic deformation characteristics of sand", Soils and Foundations, 42(1), pp. 147-157 (2002).
10. Shibuya, S., Hight, D.W. and Jardine, R.J. \Four-dimensional local boundary surfaces of an isotropi-cally consolidated loose sand", Soils and Foundations, 43(2), pp. 89-103 (2003).
11. Altun, S., Goktepe, A.B. and Akguner, C. \Cyclic shear strength of silts and sands under cyclic load-ing", ASCE Geo-Frontiers Conference Austin/ASCE Geotechnical Special Publication No.133: Earthquake Engineering and Soil Dynamics: Recent Findings in Soil Liquefaction, pp. 1365-1375 (2005).
12. Towhata, I. and Ishihara, K. \Undrained strength of sand undergoing cyclic rotation of principal stress axes", Soils and Foundations, 25(2), pp. 135-147 (1985).
13. Ishihara, K. and Towhata, I. \Sand response to cyclic rotation of principal stress directions as induced by wave loads", Soils and Foundations, 23(4), pp. 11-26 (1983).
14. Ishihara, K. and Yamazaki, \An analysis of wave-induced liquefaction in seabed deposits of sand", Soils and Foundations, 24(3), pp. 85-100 (1984).
15. Yoshimine, M., Ishihara, K. and Vargas, W. \Eects of principal stress direction and intermediate principal stress on undrained shear behavior of sand", Soils Found., 38(3), pp. 179-188 (1998).
16. Sivathayalan, S. and Vaid, Y.P. \Inuence of gener-alized initial state and principal stress rotation on the undrained response of sands", Can. Geotech. J., 39(1), pp. 63-76 (2002).
17. Shibuya, S., Hight, D.W. and Jardine, R.J. \Local boundary surfaces of a loose sand dependent on consol-idation path", Soils Found., 43(3), pp. 85-93 (2003). 18. Wijewickreme, D. and Vaid, Y.P. \Experimental
ob-servations on the response of loose sand under simulta-neous increase in stress ratio and rotation of principal stresses", Can. Geotech. J., 45(5), pp. 597-610 (2008). 19. Broms, B.B. and Casbarian, A.O. \Eects of rotation of the principal stress axes and of the intermediate principal stress on the shear strength", Proceedings, Sixth International Conference on Soil Mechanics and Foundation Engineering, Montreal, Canada, 1, pp. 179-183 (1965).
20. Symes, M.J., Gens, A. and Hight, D.W. \Undrained anisotropy and principal stress rotation in saturated sand", Geotechnique, 34(1), pp. 11-27 (1984). 21. Uthayakumar, M. and Vaid, Y.P. \Static liquefaction
of sands under multiaxial loading", Canadian Geotech-nical Engineering, 35(2), pp. 273-283 (1998).
22. Tatsuoka, F., Ochi, K. and Fujii, S. \Eect of sample preparation method on cyclic undrained strength of sand in triaxial and torsional shear tests", Bulleting of Earthquake Resistant Structure Research Center, University of Tokyo, 17, pp. 29-62 (1984).
23. Ishihara, K., Yamazaki, A. and Haga, K. \Liquefac-tion of K0-consolidated sand under cyclic rotation of
principal stress direction with lateral constraint", Soils and Foundations, 25(4), pp. 63-74 (1985).
24. Wykeham Farrance. Dynamic Hollow Cylinder Ap-paratus, Hardware, Sample Set-up, Saturation Stage and Consolidation Stage Reference Manual. See: http://www.w.co.uk/
25. ASTM D 422-63, Standard Test Method for Particle-Size Analysis of Soils (2007).
26. ASTM D 4253-00, Standard Test Methods for Maxi-mum Index Density and Unit Weight of Soils Using a Vibratory Table (2006).
27. ASTM D 4254-00, Standard Test Methods for Min-imum Index Density and Unit Weight of Soils and Calculation of Relative Density (2006).
28. ASTM D 854-02, Standard Test Methods for Specic Gravity of Soil Solids by Water Pycnometer (2002). 29. Ladd, R.S. \Preparing test specimens using
undercom-paction", Geotechnical Testing Journal, ASTM, 1(1), pp. 16-23 (1978).
30. Boulanger, R.W., Seed, R.B., Chan, C.K., Seed, H.B. and Sousa, J. \Liquefaction behavior of sat-urated sands under unidirectional and bi-directional monotonic and cyclic simple shear loading", Rep. No. UCB/GT/91-08, Univ. of California, Berkeley, Calif (1991).
31. Polito, C.P. \The eects of non-plastic and plastic nes on the liquefaction of sandy soils", Ph.D. Dissertation, Virginia Polytechnic Institute and State Univ., Blacks-burg, Va., 274 (1999).
32. Alarcon-Guzman, A., Leonards, G.A. and Chameau, J.L. \Undrained monotonic and cyclic strength of sands", Journal of Geotechnical Engineering, ACSE, 114(10), pp. 1089-1109 (1988).
33. Drnevich, V.P. \Undrained cyclic shear of saturated sand", Journal of the Soil Mechanics and Foundations Division, ASCE, 98, No. SM8, pp. 807-825 (1972). 34. Yang, Z.X., Li, X.S. and Yang, J. \Undrained
anisotropy and rotational shear in granular soil", Geotechnique, 57(4), pp. 371-384 (2007).
35. Seed, H.B., Idriss, I.M. and Arango, I. \Evaluation of liquefaction potential using eld performance data", Journal of Geotechnical Engineering, ASCE, 109(3), pp. 458-482 (1983).
36. Seed, H.B. \Earthquake resistant design of earth dams", Proceedings of a Symposium on Seismic Design of Embankments and Caverns, Philadelphia, Pennsyl-vania, ASCE, N.Y (1983).
37. Hynes, M.E. \Pore pressure generation characteristics of gravels under undrained cyclic loading", Ph.D. Thesis, University of California, Berkeley, CA (1988).
38. Rowe, P.W. \The stress-dilatancy relation for static equilibrium of an assembly of particles in contact", Proc. R. Soc, London A 269, pp. 500-527 (1962). 39. Lee, K.L. and Seed, H.B. \Drained strength
character-istics of sands", J. Soil Mech. Found. Div. ASCE, 93, No. SM6, pp. 117-141 (1967).
40. Terzaghi, K., Peck, R.B. and Mesri, G. Soil Mechanics in Engineering Practice, 3rd Edn., London: Wiley (1996).
41. Barrett, P.J. \The shape of rock particles, a critical review", Sedimentology, 27(3), pp. 291-303 (1980). 42. Negussey, D., Wijewickreme, W.K.D. and Vaid, Y.P.
\Constant volume friction angle of granular materials", Can. Geotech. J., 25(1), pp. 50-55 (1988).
43. Isenhower, W.M., Stokoe, K.H. and Allen, J.C. \In-strumentation for torsional shear/resonant column measurements under anisotropic stresses", Geotechni-cal Testing Journal, 10(4), pp. 183-191 (1987). 44. Georgiannou, V. and Konstadinou, M. \Torsional
shear behavior of anisotropically consolidated sands", J. Geotech. Geoenviron. Eng., 140(2), p. 04013017 (2014).
Biographies
Fardin Jafarzadeh received his PhD degree in Civil Engineering from Tohoku University, Japan, in 1995, and is currently Associate Professor of Civil Engi-neering at Sharif University of Technology, Tehran, Iran. He is Vice-Chairman of the Iranian Geotechnical Society, and a member of ISSMGE, JSCE and several other professional associations.
His research interests include a broad area of topics in Geotechnical and Geotechnical Earthquake Engineering with a special focus on the earth and rockll dams, ground improvement, physical modeling and constitutive laws.
Mostafa Zamanian was born in 1983. He received a BS degree in Civil Engineering from the Power & Water University of Technology (PWUT), Tehran, Iran, in 2005, and an MS degree in Geotechnical Engineering from Sharif University of Technology (SUT), Tehran, Iran, in 2007, where he is currently a PhD degree candidate. He was named an outstanding graduate student for both degrees.
His research interests lie in analytical and numer-ical analysis of earth and rockll dams and laboratory investigation of soil characterization. He has profes-sional experiences in designing earth and rockll dams, deep excavations, tunnels, and in site investigations, and has teaching experience in PWUT and SUT Inter-national Campus.
![Figure 1. Closed-loop control system of the HC apparatus [20].](https://thumb-us.123doks.com/thumbv2/123dok_us/8389437.2229105/2.892.479.822.976.1108/figure-closed-loop-control-hc-apparatus.webp)