The distribution of lugworms (Arenicola marina L.) over the flats at Whitstable
9
0
0
Full text
(2) 628. GARTH. CHAPMAN. AND G. E. NEWELL. VARIATION IN NUMBJ;:RS OF WORMS FROM HIGH TO Low. WATER. The number of worms per square yard was counted at selected intervals on a transect of the Flats shown in Text-fig. 1. At each station areas of 1 sq.yd. were dug over and examined for lugworms after they had been well broken by the fork. Although the method may be described as 'rough and ready' it is. 10 l' E.. z ~ 0 ~ ~ ..... N 0 ..... LI'I'. tmile. Text-fig. I. Transect of intertidal zone at Whitstable lugworm population was determined.. along which the. quite adequate for the task involved and capable of yielding consistent results:. as Newell (1948) has shown. The hardness of the soil in the proximity of the: sample was tested with the penetrometer. The results are set out pictorially in Text-fig. 2 in which the hardness of the sand, the mean population oflugworms" and the position on the shore of each station is shown. It can be seen from Text-fig. 2 that the lugworms are most numerous ill the region of the Flats that can be described as muddy sand and that they fall off' rapidly in numbers in the shingle bank towards high water and towards th~,.
(3) DISTRIBUTION Station no.. Hardness (g./sq.cm.). OF LUGWORMS. LW.M.S.T.-. ---------- -- --. 800. 629. Description of soli. Distance from HW.M.. Mudstone 700. .shellgravel. 12. ----1-. ----600 Shell gravel and sand. 11. 736. 10. 944. 400. 9. 720. -. Muddy. sand. 300. 8. 200. 7. Mud and. 888. shingle 4. 100 Bound shingle. ---------------+1. ,,,...,,10'. HW.M.S.T. 1.".,.".1 50S. Loose shingle. 10 No. per sq.yd.. Text-fig. 2. Diagram Whitstable. The The numbers of high-water mark. showing the numbers of lugworms per sq. yd. in intertidal zone at hardness, in g./sq.cm., is the mean of twenty readings at each station. worms per sq.yd. is a mean of not less than three samples. H.W.M.S.T., spring tides; L.W.M.S.T., low-water mark spring tides..
(4) 630. GARTH. CHAPMAN. AND G. E. NEWELL. clay that is uncovered at low-water spring tides. In between these two less thickly populated zones there is a region in which no great variation in hardness occurs, at least as shown by penetrometer measurements, but in which the population varies from I sq.yd. to another. There may be areas of many square yards in which there is a uniform density of population, which can be described as the 'general population' of the Flats, but this is split up by areas in which the number of worms is greater or less than the 'general population'. (In this survey of the population it is the 'general population' to which the figures of worms per square yard refer.) The limitation of the population towards high-water mark would appear to be brought about by the increasing scarcity of any soil of sufficiently small particle size in which burrows could be made and also, probably, by the drying of the soil during low water. The limitation of the population towards low-tide mark appea,rs to be brought about by the decrease in depth of the sand and fine gravel which overlies the clay. Other evidence in favour of this hypothesis will be given below. In short, it would appear that there is insufficient variation in the hardness of the soil, as measured by the penetrometer, to cause any great variation in the , general population' of the shore. The cause of such local variations as do occur is discussed below. THE LOCATION AND DISTRIBUTION OF THE LINES OF CASTINGS. A brief description of the shore zonation at Whits table has been given by Newell (1948), and it will suffice to mention here that the lines of castings occur on the muddy sand of the Flats which stretches from within about 100 yd, of high-water spring tides nearly down to low-water mark, the lugworm belt varying in width from about 400 to 800 yd. The lines of lugworm casting are confined to an area of about 0'5 square mile, none being found east of Whitstable harbour nor west of the clay cliffs at Seasalter. The centre of the area in which the lines occur has a normal national grid reference of 097662 (sheet 173, I in. Ordnance Survey). The lines were found to be of various lengths and widths but rarely exceeded 60 yd. in length or 2 ft. in width. Usually they were about 40 yd. in length and 18 in. in width. With practice the same line could be recognized on successive occasions, but, to test the permanence of the lines, five of them were marked by stakes when it was seen that they remained in a constant position during the period of 5 weeks over which they were observed. Almost all of the lines were straight so that their magnetic bearings were easy to determine with a prismatic compass. The bearings of 50 lines were taken and. are given in Table I. Unaided observation gave the impression that the lines run at random in all directions, but it can be seen from the compass bearings recorded that there is.
(5) DISTRIBUTION. OF LUGWORMS. not an equal number of lines in all directions.. 631. More, in fact, occur with bearings. of about 450 and about 1650 than in other directions. The predominating direction. of the lines of castings seems to be roughly parallel with the coastline. TABLE I.. Bearing 0 5 10. 15 20 25 30 35 40 45. 5° 55. BEARINGS OF LUGWORM LINES. Number of lines recorded in each 5° of arc, magnetic bearings. Number of lines recorded in each 20° of arc is also indicated. No. of lines No. of lines Bearing Bearing I 60 2 120 2 0 65 125 I I 70 130 I 3 135 7 75 4 80 0 3 140 0 0 85 145 2 I 90 150 0 I 2 5 95 155 100 I 160 4 ° 165 1°5 5 I IIO ° 17° 0 I 4 II5 175 14. No. of lines 0 I. I 0. 2. 3 I 2 I. 7. 3 2. ° 3. 8. POPULATION DENSITY OF THE LINES AND ADJACENT AREAS. The number of castings in the lines is greater than the number per square yard forming the general population of the shore. For example, castings on the shore which are not in lines vary in numbers from minima of I or 2 to maxima of 3° to 4° per sq.yd. The population of the lines may rise above 4° per sq.yd., whereas the areas adjacent the lines generally contain about 5 or 6 casts per sq.yd. To obtain these results areas of! by 2 yd. were marked off, one on either side and one along the lines and the number of castings in each area was counted. The results are shown in Table II. TABLE II. POPULATION OF LINES AND ADJACENT AREAS Worms per sq.yd. Worms per sq.yd. Worms per sq.yd. flanking line in line flanking line. ° 3 6 6 3 ° 0 3 2 14. ~ ~ ~ ~ 38 ~ ~ 29 36 43. 4 5 8 4 10 I 6 6 9 8. VARIATIONS IN SOIL DEPTH AND TYPE. As has been mentioned in previouspapers, the soilof the Flats consistsof muddy sand underlain by impervious clay. This stratum is almost certainly London clay (Dr J. F. Kirkaldy and Mr C. D. Ovey, private communications),and is found at different depths on different parts of the shore, being exposed near.
(6) GARTH. 632. CHAPMAN. AND G. E. NEWELL. low-watermark but beingelsewhereoverlainby a thickness of sandwhichvaries from about I to 12in. It has been noted that lugworms,which appear to be able to burrow and livein gravellysoilseemunable to penetrate the clay(Wells,1945), or at least are not normally found living in it. Accordingly, the depth of the sand (or topsoil as it may well be called)was measured alongthe lines of casting by means of an auger and was comparedwith that in the less densely populated areas. In each of four prominent lines a series of borings was made in order to record the depth of the topsoil (a) along the middle of the line, (b)at distances of 6 in. from the middle of the line, (c) at distances of 12 in. from the middle of the line, and (d) at distances of 18in. from the middle of the line. A selection of these results is given in Table III, from which it can be seen that the topsoil is much deeper along the line than at its flanks. TABLE III.. DEPTH OF SAND IN ANDNEARLUGWORM LINES Depth. 18 in. from centre 8 7'5 4'5 5. 12 in. from centre 9 8 7 10'5. 6 in. from centre 10 12 II 15. of sand in inches, Centre of line 12 12 12 12. 6 in. from centre 9'5 10'5 5'5 II. 12 in. from centre 6 7'5 3'5 10. 18 in. from centre 8'5 6 3'5 4'5. THE GENERAL EFFECT OF THE DEPTH OF TOPSOIL ON THE NUMBERS OF WORMS. A close correlation between the dense population of lugworms and the depth of the topsoil along the lines of castings having been established it seemed of interest to find out if this principle were of wider application. Fortunately, a small area was found which showed patchy distribution of a different kind from that previously examined. In 1942 a large bomb fell on the Flats just seaward of the Fucus and shingle zone and, its crater subsequently filling with muddy sand, its presence was no longer detectable except for the extreme density of the lugworm population. The centre of the former crater had a great depth of topsoil, but was surrounded by a rim of clay covered merely by a few inches of sand. Within the margins of the crater the lugworm population had a density of 42 per sq.yd., that of the marginal zone being only 4 per sq.yd., whilst the undisturbed area outside the crater rim had a density of 28 per sq. yd. So sharp was the separation of an area rich in worms from an area practically devoid of castings that the counts from which the figures were quoted were made only a yard or so apart. The evidence from the bomb crater and from a study of the lines of castings is strongly in favour of the view that one of the main factors influencing the density of the lugworm population is the depth of the topsoil overlying the clay rather than the admixture with the topsoil of even a large proportion of shingle or shell gravel..
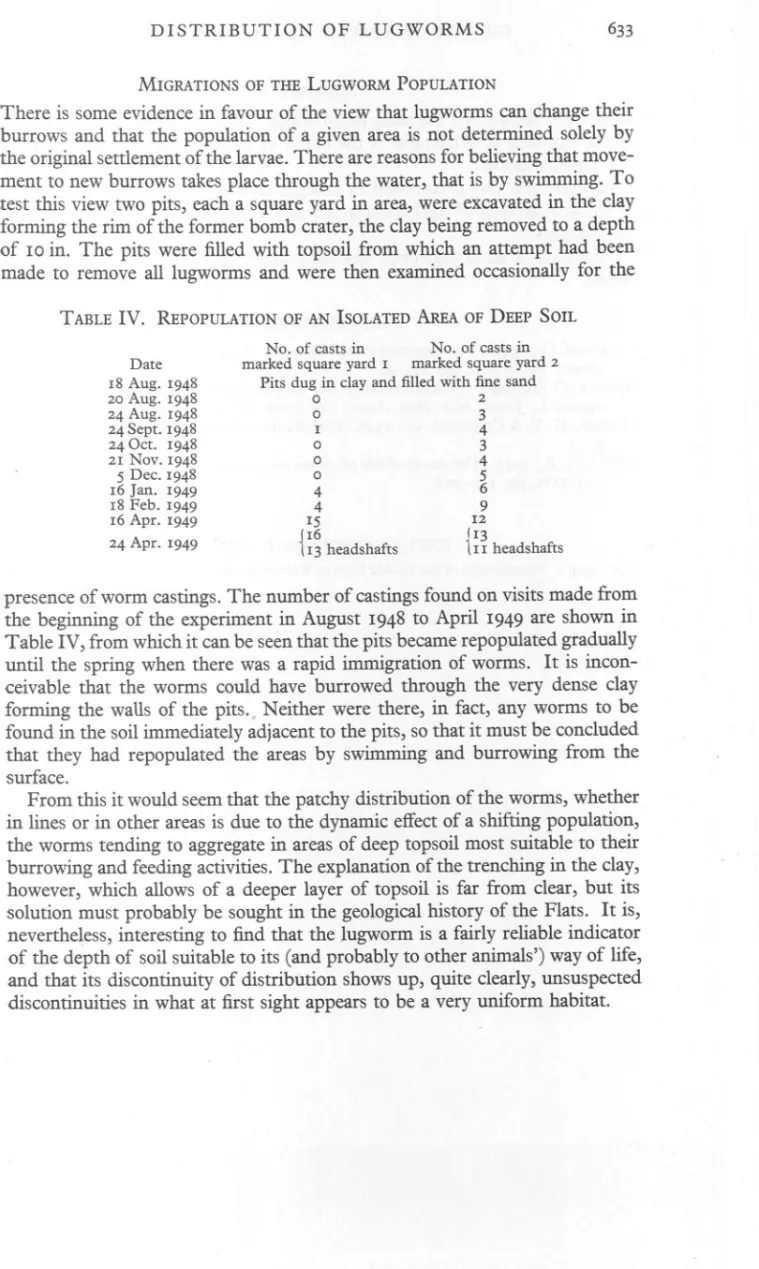
(7) DISTRIBUTION. OF LUGWORMS. 633. MIGRATIONS OF THE LUGWORM POPULATION. There is some evidence in favour of the view that lugworms can change their burrows and that the population of a given area is not determined solely by the original settlement of the larvae. There are reasons for believing that movement to new burrows takes place through the water, that is by swimming. To test this view two pits, each a square yard in area, were excavated in the clay forming the rim of the former bomb crater, the clay being removed to a depth of 10 in. The pits were filled with topsoil from which an attempt had been made to remove all lugworms and were then examined occasionally for the TABLE IV.. REPOPULATION OF AN ISOLATED AREA OF DEEP SOIL. Date 18 20 24 24 24 21 5 16 18 16. Aug. Aug. Aug. Sept. Oct. Nov. Dec. Jan. Feb. Apr.. 1948 1948 1948 1948 1948 1948 1948 1949 1949 1949. 24 Apr.. 1949. No. of casts in No. of casts in marked square yard I marked square yard 2 Pits dug in clay and filled with fine sand 0 2 0 3 I 4 0 3 0 4 0 5 4 6 4 9 15 12 I6 (13 { 13 headshafts III headshafts. presence of worm castings. The number of castings found on visits made from the beginning of the experiment in August 1948 to April 1949 are shown in Table IV, from which it can be seen that the pits became repopulated gradually until the spring when there was a rapid immigration of worms. It is inconceivable that the worms could have burrowed through the very dense clay forming the waUs of the pits.. Neither were there, in fact, any worms to be found in the soil immediately adjacent to the pits, so that it must be concluded that they had repopulated the areas by swimming and burrowing from the surface. From this it would seem that the patchy distribution of the worms, whether in lines or in other areas is due to the dynamic effect of a shifting population, the worms tending to aggregate in areas of deep topsoil most suitable to their burrowing and feeding activities. The explanation of the trenching in the clay, however, which allows of a deeper layer of topsoil is far from clear, but its solution must probably be sought in the geological history of the Flats. It is, neverthe~ess, interesting to find that the lugworm is a fairly reliable indicator of the depth of soil suitable to its (and probably to other animals') way of life, and that its discontinuity of distribution shows up, quite clearly, unsuspected discontinuities in what at first sight appears to be a very uniform habitat..
(8) GARTH. 634. CHAPMAN. AND G. E. NEWELL. SUMMARY. It has been shown that the main factor which influences the local distribution of the lugworm at Whits table is the depth of the muddy sand overlying the clay stratum below. In places this clay is furrowed by straight channels which are revealed only by the arrangement of the lugworm castings. These are more numerous along the channels. Migration of adult lugworms has been shown to occur, most freely in the sprmg. REFERENCES CHAPMAN,G., 1949. The thixotropy and dilatancy of a marine soil. Journ. Mar. BioI. Assoc., Vol. XXVIII,pp. 123-4°. NEWELL,G. E., 1948. A contribution to our knowledge of the life history of Arenicoia marina L. Journ. Mar. BioI. Assoc., Vol. XXVII,pp. 554-80. NEWELL,G. E. & CHAPMAN,G., 1948. Distribution oflugworms. Nature, Vol. CLXII,. P.75.. I. WELLS,G. P., 1945. The mode of life of Arenicoia marina L. Journ. Mar. BioI. Assoc., Vol. XXVI,pp. 170-2°7.. EXPLANATION. OF PLATE. I. Figs. I and 2. Photographs of the muddy Flats at Whitstable showing lines of lugworm castings..
(9) JOURN.MAR. BroL. Assoc. XXVIII (3). Fig. I.. Fig. 2.. CHAPMAN AND NEWELL. PLATE. I.
(10)
Figure

Related documents
National Conference on Technical Vocational Education, Training and Skills Development: A Roadmap for Empowerment (Dec. 2008): Ministry of Human Resource Development, Department
The synthesized MEPCMs were incorporated into white paint at three different concentrations, and temperature profiling revealed that the paint’s temperature
Figure 1 shows the effect of pH on the BOD of POME in 21 days. It could be observed that the E. crassipes was able to reduce BOD level at all the four pH conditions studied. The
19% serve a county. Fourteen per cent of the centers provide service for adjoining states in addition to the states in which they are located; usually these adjoining states have
Хат уу буудай нъ ТгШсит ёигит зүйлд хамаарагддаг нэг настай ихэечлэн зусах хэлбэртэй үет ургамал бөгөөд уураг ихтэй, шилэрхэг үртэй, натур жин их байдгаараа
How Many Breeding Females are Needed to Produce 40 Male Homozygotes per Week Using a Heterozygous Female x Heterozygous Male Breeding Scheme With 15% Non-Productive Breeders.
4.1 The Select Committee is asked to consider the proposed development of the Customer Service Function, the recommended service delivery option and the investment required8. It
• Follow up with your employer each reporting period to ensure your hours are reported on a regular basis?. • Discuss your progress with
