GLOBCURRENT: MULTISENSOR SYNERGY FOR SURFACE CURRENT
ESTIMATION
J.A. Johannessen1, B. Chapron2, F. Collard3, M.-H. Rio4, J.-F. Piollé2, L. Gaultier3, G. Quartly5, J. Shutler6, R. Escola7, R. P. Raj1, C. Donlon8, R. Danielson1, A. Korosov1, F. Nencioli5, V. Kudryavtsev1, M. Roca7,
J. Tournadre2, G. Larnicol4, G. Guitton3, P. Miller5, M. Warren5 and M. Hansen1 (1)NERSC, Thormøhlens gate 47, N-5006 Bergen, Norway; email: [email protected]
(2)Ifremer, Technopole Brest-Iroise 29280 Plouzané, France,
(3)OceanDataLab, 870, Déolen, 29280 Locmaria-Plouzané, France, (4) CLS, Toulouse, France (5)Plymouth Marine Laboratory, Prospect Place, The Hoe, Plymouth, Devon, PL1 3DH, UK (6)University of Exeter, Penryn, UK, (7)isardSAT UK, (8)ESA ESTEC, Noordwijk, The Netherlands
ABSTRACT
The GlobCurrent project (http://www.globcurrent.org) aims to: (i) advance the quantitative estimation of ocean surface currents from satellite sensor synergy; and (ii) demonstrate impact in user-led scientific, operational and commercial applications that, in turn, will improve and strengthen the uptake of satellite measurements. It is often demonstrated that sharp gradients in the sea surface temperature (SST) and current fields and the ocean surface chlorophyll-a distribution are spatially correlated with the sea surface roughness anomaly fields at small spatial scales, in the sub-mesocale (1-10 km) to the mesoscale (30-80 km). At the larger mesoscale range (>50 km), information derived from radar altimeters often depict the presence of coherent structures and eddies. The variability often appears largest in regions where the intense surface current regimes (>100 - 200 km) are found. These 2-dimensional structures manifested in the satellite observations represent evidence of the upper ocean (~100-200 m) dynamics. Whereas the quasi geostrophic assumption is valid for the upper ocean dynamics at the larger scale (>100 km), possible triggering mechanisms for the expressions at the mesoscale-to-submesoscale may include spiraling tracers of inertial motion and the interaction of the wind-driven Ekman layer with the quasi-geostrophic current field. This latter, in turn, produces bands of downwelling (convergence) and upwelling (divergence) near fronts. A regular utilization of the sensor synergy approach with the combination of Sentinel-3, Sentinel-2 and Sentinel-1 together with other satellite missions will provide a highly valuable data set for further research and development to better relate the 2-dimensional surface expressions and the upper ocean dynamics.
1. INTRODUCTION
From a purely physical point of view, the ocean surface current can be characterized as a coherent horizontal and vertical movement of water – in contact with the surface and representative over a specific depth range – with a given velocity that persists over a specific region
and given time period. Our ability to monitor ocean surface currents and to understand the fundamental processes that influence their strength and variability has evolved during the last decades. Nowadays both climate change monitoring and projections as well as operational oceanography, air-sea interactions and coupled physical and biogeochemical interactions are demanding distinct and accurate knowledge of the ocean surface currents. For example, search and rescue operations, monitoring of sediment transport, pollution dispersal and prediction of fish egg and larvae drift all require precise estimates of surface currents at a broad range of temporal and spatial scales. As such the ESA Data User Element (DUE) funded GlobCurrent project (http://www.globcurrent.org) aims to:
• advance the quantitative estimation of ocean surface currents using a satellite sensor synergy approach;
• demonstrate impact in user-led scientific, operational and commercial applications;
• improve and strengthen the uptake of satellite measurements for upper ocean research and application.
The GlobCurrent project follows an analysis and interpretation framework for ocean surface current estimates as outlined in [1]. The project has a 3.5-year duration and will end in July 2017. The following tasks forms the core of activities:
• Federate the international user community for ocean surface currents to develop scientific and end-user consensus on technical and scientific requirements relevant to the project.
• Undertake research and development activities to define, evolve, and maintain Algorithm Theoretical Baseline Descriptions (ATBD) for all the GlobCurrent ocean surface current products and validate the performance of each algorithm. • Define and document a Technical Specification for
each evolving version of the GlobCurrent system. • Implement and qualify each successive version of
the GlobCurrent system and operate each system to produce the required outputs.
_____________________________________
Proc. ‘Living Planet Symposium 2016’, Prague, Czech Republic,
• Support user-led application case studies to encourage the appropriate development of the GlobCurrent system and uptake of GlobCurrent products and demonstration services.
A brief summary of the present availability of the global data products is provided in section 2. Section 3 addresses the ongoing development of regional climatology products with examples from the Agulhas Current region, while section 4 proceeds with synoptic snapshot examples for the same region. The summary and outlook follows in section 5.
2. DATA PRODUCTS AND RELEVANCE OF
SENTINEL-3
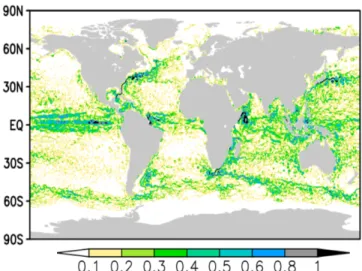
The present GlobCurrent global data products cover a 12-year period from 2002 to 2014. The data include geostrophic current, and Ekman current (at the surface and 15 m depth). It is also planned to be extended with a surface Stokes drift components. The two former products are produced from a combination of satellite data (altimetry, GOCE, GRACE, scatterometers) and in-situ data (Argo floats, surface drifter data), whereas the latter is derived from the Wave Watch III model. The data are interpolated to a common grid with a temporal resolution of three hours and a spatial resolution of about 25 km. An example of the global product is shown in Figure 1. The readers are referred to [2] for a detailed explanation on how this product is derived. The Sentinel-3 provision of data and information products in support of the global, regional and local surface current estimations is illustrated in Figure 2. From the radar altimeter, infrared radiometer and imaging spectrometer (including sun glint) one can obtain 6 geophysical variables, notably: small scale roughness anomalies, ocean color, sea surface height (SSH), significant wave height, near surface wind speed and sea surface temperature (SST). These variables and their spatial and temporal changes contain direct or indirect manifestations and signals related to the surface current conditions, notably: surface current boundaries; surface tracer velocity; surface Ekman current; inertial motion; surface current vorticity; surface geostrophic current and Stokes drift.
Further invoking data and information products from Sentinel-1 and other existing complementary satellite missions such as Sentinel-2 jointly with data from in-situ observing systems increase the number of derived ocean variables. In turn, more reliable information on the surface current conditions and the uncertainties (Figure 2) can be derived. Systematic use of satellite sensor synergy combined with in-situ data will therefore strengthen our ability to obtain high quality and consistent information on surface current conditions and their relationship to the upper ocean (~100 m) dynamics and processes.
Figure 1. Map of global surface geostrophic current at mid-night on 1st September 2012. Speeds below 0.1 m/s are
removed (white); speeds above 1 m/s are black. In the following this is further addressed and illustrated by some selected examples of satellite sensor synergy for regional studies centered to the greater Agulhas Current regime, notably:
• snapshot of SST and SAR image data, surface geostrophic current and surface drifter data;
• frontal sharpening from joint SST, SSH and surface drifter data
3. SNAPSHOT OF SST AND SURFACE ROUGHNESS DATA, SURFACE
GEOSTROPHIC CURRENT AND SURFACE DRIFTER DATA.
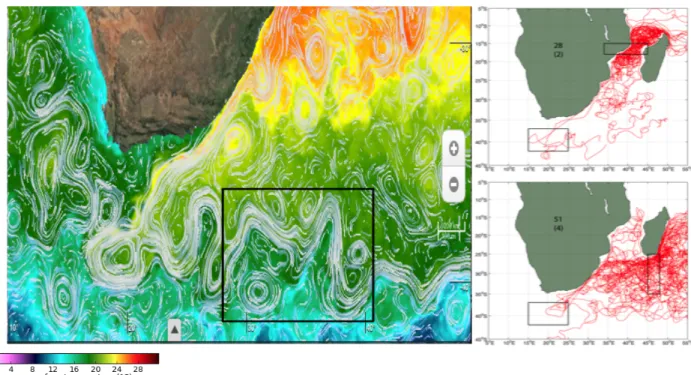
The snapshot surface geostrophic current pattern overlaid on the SST field for 24 April 2015 shown in Figure 3 (left) clearly documents the relationship of these two quantities at a daily timescale and spatial resolution of about 30 km. The core of the Agulhas Current from about 30° E to 21° E is rather elongated, straight and narrow (~100 km) with the characteristic southward bending at about 22° E clearly depicted both in the SST field and the surface geostrophic current. Such co-existing SST and current fronts will lead to short-scale features in the wind stress field as pointed out by [3]. Northeast of 30° E the Agulhas Current display a more meandering pattern connected with a distinct Natal pulse. At the same time the retroflection region appears to be represented by a mixture of an early return flow at 21° E combined with a large almost completely closed-loop anticyclonic eddy centred at 38° N and 19.5° E with a diameter of about 300 km. Evidence of the northward flowing Cape Good Hope current is depicted with some clear meanders and eddies west of 18° E. The surface drifter trajectories further support these findings.
PLATFORM
SENSOR
VARIABLE CURRENT TYPE
Figure 2. Illustration of Sentinel-3 provision of data and information products in support to the global, regional and local surface current estimations. Additional provision of complementary data and information from Sentinel-2 and Sentinel-1 as well as other supporting missions and in-situ data further demonstrates the importance and strength of the systematic use of sensor synergy.
Figure 3. (left) Synoptic snapshot showing the combined SST (colour) and surface geostrophic current (white stippled lines) obtained on 24 April 2015 (from http://globcurrent.oceandatalab.com). The color bar gives the SST in degree Celsius. The structures
in the black box is further addressed below. (right) Surface drifter climatology for 1986-2016. The surface drifter trajectories (Figure 3, right) obtained
from the Global Drifter Program (GDP) [4] reveal that very few drifters with a drogue at 15 m appears to be
caught in the core of the Agulhas Current. Out of 28 drifters that passed southward through the inserted box in the Mozambique Channel only 2 passed the marked
box in the retroflection region. In comparison, of the 51 drifters that floated westward through the box south of Madagascar only 4 passed the box in the retroflection region. These findings are somewhat surprising and tend to suggest that the estimates of the surface drift velocity in the core of the Agulhas Current is biased towards observations from a minor number of corresponding floats.
The value and strength of the sensor synergy approach for deriving finer spatial resolution surface current products is expected to be further explored and systematically applied when the Sentinel-1 SAR begins to deliver range Doppler velocity fields (see Figure 2). Promising examples of such capabilities were demonstrated by the Envisat ASAR range Doppler velocity retrievals and climatology of the Agulhas Current for the 6 years period from 2007 to 2012 [5 ].
4. PROJECT LED DEMONSTRATION STUDIES
Table A.1 summarizes the different global and regional products that will become available in the final GlobCurrent system. Some products may be produced in a demonstration mode (limited period of time available, no frequent update) while others are produced in a routine mode with regular updates.
Table A1. Global and regional products to become available during the last phase of the GlobCurrent project as routine
and demonstrations products.
In the GlobCurrent project the daily fields of SST, and surface geostrophic current will moreover be regularly combined and blended with ocean colour data, sunglint observations and Sentinel-1 SAR roughness anomaly and range Doppler velocity data and other Level 2 to 4 products. This will allow further investigation of the multiple types of 2-D surface signal expressions and relationship to mesoscale processes and the upper ocean
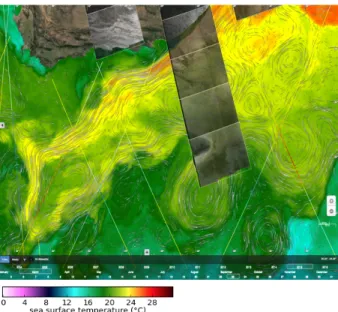
dynamics as demonstrated by [6] and [7]. An example of this is depicted in Figure 4 where the combined surface geostrophic current and SST field is overlaid a Sentinel-1 SAR surface roughness image and sea surface height from radar altimeters centred to 23 March 2015. Systematic availability of these combined data will moreover be highly attractive with respect to model validation and assimilation as also demonstrated by [5]. Moreover, there appears to be distinct relationship of the SST anomalies to the orbital geostrophic eddy motion at scales from about 100 to 400 km such that cyclonic eddies are occupied by cold water in the center whereas the anticyclonic are warm. The collocation of these eddy features with the Argo profiling floats are currently being implemented and will, in turn, provide valuable opportunity for characterization and assessment of the vertical temperature and salinity structures within the cyclonic and anticyclonic eddies following the method used by [8].
Figure 4. Synoptic snapshot showing the combined SST (colour), surface geostrophic current (stippled streamlines),
and surface roughness from the Sentinel-1 SAR image obtained on 23 March 2015. The sea surface height track data
from radar altimetry is also overlaid. The color bar gives the SST in degree Celsius.
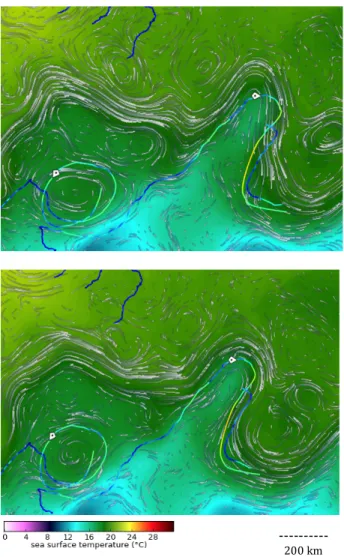
Due to the lack of temporal resolution in altimetry, the surface geostrophic velocities derived from altimeters are not always consistent with the SST observations. Methods to improve the estimation of the geostrophic currents from the SST fields will therefore be investigated. It is, for instance, possible to align the surface velocities with SST fronts where the geostrophic assumption is valid and where tracer fronts are available. In so doing, the fronts shaped by the tracers due to the underlying dynamics are used to constrain the direction of the geostrophic currents derived from altimetry. This is further illustrated in Figure 5. In the upper plot the altimeter-based streamlines and SST field
are overlaid the trajectories of a number of surface drifters. A distinct mismatch between the meandering frontal structure in the streamlines and the drifter data pathway is clearly noted. In contrast the lower plot reveal the streamlines corrected for the SST and tracer field yielding a much better pattern agreement.
Figure 5. (upper) SST field and uncorrected streamlines from altimetry on 24 April 2015 within the black box marked in Figure 3 together with surface drifter trajectories. (lower) Same as above but now with the corrected velocity fields using
passive microwave SST. 5. USER LED CASE STUDIES
The triple-collocation method [9] provides validation of the GlobCurrent current field across a broad range of weak and strong currents from ~ 0.1 m/s to 1.2 m/s. This implies that the most intense current regimes (e.g. > 1.5 m/s) are not properly assessed. A subset of all the available surface drifter velocity observations with drogues in the period from September 2012 to December 2014 are used [10]. The analyses is done for zonal and meridional current components. In summary [10] find that the GlobCurrent data products are too strong in the presence of weak currents (less than about 0.3 m/s) and too week in strong currents (greater than
about 0.6 m/s). This may, in turn, suggest that the surface velocity fields in the ocean basins and in intense current regimes are respectively over-estimated and suppressed in the GlobCurrent data products. This will be further examined in the 2nd phase of the project and will also benefit from the external user led case studies based on the following set of regulations and requirements:
(i) be user led;
(ii) include research and development activities; (iii) ensure significant application of GlobCurrent
data;
(v) avoid comparable studies and overlapping objectives;
(vi) contribute to the development of the GlobCurrent system evolution;
(vii) increase the uptake of GlobCurrent products and demonstration services;
(viii) present their work, progress and outcomes at the GlobCurrent UCM-3 in March 2017;
(ix) critically assess the impact of the GlobCurrent project.
(x) deliver the final results in the form of a ready to submit manuscript for peer review journal. The 10 case studies listed below were selected and kicked-off in the 2nd Phase of the GlobCurrent project covering both global ocean and regional seas, notably:
• Assessing the use of GlobCurrent products for forecasting drift of oil and objects off the coast of Norway. Principal investigator is MET Norway.
• Dynamics and variability of the Agulhas Current in satellite ocean current products. Principal investigator is University of Cape Town/Nansen Tutu Center, South Africa.
• Use of GlobCurrent fields to perform Lagrangian simulations of pelagic fish eggs and larvae in the Mediterranean Sea. Principal investigator is CNR, Lecce, Italy.
• Evaluation of the impact of GlobCurrent data products on global and regional numerical wave modelling accuracy. Principal investigator is TechWorks Marine, Ireland.
• Assessment of the capability to retrieve surface currents in the Alboran Sea. Principal investigator is Institut de Ciencies del Mar (CSIC), Barcelona, Spain.
• Overall consistency between GlobCurrent estimates and products from Mercator Océan. Principal investigator is Mercator Ocean, Toulouse, France.
• Wave-current interactions in the Gulf of Tehuantepec. GlobCurrent products validation. Principal investigator is CICESE, Ensenada, Mexico.
• AIS ocean surface currents estimates. Principal investigator e-Odyn, France.
!!!!!!!!!! 200$km
• Validation of the surface current products in the coastal region around Australia and estimation of the tidal component. Principal investigator NOVELTIS, Toulouse, France.
• Surface current nowcasting service for ship routing using the Globcurrent products. Led by OceanDataLab in collaboration with CMA-CGM (the 3rd largest container company in the world). The outcome of these studies will be presented at the UCM-3 that takes place in ESRIN (Frascati, Italy) from 21-23 March 2017.
6. SUMMARY AND OUTLOOK
Global and regional observation-based and model-based surface currents are now available at a spatial resolution of about 10 km, often as weekly analyses and daily forecasts. An important objective of the GlobCurrent project is the validation and the estimation of the data quality using independent observations and or information. Assessment of the GlobCurrent surface current (component and or combined) can also be performed in part using assimilation systems (e.g., MyOcean) as a reference. However, since the assimilation systems also depend on ocean models that have limited vertical resolution near the surface, they are not expected to be a reference for all the GlobCurrent demonstration products listed in Table A1. Complementary assessments are therefore planned using independent in situ observations (e.g., Argo and surface drifters), high-resolution remote sensing (e.g., satellite optical glitter and land-based high frequency radar data. This will include the following internal GlobCurrent demonstration studies listed in Table A1:
• Reconstructing ocean currents by combining along-track altimetry and surface tracer fronts: the good, the bad and the ugly by Francesco Nencioli et al.
• On the joint use of tracer images and altimetric fields to improve the assessment of the ocean surface by Lucille Gaultier et al.
• A 12-year reanalysis of global ocean currents at the surface and 15m depth currents from the synergetic use of altimetry, GOCE, wind and in-situ data by Marie-Helene Rio et al.
• A regional and Lagrangian characterization of GlobCurrent ocean surface current analyses by Rick Danielson et al.
• Fusion of GlobCurrent and Ocean Colour CCI products by Anton Korosov et al.
• Regional high resolution Mean Dynamic Topography estimated from altimetry, GOCE geoid model, in-situ temperature and salinity profiles, surface drifters and SAR velocities by Sandrine Mulet et al.
• Improved measurements of mean sea surface velocity from Envisat ASAR and Sentinel-1 by Morten W. Hansen et al.
In addition, the user led demonstration case studies listed in section 5 will provide complementary opportunities to pursue this further both globally and at a range of supersites including the greater Agulhas Current region, the Norwegian-North Atlantic Current, the Alboran Sea and the Strait of Sicily.
7. REFERENCES
[1] Chapron, B., and the GlobCurrent Team, January 2015, GlobCurrent Analyses and Interpretation Framework, Technical Report available at
http://www.globcurrent.org
[2] Rio, M.-H., S. Mulet, and N. Picot, 2014, Beyond GOCE for the ocean circulation estimate: Synergetic use of altimetry, gravimetry, and in situ data provides new insight into geostrophic and Ekman currents, Geophys. Res. Lett., 41, 8918– 8925.
[3] Chelton D.B., M.G. Schlax, M.H. Freilich, R.F. Milliff, 2004, Satellite radar measurements reveal short-scale features in the wind stress field over the world ocean. Science 303: 978–983.
[4] Lumpkin, R., and G. C. Johnson, 2013, Global ocean surface velocities from drifters: Mean, variance, El Nino–Southern Oscillation response, and seasonal cycle, J. Geophys. Res. Oceans, 118, 2992–3006.
[5] Johannessen, J. A., B. Chapron, F. Collard, B. Backeberg, 2014, Use of SAR data to monitor the Greater Agulhas Current, In Remote Sensing of the African Seas, edited by V. Barale and M. Gade, ISBN 978-94-017-8007-0, Springer.
[6] Kudryavtsev, V. N. A. Myasoedov, B. Chapron, J. A. Johannessen, F. Collard, 2012, Imaging mesoscale upper ocean dynamics using SAR and optical data, Journal of Geophysical Research, Vol. 117, C04029, 2012.
[7] Lapeyre G. and P. Klein, 2006, Dynamics of the Upper Oceanic Layers in Terms of Surface Quasigeostrophy Theory. J. Phys. Oceanogr., 36, 165–176.
[8] Raj, R.P., J. A. Johannessen, T. Eldevik, J. E. Ø. Nilsen, I. Halo, (2016) Quantifying mesoscale eddies in the Lofoten Basin, Journal of Geophys. Res. (in press).
[9] Stoffelen, A., 1998: Toward the true near-surface wind speed: Error modeling and calibration using triple collocation, J. Geophys. Res., 103(C4), 7755–7766, doi:10.1029/97JC03180.
[10] Danielson, R., A. Korosov, J. A. Johannessen, R. Raj, M.-H. Rio, F. Collard, B. Chapron, G. Quartly, J.-F. Piollé, A regional characterization of the GlobCurrent ocean surface current analyses, this proceedings.