Discovery Visual Environment User Guide
Version 2005.06August 2005
About this Manual Contents
Chapter 1 — Overview
Chapter 2 — Getting Started
Chapter 3 — Using the Top Level Window
Chapter 4 — Using The Wave Window
Chapter 5 — Working with Assertions
Chapter 6— Using the List Window
Chapter 7— Using Schematics
Chapter 8— Displaying Delta Cycles
Chapter 9— Basic Navigation Techniques Index
Discovery Visual
Environment
User Guide
Version 2005.06 August 2005
Comments?
E-mail your comments about this manual to [email protected]
Copyright Notice and Proprietary Information
Copyright 2004 Synopsys, Inc. All rights reserved. This software and documentation are owned by Synopsys, Inc., and furnished under a license agreement. The software and documentation may be used or copied only in accordance with the terms of the license agreement. No part of the software and documentation may be reproduced, transmitted, or translated, in any form or by any means, electronic, mechanical, manual, optical, or otherwise, without prior written permission of Synopsys, Inc., or as expressly provided by the license agreement.
Right to Copy Documentation
The license agreement with Synopsys permits licensee to make copies of the documentation for its internal use only. Each copy shall include all copyrights, trademarks, service marks, and proprietary rights notices, if any. Licensee must assign sequential numbers to all copies. These copies shall contain the following leg-end on the cover page:
“This document is duplicated with the permission of Synopsys, Inc. for the exclusive use of __________________________________________ and its employees. This is copy number __________.”
Destination Control Statement
All technical data contained in this publication is subject to the export control laws of the United States of America. Disclosure to nationals of other countries contrary to United States law is prohibited. It is the reader’s responsibility to determine the applicable regulations and to comply with them.
Disclaimer
SYNOPSYS, INC., AND ITS LICENSORS MAKE NO WARRANTY OF ANY KIND, EXPRESS OR IM-PLIED, WITH REGARD TO THIS MATERIAL, INCLUDING, BUT NOT LIMITED TO, THE IMPLIED WAR-RANTIES OF MERCHANTABILITY AND FITNESS FOR A PARTICULAR PURPOSE.
Trademarks
Synopsys, the Synopsys logo, Arcadia, BiNMOS-CBA, CMOS-CBA, COSSAP, DESIGN (ARROWS), DesignPower, DesignWare, dont_use, EPIC, ExpressModel, in-Sync, LM-1000, LM-1200, Logic Modeling, Logic Modeling (logo), Memory Architect, ModelAccess, ModelTools, PathMill, PLdebug, RailMill, SmartLicense, SmartLogic, SmartModel, SmartModels, SNUG, SOLV-IT!, SourceModel Library, Stream Driven Simulator, Synopsys, Synopsys (logo), Synopsys VHDL Compiler, Synthetic Designs, Synthetic Libraries, TestBench Manager, and TimeMill are registered trademarks of Synopsys, Inc 3-D Debugging, AMPS, Behavioral Compiler, CBA Design System, CBA-Frame, characterize, Chip Architect,
Compiled Designs, Core Network, Core Store, Cyclone, Data Path Express, DataPath Architect, DC Expert, DC Expert Plus, DC Professional, DelayMill, Design Advisor, Design Analyzer, Design Compiler, DesignSource, DesignTime, DesignWare Developer, Direct RTL, Direct Silicon Access, dont_touch, dont_touch_network, ECL Compiler, ECO Compiler, Embedded System Prototype, Floorplan Manager, Formality, FoundryModel, FPGA Compiler, FPGA Express, Frame Compiler, General Purpose Post-Processor, GPP, HDL Advisor, HDL Compiler, Integrator, Interactive Waveform Viewer, Library Compiler, LM-1400, LM-700, LM-family, Logic Model, ModelSource, ModelWare, Module Compiler, 3200, MS-3400, Power Compiler, PowerArc, PowerGate, PowerMill, PrimeTime, RTL Analyzer, Shadow Debugger,
Contents
1. Overview
Primary DVE Components . . . 1-2 Top Level Window . . . 1-2 Status Bar . . . 1-5 Source Window . . . 1-6 Assertion Window . . . 1-7 Wave Window . . . 1-8 List Window . . . 1-11 Schematic Window . . . 1-12 DVE Usage Flow . . . 1-14 Debugging VCS and VCS MX Designs . . . 1-14 Designs with Assertions (post-processing) . . . 1-17 Key Terms and Concepts . . . 1-19 2. Getting Started
Enabling Debugging . . . 2-2 Starting DVE . . . 2-3 Running a Quick Start Example . . . 2-4
Opening a Database . . . 2-6 Setting Up and Starting an Interactive Session . . . 2-7 Running the Simulation . . . 2-9 Using the Hierarchy Browser. . . 2-12
Expanding Scopes Individually . . . 2-12 Expanding Multiple Scopes or by Level . . . 2-13 Loading the Variable Pane and Source Window . . . 2-14 Using Breakpoints in Interactive Simulation . . . 2-16 Line Breakpoints . . . 2-16 LIne, Time and Signal Condition Breakpoints . . . 2-17 Viewing Assertion Data . . . 2-19 Viewing Waveform Information . . . 2-20 Viewing Source Code . . . 2-24 Viewing Tabular Data. . . 2-25 Saving a Session. . . 2-26 Loading a Saved Session . . . 2-27 Closing a Database . . . 2-28 Exiting DVE . . . 2-28 3. Using the Top Level Window
Docking and Undocking Windows and Panes . . . 3-26 Setting Display Preferences . . . 3-26 Using the Hierarchy Browser. . . 3-28 Navigating the Hierarchy . . . 3-30 Scope Types and Icons . . . 3-34 Using the Data Pane . . . 3-36 Rearranging Hierarchy Information . . . 3-38 Viewing Multiple Designs . . . 3-39 Using Context Sensitive Menus. . . 3-40 Using Source Windows . . . 3-41 Loading Source Code . . . 3-42 Using the mouse in the Source Window . . . 3-46 Working with the Source Window . . . 3-47 Setting Time Units and Precision . . . 3-55 Managing Breakpoints in Interactive Simulation . . . 3-56 Creating Line Breakpoints . . . 3-56 Creating a Time Breakpoint . . . 3-59 Creating a Signal Breakpoint . . . 3-60 Enabling, Disabling, and Deleting Breakpoints . . . 3-61 Displaying Drivers and Loads . . . 3-62 Displaying an Active Driver . . . 3-62 Displaying an Active Load . . . 3-64 Displaying Memory . . . 3-65 Customizing Memory Display . . . 3-66 Using the Console . . . 3-67 Log View . . . 3-68 History View . . . 3-69
Errors/Warnings View . . . 3-70 Command Line . . . 3-72 4. Using The Wave Window
Viewing Waveform Information . . . 4-2 Setting Wave Window Preferences . . . 4-4 Using the Signal Pane. . . 4-5 The Display Radix . . . 4-6 Expanding Verilog Vectors, Integers, Time and Real Numbers . 4-6 Using User-Defined Mnemonic Radices . . . 4-7 Creating a User-Defined Radix . . . 4-7 Managing User-Defined Radices . . . 4-8 Importing and Exporting a User-Defined Radices . . . 4-8 Setting Signal Groups . . . 4-9 Using the Waveform Pane. . . 4-10
How The Wave Window Displays Values . . . 4-12 Displaying Analog Waveforms . . . 4-14 Cursors and Markers . . . 4-15 Using The Markers Dialog Box . . . 4-18 Drag Zooming . . . 4-19 Expanding and Contracting Wave Signals. . . 4-20 Searching in the Graphical Panes . . . 4-20 Customizing the Display . . . 4-21
5. Working with Assertions
Compiling SystemVerilog Assertions. . . 5-4 Using the Assertion Failure Summary Tab . . . 5-4 Using the Assertions Tab. . . 5-6 Customizing the Display . . . 5-8 Opening Assertion Display in a Top-Level Window . . . 5-9 Displaying Assertion Attempts in the Waveform Window . . . 5-9 Viewing Assertion Failures. . . 5-10 Assertions in The Signal Pane. . . 5-12 Navigating Source Code . . . 5-15 6. Using the List Window
The List Window . . . 6-2 Displaying Data . . . 6-3 Dragging and Dropping Signals into the List Window . . . 6-3 Opening a Database . . . 6-3 Loading a Session . . . 6-4 Navigating Simulation Data . . . 6-4 Viewing Data in the List Window . . . 6-4 Using Markers . . . 6-6 Customizing the Display . . . 6-7 Setting Preferences . . . 6-8 Setting Signal Properties . . . 6-9 Comparing Signals . . . 6-10 Saving a List Format . . . 6-13
7. Using Schematics
Overview . . . 7-2 . . . . Managing Schematic Displays . . . 7-3
Customizing the Display . . . 7-4 Displaying Schematic Graphics . . . 7-6 Using the Context-Sensitive Menu. . . 7-7 Opening a Design Schematic View . . . 7-7 Opening a Path Schematic View . . . 7-10 Manually Tracing Signals . . . 7-14 Following a Signal Across Boundaries . . . 7-15 Tracing X Values in a Design . . . 7-16 8. Displaying Delta Cycles
Delta Cycle Recording for Verilog . . . 8-1 Delta Cycle Recording for VHDL . . . 8-2 Delta Cycle Recording for Mixed Designs for VCS MX . . . 8-3 Using Delta Cycles . . . 8-3 Expand and Collapse Times . . . 8-3 View Delta Cycles . . . 8-4 9. Basic Navigation Techniques
Using Toolbar Icon Sets as Floating Tool Palettes . . . 9-13 Minimizing, Maximizing, and Moving Toolbar Icon Sets . . . 9-16
About this Manual
FIX ME!
This manual explains the use of Discovery Visual Environment (DVE) for running and debugging active simulations and historical records of simulations and where appropriate, provides conceptual information to help you understand the application of DVE features.This preface covers the following topics: • Audience
• Licensing • Platforms
• Other sources of information • Conventions
Audience
The DVE User Guide provides product description, tutorial, and reference information to help you use the DVE simulation debug environment. The information in this document serves as a primary reference source and procedural guide for DVE users. This guide assumes that the user has the following background.
• Working knowledge of hardware design languages (HDLs), the construction of designs, verification tools, and a working knowledge of HDL simulators.
. The DVE licenses float and are independent of each other.
Other Sources of Information
For more information about DVE and other Synopsys products, refer to the following sections.
SOLV-IT! Online Help
SOLV-IT! is the Synopsys electronic knowledge base. It contains information about Synopsys and its tools and is updated daily.
Access SOLV-IT! through e-mail or through the World Wide Web (WWW). For more information about SOLV-IT!, send e-mail to
Customer Support
If you have problems, questions, or suggestions, contact the DVE technical support in one of the following ways:
• Send e-mail to [email protected] • Call 1-800-837-4564 (1-800-VERILOG)
1
Overview
1
Discovery Visual Environment (DVE) software is a graphical verification environment that supports debugging for VCS and VCS MX simulations. This release of DVE allows you to work in post-processing and interactive mode.
Using DVE, you can perform the following tasks:
• Hierarchically expand and view HDL scope information related to assertions.
• Debug assertions.
• View log, history, and error/warning information related to your analysis.
• Perform TCL tasks by executing scripts from the DVE graphical user interface or executing TCL commands or sourcing scripts through the command-line interface.
Primary DVE Components
This section provides an overview of the following core components of DVE:
• Top Level Window
• Source Window
• Assertion Window
• Wave Window
• List Window
• Schematic Window
Top Level Window
The Top Level Window is a frame that can contain the other windows. A Top Level Window has menus, toolbars and statusbar. From the Top Level Window, you can:
• Use the Menu bar, Toolbar, and Status Bar to run and interact with a simulation or open, view, navigate, edit, and close a design database and set the target for new panes and windows
containing source code, waveforms, schematics, and ASCII data. You can specify analysis and search parameters, invoke TCL
• View and filter signal information. Double click a signal of interest to view source code or drag and drop it into another DVE pane or window. Dragging and dropping is supported in the Data Pane, Source, Wave, List, and Assertion windows.
• View HDL or Assertion source code in the Source Window or in multiple Source Windows.
• View assertion failures and history.
• Perform TCL tasks by executing scripts from the DVE graphical user interface or executing TCL commands or sourcing scripts through the command-line interface.
• Activate any open DVE window or pane regardless of where it is in the desktop window stack.
• Access DVE windows, such as the Waveform Window and List Window, to debug your design.
The basic techniques for using the Top Level Window are described in detail in Chapter 3, "Using the Top Level Window."
Figure 1-1 DVE Top Level Window Initial View
Menu Bar
Toolbar Hierarchy Browser
Source Window Data Pane
Status Bar
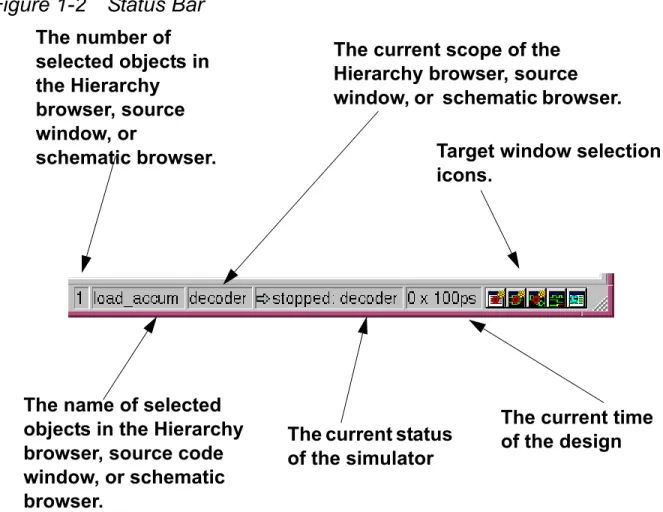
The status bar in the lower left corner of the Top Level Window displays information about your simulation. Figure shows the information displayed in the status bar boxes.Status Bar
Figure 1-2 Status Bar
The number of selected objects in the Hierarchy browser, source window, or
schematic browser.
The name of selected objects in the Hierarchy browser, source code window, or schematic browser.
The current scope of the Hierarchy browser, source window, or schematic browser.
The current time of the design The current status
of the simulator
Target window selection icons.
Source Window
In addition to viewing source code in the Source Window, you can open multiple tabs or freestanding Source Windows. You display HDL, testbench, and assertion source code by double-clicking an item in a list or by dragging and dropping a signal or assertion from another DVE window.
Figure 1-3 Source Window
Line Attributes
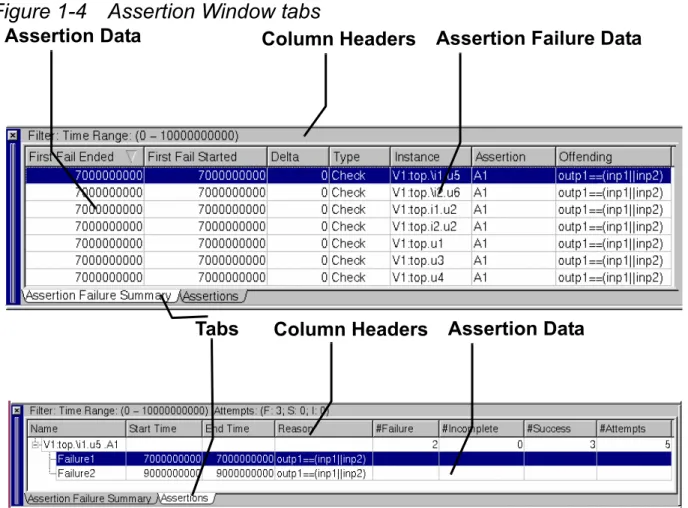
Assertion Window
Use the Assertion Window tabs to view assertions and assertion failures:
• Assertion Failure Summary tab: Displays a summary of one failed attempt for every failing assertion. By default the failed attempt is the first attempt that failed.
• Assertions tab: Totals results for all assertions in a selected block or scope. Also allows analysis of results of specific assertion attempts.
Figure 1-4 Assertion Window tabs
Assertion Data Column Headers Assertion Failure Data
Assertion Data Column Headers
Wave Window
The Wave Window displays
• Waveforms of selected signals in your design.
• Trace information for a particular assertion, along with a waveform of the signals and expressions associated with the assertion.
Displaying Signals in the Wave Window
Use the Wave Window to view and highlight signals of interest, advance to various simulation times, and view simulation time deltas. To view signals in the Waveform Window, you can double click an an assertion summary item or an attempt, drag and drop an item in a list or select an item and select Add to Waves from the menu.
Figure 1-5 shows an example of the Waveform Window displaying signals. Cursor 1 (C1) indicates current time.
Figure 1-5 Waveform Window
Viewing Assertions and Assertions Attempts
You debug assertions by first displaying information for a particular assertion failure in the Assertion Window, You can then examine a waveform of the signals. All trace information is color-coded for easy readability and analysis.
Typically, you access and view an assertion by double-clicking a particular assertion in either of the following windows:
• The Assertion Window (located in the Console of the Top Level Window)
• The Hierarchy Browser by navigating to the assertion.
Signal list Cursor C1 Waveforms Signal group name
Or you can drag and drop an OVA assertion unit from the Hierarchy Browser or an OVA or SVA assertion from the Data Window into the the Wave Window (double click to display the source code in the Source Window).
You can then view a trace of a failed assertion by double clicking a failed attempt (a red up arrow) in the Wave Window.
Figure 1-6 shows an example of the Waveform Window. displaying a trace of a failed assertion attempt. The cursors mark the start and end times of the failure and the background color is also different to indicate the assertion time region. This lighter color persists if the cursors are moved to make it easy to identify the assertion region.
Figure 1-6 Waveform Window displaying a trace of a failed assertion attempt
List Window
Use the List Window to generate ASCII simulation results. The List Window displays simulation data as shown in the Wave Window but in tabular format. It is a scrollable window, showing simulation time on the left.
Start time of assertion failure
End time of assertion failure Assertion and
Figure 1-7 List Window
Schematic Window
Figure 1-8 . Design Schematic
• A path schematic is a subset of the design schematic displaying where signals cross hierarchy levels. Use the path schematic to follow a signal through the hierarchy and display portal logic (signal effects at ports).
Figure 1-9 Path Schematic
1. For post-processing using VCS MX mixed HDL, Verilog-only, or VHDL-only designs, run the appropriate simulator to create a VPD file. See the VCS MX User Guide or the VCS User Guide for complete instructions.
2. Start DVE and open the VPD file.
3. Use the Hierarchy Browser to find an HDL signal.
4. Populate the Data Pane and Source Window. A single click populates the Data Pane. A double click populates both the Data Pane and the Source Window.
Note that information displayed in the DVE interface is cross-linked.
5. Investigate the design results by doing the following: - View source code information in the Source Window. - Trace signal waveform information in the Wave Window. - View signal data in tabular format in the List Window.
- View the design graphically in the Schematic Window and the Path Schematic Window.
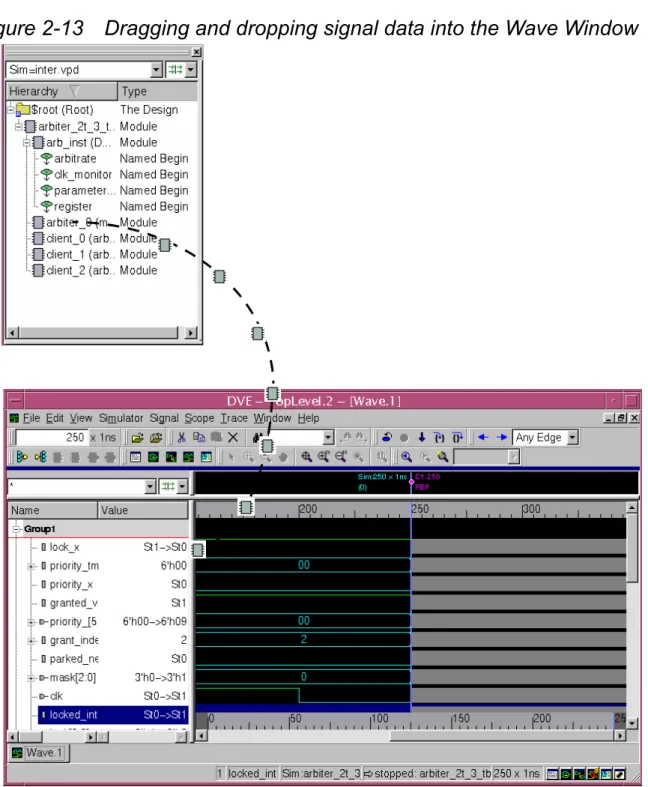
6. View waveform information for selected signals by opening the Wave Window and dragging and dropping scopes from the Hierarchy Browser.
7. View additional assertion and scope information by dragging and dropping HDL signals of interest from the Hierarchy Browser or Data Window to the Wave Window.
VCS and VCS MX in Interactive Mode
The following steps outline the general flow for using DVE with VCS MX in interactive mode:
1. For interactive debugging using VCS MX mixed HDL, Verilog-only, or VHDL-only designs, first compile your design. See the VCS MX User Guide or the VCS User Guide for complete instructions. 2. Start DVE and open the compiled design file.
3. Use the toolbar commands to navigate through the design. Or
Use the command line to enter TCL and Unified Command Line Interface commands.
4. Use the Hierarchy Browser to view design structure and find HDL signals.
5. Populate the Data Pane and Source Window. A single click populates the Data Pane. A double click populates both the Data Pane and the Source Window.
Note that information displayed in the DVE interface is cross-linked.
6. Use the Source Window or the command line to set breakpoints in your design.
8. View waveform information for selected signals by opening the Wave Window and dragging and dropping scopes from the Hierarchy Browser.
9. View additional assertion and scope information by dragging and dropping HDL signals of interest from the Hierarchy Browser or Data Window to the Wave Window.
Designs with Assertions (post-processing)
The following steps outline the general flow for using DVE with assertions:
1. For post-processing using HDL and assertion source files, run the appropriate simulator to create a VPD file. This process integrates assertion data within the VPD file.
Note: Use the VCS -assert dve command line switch with the -PP flag to enable SVA tracing in DVE. If you do not enable SVA tracing, assertion value changes will still be dumped into the VPD file and be visible in the Wave Window, but assertion attempts cannot be traced.
2. Start DVE and open the VPD file.
3. Use the Hierarchy Browser to find an HDL signal or an assertion or use the Assertion Failure Summary tab to identify an assertion failure.
4. Populate the Data Pane and Source Window. A single click populates the Data Pane. A double click populates both the Data Pane and the Source Window.
Note that information displayed in the DVE panes windows is cross-linked.
5. In the Assertion Window, double click an assertion failure in the Assertion Failure Summary tab to populate the Assertion tab with data for the assertion unit the failed assertion belongs to. In the assertion tab, expand the tree, and review detailed assertion statistics, such as assertion attempts, failures, successes and incomplete attempts, as well as start/end times, and reasons for failures. Double clicking also populates the Wave Window with trace information and displays all the pertinent source files. 6. Investigate the cause of an assertion failure by doing the following:
- View source code information in the Source Window.
- Trace assertion and related signal waveform information in the Wave Window.
- View signal data in tabular format in the List Window.
7. View waveform information for selected signals by opening the Wave Window and dragging and dropping scopes from the Hierarchy Browser.
8. View additional assertion and scope information by dragging and dropping HDL signals of interest from the Hierarchy Browser or Data Window to the Wave Window.
Key Terms and Concepts
The DVE User Guide uses the following terms and concepts in feature descriptions and procedures:
Assertion An OVA or SVA statement used to specify
design behavior. An assertion is used as a monitor to detect incorrect design behavior in dynamic simulation, or as a property to be proven exhaustively using formal verification.
Assertion Attempt A specific instance of an assertion (a specific firing of an assertion).
Context Sensitive Menu (CSM)
A menu that pops up when you right click on a particular item. The menu selections vary depending on the particular item you clicked.
Drag and Drop Position your mouse pointer on a GUI object (such as a signal or scope name) press and hold down your left mouse button, move your mouse to a different location, then release the mouse button. In DVE, you can drag scopes and signals from one window or dialog and drop them into another window or dialog.
Expand and Collapse
Click on a plus (+) symbol to expand or a minus (-) symbol to collapse a hierarchy tree.
OVA OpenVera Assertions — a declarative method that describes sequences of events and facilities to test for their occurrence.
Pane Panes are sub-windows within DVE
windows that display specific types of information. For example, the Waveform Window contains separate panes for signal names, signal values, and signal
waveforms.
Scope (Verilog) In Verilog, a scope is defined as any instance of a module, task, function, or named block in the Verilog Hardware Description Language (HDL) source code. Scope (VHDL) In VHDL, a scope is any instance of an
entity/architecture component. (The entity/ architecture component is analogous to a module in the Verilog language.) Blocks, Packages, Processes, Procedures, and Functions are also considered scopes.
SVA SystemVerilog Assertions — a declarative method that describes sequences of events and facilities to test for their occurrence. SVA is part of the proposed SystemVerilog extension to the Verilog language.
Note: Use the VCS -assert dve
command line switch with the -PP flag to enable SVA tracing in DVE. If you do not enable SVA tracing, assertion value
changes will still be dumped into the VPD file and be visible in the Wave Window, but assertion attempts cannot be traced. Variable or Signal
(Verilog)
In Verilog, the term "variable" is used interchangeably with the term "signal". Variable was adapted from the standard VCD technology and can refer to any of the following Verilog terms: Net, Reg, Real Number, Integer, Named Event, and Time Variable.
Variable and Signal (VHDL)
The VHDL language distinguishes between signals and variables. In general, DVE uses the term signals to refer to both signals and variables. There are some exceptions to this rule, but these exceptions are either explicitly stated or implied by the context of its usage. (For example, a dialog that has both a selection for Signals and a selection for Variables is obviously distinguishing between the two.) It is also important to recognize that because most variables are dynamic, simulators may not trace them and consequently they will not show up in the hierarchy.
Verilog Language DVE uses standard Verilog and SystemVerilog terms, including the
language, keywords, syntax, system tasks, and PLI calls.
VHDL Language DVE uses standard VHDL terms including the language, keywords, syntax, etc. Window An area of the screen that displays the user
interface for a DVE application. A window can contain a menubar, a toolbar, and panes that display specific types of information.
2
Getting Started
1
This chapter describes the basic techniques for getting started using DVE The following topics are covered:
• Enabling Debugging • Starting DVE
• Running a Quick Start Example • Opening a Database
• Using the Hierarchy Browser
• Loading the Variable Pane and Source Window • Viewing Waveform Information
• Viewing Source Code • Viewing Tabular Data
• Exiting DVE
Enabling Debugging
This section describes how to enable debugging options for your simulation.
Compile-Time Options
-debug
Enables DVE and command line debugging option. This option does not enable line stepping. '
-debug_all
Enables command line debugging option including line stepping.
-debug-pp
Creates a VPD file (when used with the VCS system task $vcdpluson) and enables DVE for post-processing a design. Using -debug-pp can save compilation time by eliminating the overhead of compiling with -debug and -debug_all.
-ucli
Forces runtime to go into UCLI mode by default Also see the following section, Runtime Options, for more information.
Runtime Options
-gui
Invokes DVE at runtime.
-ucli
Invokes the UCLI debugger command line if issued at runtime. Also see the previous section, Compile-Time Options, for more information.
-l logFilename
Captures simulation output, such as user input commands and responses to UCLI commands.
-i inputFilename
Reads interactive commands from a file, then switches to reading from standard command line input.
-k keyFilename
Writes interactive commands entered to keyFilename, which can be used by a later simv as -i inputFilename
Starting DVE
To start DVE, enter the -gui runtime option. For example, to run DVE with a VCS simulation, enter:
% simv -gui
The DVE Top Level Window appears displaying the Hierarchy Browser, Data Pane, Source Wndow, and Console.
Note that to enable line stepping in your simulation, you must use the -debug_all compile-time option when compiling your design.
See Figure 2-1 for an example of the initial appearance of the DVE Top Level Window.
Figure 2-1 Initial appearance of the Top Level Window
1. Create and change directories to a work directory where simulation files can be written (DVE will run the testcase simulation).
2. In the Toolbar of the Top Level Window, click the example icon denoted by the lightening bolt .
DVE runs the simulation and loads it. Note that data initially appears in the Hierarchy Browser within the Top Level Window.
Figure 2-2 Initial Appearance of Quick Start Example
Initial
appearance of data in Hierarchy Browser
If you select an example with assertions, the Assertion Window also opens and displays the Assertion Failure tab as shown in Figure 2-3.
Figure 2-3 Assertion Window displaying Assertion Failure Summary tab:
Opening a Database
In addition to the quick start example, you can load and display any number of VPD files for post-processing. To open a database in DVE: 1. Do either of the following:
- From the Menu bar, select File>Open Database. - From the Toolbar, click the Open Database icon . The Open Database dialog box appears.
Figure 2-4 Open Database Dialog Box.
2. In the Open Database dialog box, browse and select the name of the VPD file you want to load.
3. Enter or accept a Designator for your design. 4. Enter a time range to load.
5. Click OK.
DVE loads the selected VPD file.
Setting Up and Starting an Interactive Session
In addition to loading VPD files for post-processing, you can also setup and run a simulation interactively in real-time using a compiled Verilog, VHDL, or mixed design.
1. Select Simulator>Setup to display the Simulation Setup dialog box (see Figure 2-5).
Figure 2-5
2. Browse to a simulator executable if renamed.
3. Select simulator arguments. You can enable line stepping and value compile by entering debug_all.
4. Select or browse to an interactive .vpd file. 5. Click OK to set up the simulation.
Running the Simulation
This section describes using DVE to run and control the simulation. The following topics are covered:
- Using the Toolbar
- Using Simulator Menu Commands - Using the Command Line
Using the Toolbar
When you start the simulation, DVE activates toolbar commands for running and controlling the simulation. Click the following icons in the toolbar to control the simulation.
Icon Description
Stop
When the simulation is running, this icon is activated. Click to stop the simulation.
Continue
Continue until the next valid breakpoint (monitor), user interrupt, or the end of simulation.
Step
Move the simulation forward in time as set by the Simulator>Set Step Time command. step will step into task and functions.
Using Simulator Menu Commands
After you start the simulation, you can use menu commands to run and control the simulation.Select the following commands to control the simulation
Next
For VHDL code, next steps over tasks and functions.
Command Description
Stop Stops the simulation.
Continue Continue until the next valid breakpoint (monitor), user interrupt, or the end of simulation.
Step Move the simulation forward in time as set by the Simulator>Set Step Time command. step will step into task and functions.
Next For Verilog code, next steps over tasks and functions.
Terminate Finishes simulation and ends the interactive session.
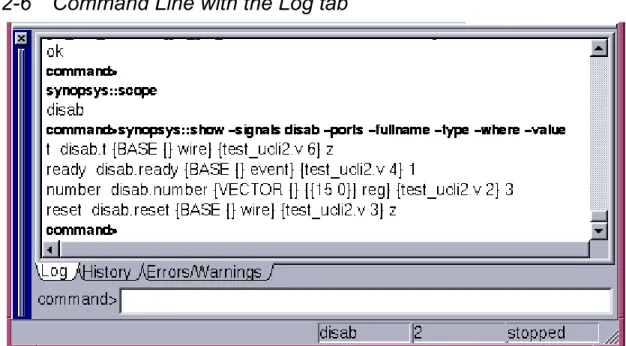
Using the Command Line
Use the command line at the bottom of the DVE top level window to enter DVE and Unified Command Line Interface (UCLI) commands to run and control your simulation. Figure 2-6 shows the command line where you enter commands with the results displayed in the Log tab above the command line.
Figure 2-6 Command Line with the Log tab
To view DVE commands, enter
help -gui
For complete information on using UCLI, see the Unified Command Language User Guide. For a quick view of the UCLI commands and their use, at the DVE command prompt, enter
help -ucli [argument]
When entered without an argument, a list of UCLI commands and a short description is displayed. Enter a command name as the
The UCLI commands and definitions are displayed.
Using the Hierarchy Browser
Use the Hierarchy Browser to navigate designs. When multiple designs are open, you can select which design to display from the pulldown menu and filter the signals displayed in the hierarchy. When a design is initially loaded in DVE, the scopes will appear in a
collapsed view within the Hierarchy Browser.
Expanding Scopes Individually
1. In the Hierarchy Browser, click on a icon, located to the left of a scope.
2. Continue to click the icons to expand the hierarchy tree.
Expanding Multiple Scopes or by Level
1. With a scope selected in the Hierarchy Browser, right-click , select
Edit > Expand by Levels, then select the level as shown below (You can also right-click to display the context-sensitive menu):
2. Select a command according to the following:
Command Description
Expand By Levels Allows expansion by multiple levels with a single action.
Expand All Expands the entire hierarchy at once. There may be a delay getting the hierarchy from the simulation when working interactively.
Loading the Variable Pane and Source Window
After identifying a scope of interest in the Hierarchy Browser, you can load, filter, and view detailed variable data and source code for a scope and filter variables displayed.
To load data in the Variable Pane and Source Window:
1. Make sure a database is currently loaded in the Hierarchy Browser.
2. Do either of the following:
- To populate the Variable Pane with data, click a scope icon in the Hierarchy Browser.
- To populate the Source Window, select Scope > Show Source. See Figure 2-7.
Collapse Collapses the selected scope. Collapse All Collapses all expanded scopes.
Select Levels Allows selection of scopes by multiple levels.
Select All Selects the entire hierarchy.
Figure 2-7 Appearance of data in the Variable Pane and Source Window
Selected scope
Variable Pane
Source Pane
Using Breakpoints in Interactive Simulation
When you are working in an interactive session, you can set
breakpoints to stop a running simulation at specified lines, times, or signal conditions. This section describes using DVE to create, view, edit, enable, disable, and delete breakpoints.
Note: To use line breakpoints, you must have compiled your design using the -debug_all compile-time option.
Line Breakpoints
When you display code in the Source Window during an interactive session, Source Window Breakpoint control commands become active and breakable lines are displayed with a green circle in the line attribute area (Figure 2-8).
1. To set breakpoints at selected lines of code, select a line with a green circle in the line attribute area.
2. Right-click in the line attribute area, then select Set Breakpoint.
A red circle replaces the green circle indicating the breakpoint is enables.Figure 2-8 shows an active breakpoint at line 12.
Figure 2-8 Line Breakpoints in the Source Window
3. To select a breakpoint control commands, right-click in the line attribute area, then select Disable Breakpoint, Enable
Breakpoint, or Delete Breakpoint.
LIne, Time and Signal Condition Breakpoints
This section describes how to use the Breakpoints dialog box to set and control breakpoints. Note you can also set line breakpoints in the Breakpoints dialog box. For more information on breakpoint types, see
1. Select Simulator>Set Breakpoints to display the Breakpoints dialog box.
2. Click Define to display breakpoint definition tabs for creating Line, Time, and Signal breakpoints. Figure 2-9 shows the dialog box.
Figure 2-9 Breakpoints dialog box
3. Click Tips to get help, then follow the directions on the screen. After creating breakpoints, you can control them from the upper portion of the dialog box.
For more information on using breakpoints, see Chapter 3, Managing Breakpoints in Interactive Simulation.
Viewing Assertion Data
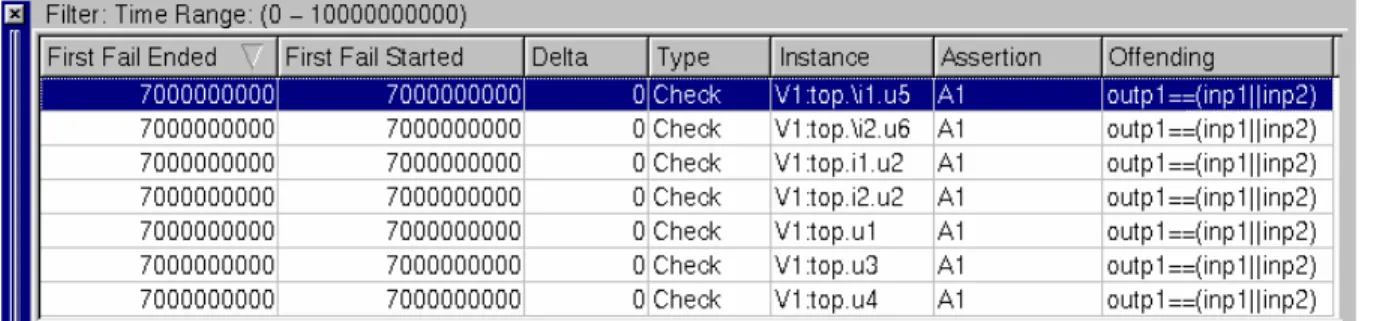
If your design contains assertions, the Assertion Window displays when you start a simulation or load a database. The Assertion Failure summary tab displays assertion failures and data describing any failures. Figure 2-10 shows the tab with failures listed.
Note: Use the VCS -assert dve command line switch with the -PP
option to enable SVA tracing in DVE. If you do not enable SVA tracing, assertion value changes will still be dumped into the VPD file and be visible in the Wave Window, but assertion attempts cannot be traced.
Figure 2-10 Assertion Failure Summary
To view an assertion of interest, double click the assertion in the tab. The result is:
• The Hierarchy Browser scrolls to the selected assertion.
• The Variable Pane lists variables in the OCA unit of the selected assertion and the assertions.
• The Assertion tab displays all assertions in the selected unit and information relating to each.
• The Wave Window opens displaying the selected assertion with the start and end time of the failure highlighted.
1. To view assertion failure data do one of the following:
- Drag the scroll bar to the left to view any columns not displayed. - To expand the window to show all columns, select a corner or
edge of the window and drag it.
2. To customize the display do one or all of the following:
- Click on a column header to sort the displayed information by the header.
- Select the right edge of a column in the header and drag it right to make the column wider or to the left to make it smaller or hide the column.
- Select a column header item and drag and drop it to change the order of the columns.
3. Expand the display of assertions by clicking the icon.
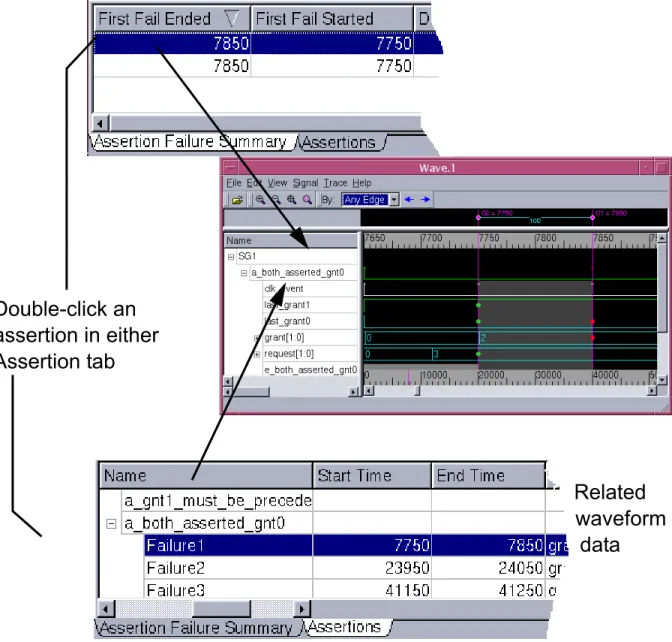
• Waveform information as it relates to assertions. • Waveform information for selected signals of interest. To display waveform assertion information:
• Double-click an assertion of interest either in the Assertion Failure Summary tab or the Assertions tab.
The Wave Window appears and displays waveform data related to the selected assertion.
Figure 2-12 Viewing assertion data in the Wave Window
Double-click an assertion in either Assertion tab
Related waveform
Viewing Source Code
Notice that when you double-click a scope in the Hierarchy Pane, a signal in the Wave Window, an assertion in the Assertion Window, the Source Window automatically displays the associated HDL or assertion source code.
Figure 2-14 Display of Source Code in the Source Window
Related source code
Viewing Tabular Data
The List Window displays simulation results in tabular format. For Verilog, the List Window supports nets and register variables. For VHDL, it displays signals and process variables.
To display simulation data in the List Window:
1. Open a List Window by selecting in the toolbar or
Window>New >List Window.
2. Drag and drop a scope of interest from a DVE window such as the Hierarchy Browser to the List Window.
Or
Right-click and select Add to Lists from the context sensitive menu..
The data is displayed in the default format.
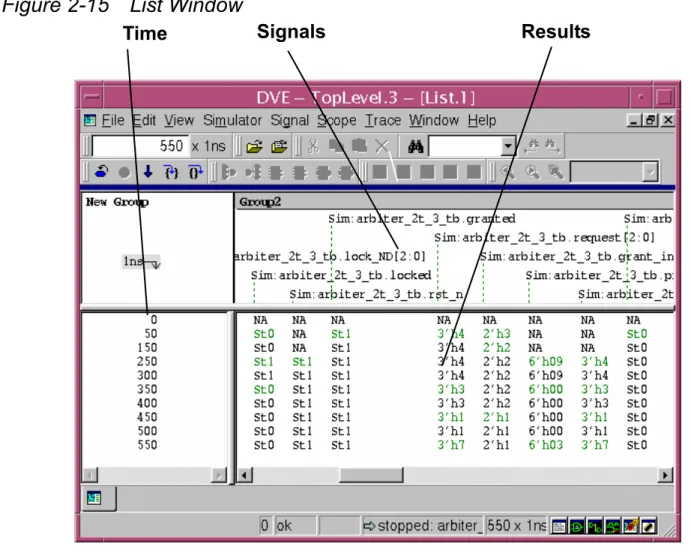
3. To view signal data, select a signal to highlight the signal values as shown in Figure 2-15.
Figure 2-15 List Window
4. To save the data in ASCII format, select File>Dump, select
Tabular List or Event Based List, then enter a name for the file.
1. Select File>Save Session.
2. In the Save Session dialog box, enter a file name for the session. 3. Select Save only current view to save only the current Lists
window data. 4. Click Save.
Loading a Saved Session
To load a saved session:
1. Select File>Load Session.
2. In the Load Session dialog box, browse to the session and select it from the list of TCL files.
3. Click Load.
Closing a Database
To close a currently open database: 1. Do either of the following
- Select File>Close Database.
- Click the Close Database icon in the Toolbar. The Close Database dialog box appears. See Figure 2-16.
Figure 2-16 Close Database Confirmation Dialog Box
2. Make sure the correct database is selected, then click OK.
3
Using the Top Level Window
2
In DVE, the top level window can contain any other DVE panes and windows. There can be any number of top level windows open at any time. Each has a full menubar and toolbar, though active items depend upon windows or views open in a top level window (for example, Schematic menu commands are active when a Schematic Window is active in a top level window).
This chapter describes how to use the basic components of the DVE
Top Level Window as it appears when you open DVE. Other windows, which can be displayed in a top level window, are described in chapters that follow.
• Using the Menu Bar and Toolbar • Using the Hierarchy Browser • Using the Data Pane
• Using Source Windows • Using the Console
Using the Menu Bar and Toolbar
The Menu Bar and Toolbar provide you options for performing standard simulation analysis tasks, such as opening and closing a database, moving the waveform to display different simulation times, or viewing HDL source code.
This section covers the following topics: • Menu Bar Reference
• Toolbar Reference
Most items in the Menu Bar correspond to icons or text fields in the Toolbar. For example, you can set the simulation time display in the waveform by doing either of the following:
• Select View>Go To Time, then enter a value in the Go To Time dialog box, and click Apply or OK.
• Enter a value in the Time text field on the Toolbar, then press
Return on your keyboard. See Figure 3-1 for an example.
Figure 3-1 Methods for Setting the Simulation Time
Select View>Go To Time, enter a value in the Go To Time dialog box, then click Apply or OK.
Enter value in Time text field of the Toolbar, then press the Return key.
Results: Waveform display moves to specified
simulation time.
Note:
• For complete descriptions of all Menu Bar and Toolbar functions, see "Using the Menu Bar and Toolbar".
• For complete descriptions of setting the simulation time and using the Waveform Window, see Chapter 4, "Using The Wave
Window."
Menu Bar Reference
This section provides an overview of the following Top Level Window menus:
• File Menu • Edit Menu • View Menu • Simulator Menu • Signal Menu • Trace Menu • Window Menu • Help Menu
File Menu
The following items comprise the File menu:
Open Database Displays the Open Database dialog box, which enables you to select and open simulation database (VCD or VPD) files for post-processing.
Close Database Displays the Close Database dialog box, which enables you to close an open simulation database (VPD) file.
Reload Database Load the previously opened database.
Open File Displays the Open Source File dialog box, which enables you to select and display a source file in the Source Window.
Close File Closes the source file displayed in the active Source Window or Window.
Dump Values Save current signal data in Tabular List or Event Based List, or entire Memory Contents.
Execute TCL Script Displays the Execute TCL Script dialog box, which enables you to select and source a TCL script. Load Session Displays the Load Session Dialog which enables you
to Load a saved session.
Recent Databases Displays a list recently opened databases to choose from.
Recent Tcl Scripts Displays a list recently run scripts to choose from Recent Sessions Displays a list recently opened sessions to choose
from
Save Session Displays the Save Session Dialog which enables you to Save the current session.
Close Window Closes the currently active pane in the Top Level Window.
Edit Menu
The following items comprise the Edit menu:
Cut Allows cutting of selection from any editable window. Copy Allows copying of selection from any DVE window.
Paste Allows pasting of cut or copied selection into any editable DVE window or application.
Delete Allows deletion of selection from any editable DVE window. Expand By
Levels
Allows expansion by multiple levels with a single action. Expand All Expands the entire hierarchy at once. There may be a delay
getting the hierarchy from the simulation when working interactively.
Collapse Parent
Collapses the parent of the selected scope. Collapse All Collapses all expanded scopes.
Synchronize Selection Select Scope By Levels
Allows selection of more than 1 level at a time.
Select All Selects all that are visible (does not implicitly expand)
Find Finds specified text in a DVE pane or window. Field options vary depending on headers, if any, in the selected pane or window. Multiple Find dialog boxes can be open at any time with each identified by in the dialog box name..
View Menu
The following items comprise the View menu:
Markers . . . Displays the Markers dialog box for managing markers. Goto Marker Scrolls the Wave display to the specified marker.
Delete Marker Removes the specified marker. Create
Reference Marker
Displays a reference marker at the specified location.
Show Marker Values
Displays Absolute, Adjacent, or Relative values for signals at a selected marker.
Preferences Opens the Applications Preferences dialog box to allow customization of the display settings on a global or window basis.
Selection
Tool Prepares the cursor for selecting objects (the default cursor). Zoom In
Tool Prepares the cursor for zooming in. The cursor becomes a magnifying glass. Drag a bounding box around the area to enlarge.
Zoom Out
Tool Prepares the cursor for zooming out. The cursor becomes a magnifying glass. Drag a small box to zoom out by a large amount, or a large box to zoom out by a small amount.
Pan Tool Prepares the cursor for panning the
window view. The cursor becomes a hand shape. Point and drag to pan the view.
Zoom Zoom Full Zoom to entire design.
Zoom In Zooms in 2x.
Zoom Fit Selection Zooms to area selected with the Selection Tool.
Zoom Fit Highlight Zooms to highlighted area. Pan To Selection Pans to area selected with the
Selection Tool.
Pan To Highlight Pans to highlighted area. Back in Zoom and
Pan History
Returns to previous zoom or pan setting.
Forward in Zoom
and Pan History Goes to next zoom or pan setting. Named Zoom and
Pan Settings Allows setting zoom parameters. Zoom to Cursors Zooms wave display to cursors C1 and
C2. Zoom to Time
Range Zooms to specified time range.
Set Time
Scale Opens Set Time Units and Scale dialog box for setting display units and precision.
List Window
Time Range Allows setting upper and lower tiime window values in the List Window. Delta Cycle Expand Time View delta cycle information at the
selected time.
Collapse Time Close view of delta cycle at selected time.
Collapse All Close all expanded delta cycle displays.
Go to Time Displays the Go To Time dialog box, where you specify a simulation time. When you click Apply, the C1 cursor (current time) moves to the center of the wave window and makes the new time the current time.
Filter Assertion
Displays the Filter dialog box, which enables filtering assertion data. Increase
Row Height Makes the height of the displayed data greater. Decrease
Row Height Makes the height of the displayed data lesser. Ports and
Signals Filter
Port In Toggles display of input ports.
Port Out Toggles display of output ports. Port Inout Toggles display of inout ports. Port Buffer Toggles display of port buffers.
Signal Toggles display of signals.
Port Linkage Toggles display of VHDL port linkage.
Panes Console Displays Console Pane in active
window.
Hierarchy Displays Hierarchy Pane in active window.
Data Displays Data Pane in active window. Toolbars > Time Operations Toggles the display of the Time
Operations toolbar buttons.
File Toggles the display of the File toolbar buttons.
Edit Toggles the display of the Edit toolbar buttons.
Simulator Menu
The following items comprise the Simulator menu
Simulator Toggles the display of the Simulate toolbar buttons.
Signal Toggles the display of the Signal
toolbar buttons.
Source Toggles the display of the View toolbar buttons.
Trace Toggles the display of the Trace toolbar buttons.
Window Toggles the display of the Window
toolbar buttons.
Help Toggles the display of the Help toolbar buttons.
Schematic Toggles the display of the Schematic toolbar buttons.
Zoom Toggles the display of the Zoom toolbar buttons.
Setup... Displays the Simulation Setup dialog box, which allows you to set the simulator type, executable location and arguments for running an interactive simulation.
Start Starts or terminates and restarts an interactive simulation with the current simulation setup. See Simulate>Setup...
Signal Menu
The following items comprise the Signal menu:
Next Runs the simulator to the next executable line, stepping over functions, tasks, etc.
Delete Breakpoint At Allows deletion of a specified breakpoint. Delete All
Breakpoints
Removes all breakpoints.
Breakpoints Displays the Breakpoints dialog that allows viewing, creating, editing, enabling, disabling, and deleting breakpoints.
Save State Saves the current state for later display. Restore State Redisplays a saved state.
Terminate Finishes simulation and terminates the interactive simulator.
Capture Delta Cycle Values
Saves delta cycle values.
Set Step Time... Displays the Set Continue Time dialog box, which allows you to set the time duration for continuing simulation for a specified time. See Continue. Periodic Waveform
Update Interval
Allows setting of the value interval at which to update display of waveforms.
Signal
Groups Opens the Signal Groups dialog box, which allows you to review and edit signal groups.
Create Signal
Groups Creates a signal group from selected signals.
Display Signal Groups
Adds selected signal groups to display pane.
Display All Signal Groups
Adds all signal groups to display pane.
Add to Waves Displays the selected signals in the Waves
Window
Add to Lists Displays the selected signals in the Lists
Window. Show
Memory
Displays contents of memory variable.
Create Bus Displays the Bus Builder dialog box for
creating buses.
Edit Bus Entity Displays the Bus Builder dialog box for editing the selected bus.
Set
Expression
Displays the expression dialog box for using signals to create expressions. Set Search
Constant Allows selection of a constant search criterion. Search
Backward
Finds the previous specified search constant in the design.
Search Forward
Finds the next specified search constant in the design.
Compare Opens Waveform Compare dialog box for
the selection of signals, scopes, or buses to compare.
Show
Comparison Info
Displays the results of the signal comparison.
Scope Menu
The following items comprise the Scope menu::
Properties Displays the Signal Properties dialog box
which displays data on the selected signal.
Show Source Displays source code for the selected
scope in the Source Window. Show
Scehmatic
Displays design in the Schematic Window. Show Path
Schematic
Displays Path Schematic Window with selected paths.
Move Up to
Parent Displays to the parent source code of the active scope. Move Down
to Definition
Displays the definition source code of the selected text in the active Source Window.
Back Moves back in list of scopes or
schematics.
Forward Moves forward in list of scopes or
schematics.
Show > Current Scope Scrolls Source Window display so that the first line of the active scope is visible. Assertion Scrolls Source Window display so that the
first line of the active assertion unit is displayed.
Unit Binding Scrolls Source Window display so that the first line of the active unit binding is displayed.
Entity Displays the entity source code of the active VHDL architecture in the Source Window.
Trace Menu
The following item comprises the Trace menu:
Architecture Displays the source code of the active VHDL architecture in the Source Window.
Edit Source Opens an editor with the current source
file.
Edit Parent Opens an editor with the parent source of
the current source file.
Expand Path Expands the selected path in the schematic window.
Add Fanin/ Fanout
Allows specification of a design object for fanin or fanout display
Annotate Values
Displays the active scope signal values at the current time in the Source Window.
Properties Displays attributes and values for the
currently displayed schematic objects.
Trace Assertion Displays data for the selected
assertion in the Wave Window. Assertion
Attempts
Displays the Trace Assertion Attempts dialog for displaying attempt trace information in the Wave Window.
Show Drivers and Loads
Displays data pertaining to signal drivers and loads.
Window Menu
The following items comprise the Window menu:
In Previous/Next Instance
Displays the values of drivers and loads for the selected signal in the last or following instance.
Repeat Last Trace Repeats previously performed
trace.
Set Current Color Allows setting of display color
for the selected signal.
Highlight Selected/Selected
by Color
Allows manual tracing of
selected signals in Design and Path Scmematic windows by highlighting of the selected signals based on specified color assignments.
Clear Selected/
Clear /Clear All Clears current, by color, or all signals manually traced using the Highlight command.
Follow Signal Highlights the currently selected
signal in the Path Schematic window and traces it across boundaries.
Stop Following Turns off highlighting of a signal
performed with the Follow Signal Command.
Trace X
New Console Pane Opens a new Console Pane for entering
TCL commands, viewing command logs and assertion first failure results
Hierarchy Pane Opens a new Hierarchy Browser for traversing design and verification hierarchy, if one is not already open. Assertion
Window Opens an Assertion window, if one is not already open. List Window Opens a new List Window or viewing
signal waveforms in tabular format and analyzing assertion results with relevant signal waveforms, if one is not already open.
Source Window Opens a new Source Window outside of the Top Level Window for viewing source files.
Wave Window Opens a new Wave Window for viewing signal waveforms and analyzing
assertion results with relevant signal waveforms.
Schematic
Window Opens a Schematic Window.
Path Schematic
Window Opens a Path Schematic Window.
Panes Console/
Hierarchy/Data/ Assertion
Displays the selected pane in the active top-level window.
New Assertion Window
Opens a new Assertion window.
Help Menu
The following items comprise the Help menu:
New Wave Window
Opens a new Wave Window for viewing signal waveforms and analyzing
assertion results with relevant signal waveforms.
Cascade Arranges all open workspace windows
so they are displayed in a cascade pattern.
Tile Arranges all open workspace windows
so they are displayed in a horizontal tile pattern.
Dock > Left Docks the selected window to the left wall of the Top Level Window.
Right Docks the selected window to the right wall of the Top Level Window.
Top Docks the selected window to the top wall of the Top Level Window.
Bottom Docks the selected window to the bottom wall of the Top Level Window.
Undock Undocks the selected window from the
Top Level Window. Set Default
Wave Window
If more than one Wave Window is being used, sets the most recently active one as the default when context sensitive menus are used.
Set Default
List Window If more than one List Window is being used, sets the most recently active one as the default when context sensitive menus are used.
DVE Help Opens Acrobat Reader with the DVE documentation.
A Quick Start Example
Loads an example design.
Keyboard Shortcuts
File Command Shortcuts
Edit Command Shortcuts
View Command Shortcuts
Ctrl+O open database Ctrl+W close window
Ctrl+X cut
Ctrl+C copy
Ctrl+V paste
DEL delete
Ctrl+Y synchronize selection Ctrl+A select all
Ctrl+F3 find
F3 find next
Shift+F3 find prev
Ctrl+G goto address
ESC selection tool
= zoom in tool
- zoom out tool
Simulator Command Shortcuts
Signal Command Shortcuts
Ctrl+= zoom in Ctrl+- zoom out
Ctrl+T zoom fit selection Ctrl+Alt+T zoom fit highlight Ctrl+Q zoom to cursors Alt+Cursor Left
(Ctrl+U if Alt doesn't work)
back in zoom history
Alt+Cursor Right (Ctrl+Shift+U if Alt doesn't work)
forward in zoom history
Ctrl+F5 start
F5 continue
F11 step
F10 next
Scope Command Shortcuts
Trace Command Shortcuts
Help Command Shortcuts
Ctrl+1 show source Ctrl+2 show schematic Ctrl+3 show path schematic Backspace (no text in
menu)
move up Enter (no text in
menu)
move down
Ctrl+D trace drivers Ctrl+L trace loads
Ctrl+E highlight selected Ctrl+Shift+M clear selected Ctrl+M clear all
CTrl+N next color
F1 help
Toolbar Reference
This section describes all Toolbar text fields, menus, and icons.
Icon Description
Set Time
Displays current time of the C1 cursor. Set the current time by entering a new time in this field.
Precision
Displays the time units for displaying simulation data. Select View > Set Time Scale to set time units and precision.
Open Database or File
Displays the Open Database or Open File dialog box, depending on the DVE window displayed, and enables you to select and open a VPD file.
Close Database
Displays the Close File dialog box, which enables you to close an open VPD file.
Execute Tcl Script
Displays the Tcl Script dialog box, which enables you to select and source a Tcl script.
Close Window
Closes the currently active window??.
Continues running a simulator that was stopped.
Step
Runs the simulator to the next executable line, stepping into functions, tasks, etc.
Next
Runs the simulator to the next executable line, stepping over functions, tasks, etc.
Load Active Scope Values
Gets signal values for the active scope in the source pane from the simulation database.
Annotate Values
Displays the active scope signal values at the current time in the source pane.
Set Breakpoint
Sets a line breakpoint on the selected line in the Source window. Line stepping and simulators will stop on execution of this line.
Clear Breakpoint
Clears a line breakpoint from the selected line in the Source window.
Click to begin an interactive simulation session.
Stop
When the simulation is running, this icon is activated. Click to stop the simulation.
Continue
Continue until the next valid breakpoint (monitor), user interrupt, or the end of simulation.
Step
Move the simulation forward in time as set by the Simulator>Set Step Time
command. step will step into task and functions.
Next
For VHDL code, next steps over tasks and functions.
Annotate Values
Displays the active scope signal values at the current time in the Source Window.
List Window
Opens a new List Window
Source Window
Opens a new Source Window.
Wave Window
Opens a new Wave Window.
Schematic Window
Opens a new Schematic Window.
Opens a new Path Schematic Window.
Managing DVE Windows
A DVE top-level window is a frame for displaying design and debug data. A top-level can contain many any number of DVE windows and panes. You can choose to display data in one or many DVE windows and panes by setting defaults (see the previous section), using the status bar window controls, or docking and undocking windows as you work.
Displaying Data in a New Top-Level Window
A red circle in the status bar window control icon in the lower right corner indicates a new window of that kind will be opened in the currently active top-level window.
To open a window in a new top-level window, click the icon
representing the window you want to display. The circle is removed indicating the next time you open a window of that type, it will openinn a new top-level window.
DVE Help
Click button to activate the help cursor (?) then click on screen item to display help for the selected item.
Quick Start Example
Runs an example DVE session.
Docking and Undocking Windows and Panes
You can use the Windows menu to dock and undock windows and panes.
• Select Windows > Dock in New Row, then select the row position to dock the currently active window.
• Select Windows > Dock in New Column, then select the column position to dock the currently active window.
• Select Undock to detach the currently acitve window or pane.
Setting Display Preferences
You can set preferences to customize the display of DVE windows display in the Hierarchy and Data panes (as well as in the Waves Window Wave Signal Group panes) .
To customize the display:
1. In the Top Level Window, select Edit > Preferences.
The Application Preferences dialog box displays the Global Settings category.