Quarterly Banking Profile
Federal Deposit Insurance Corporation All FDIC-Insured Institutions First Quarter 2014
INSURED INSTITUTION PERFORMANCE
•
Net Income of $37.2 Billion Is $3.1 Billion Below Year-Ago Level
•
Reduced Mortgage Activity Contributes to Decline in Revenue
•
54 Percent of Banks Report Year-Over-Year Improvement in Earnings
•
Balances at Federal Reserve Banks Account for Almost Half of Asset Growth
Effects of Last Year’s Rate Increase Are Evident in First Quarter Results
The increase in medium- and long-term interest rates that occurred in second quarter 2013 continued to affect
year-over-year earnings comparisons. Lower noninterest income, reflecting diminished mortgage revenue,
declining trading income, and a one-time gain that inflated year-ago results, was the principal cause of the $3.1
billion (7.6 percent) year-over-year decline in industry earnings. This is only the second time in the last 19
quarters that the industry has reported a year-over-year decline in quarterly earnings. Both declines have
occurred in the last three quarters. Last year’s rise in interest rates resulted in a drying-up of demand for
mortgage refinancings. Without this demand, mortgage originations have fallen sharply, and mortgage revenue
has declined by almost one-half. The increase in interest rates also resulted in a steeper yield curve that has
been beneficial for the net interest margins of banks that invest in longer-term assets and fund the investments
with short-term liabilities. For the industry in aggregate, the declines in mortgage revenue and realized gains on
securities caused by higher interest rates outweighed the gains in net interest income that stemmed from a
steeper yield curve. For a majority of banks, however, the opposite was true. Even as total industry net income
fell, more than half of all banks—54 percent—reported increased earnings compared with the year-ago period.
The average return on assets for the quarter was 1.01 percent, down from 1.12 percent in first quarter 2013.
Lower Noninterest Income Outweighs Growth in Net Interest Income
Net operating revenue—the sum of net interest income and total noninterest income—totaled $163.7 billion in
the first quarter. This was $6.7 billion (4 percent) lower than the first-quarter 2013 total. Net interest income was
$361 million (0.3 percent) higher than the year before, but noninterest income was down by $7.1 billion (10.7
percent). More than two-thirds of all banks reported year-over-year increases in net interest income, but only
seven of the 20 largest banks reported increases. The average net interest margin fell to 3.17 percent, from 3.27
percent in first quarter 2013, although 54 percent of banks reported higher margins compared with first quarter
2013. Larger institutions are less invested in longer-maturity, higher-yield assets, and a sizable share of their
recent asset growth has consisted of low-yield, high-liquidity balances at Federal Reserve banks. They
experienced the greatest margin erosion.
Reduced Income From Mortgage Lending Contributes to Revenue Decline
The year-over-year decline in noninterest income was led by a $4 billion (53.6 percent) drop in income from
mortgage sales, securitization, and servicing. Trading revenue was $1.4 billion (18.3 percent) lower than the
comparable period in 2013. In addition, first quarter 2013 noninterest income received a $2.5 billion boost from a
litigation settlement, while there was no similar boost to first quarter 2014 income. A majority of banks, 55.6
percent, reported lower noninterest income than in first quarter 2013. Noninterest expense was essentially
unchanged from 2013 (down $18 million, or 0.02 percent). Payroll expenses were $579 million (1.2 percent)
lower, as the number of full-time equivalent employees was 43,890 fewer than a year ago. First-quarter
expenses were elevated by a $959 million litigation expense.
Gains From Lower Provisioning Are Diminishing
The largest positive contribution to the year-over-year change in earnings came from reduced loan-loss
provisions. The $7.6 billion that banks set aside for their loan-loss reserves was $3.3 billion (30.3 percent) lower
Quarterly Banking Profile
First Quarter 2014
All FDIC-Insured Institutions
and it is the second-smallest decline during this period. Forty-two percent of all banks reduced their loss
provisions.
Charge-Offs Fall to Pre-Crisis Level
Loan losses continued to decline. Net charge-offs (NCOs) fell year over year for a 15
thconsecutive quarter, to
$10.4 billion, $5.5 billion (34.8 percent) less than in first quarter 2013. This is the lowest quarterly NCO total
since second quarter 2007. Charge-offs were lower across all major loan categories, with the largest declines
occurring in residential mortgage loans (down $2 billion, 63.1 percent), home equity lines (down $1 billion, 53.3
percent), real estate loans secured by nonfarm nonresidential properties (down $734 million, 71.9 percent), and
credit cards (down $709 million, 11.4 percent). The annualized NCO rate fell to 0.52 percent from 0.83 percent
in first quarter 2013.
Noncurrent Balances Fall Below $200 Billion
The amount of loan and lease balances that were noncurrent (90 days or more past due or in nonaccrual status)
declined for a 16
thquarter in a row, as noncurrent levels improved in all major loan categories. Noncurrent
balances totaled $195.1 billion at the end of the first quarter, down $12.1 billion (5.8 percent) from the total at
year-end 2013. This is the first time since the end of third quarter 2008 that noncurrent balances have been
below $200 billion. The improvement was led by residential mortgage loans, where noncurrent balances fell by
$8.7 billion (6.5 percent), real estate loans secured by nonfarm nonresidential properties (down $1.2 billion, 5.7
percent) and real estate construction and development loans (down $1.1 billion, 12.7 percent).
Reserve Coverage Improves for Sixth Consecutive Quarter
Banks continued to release reserves in the first quarter, adding $7.6 billion in loss provisions while net
charge-offs subtracted $10.4 billion. Total loan-loss reserves declined from $135.9 billion at year-end 2013 to $132.3
billion. This is the 16
thconsecutive quarter that reserve balances have fallen; reserves are now at a six-year low.
The industry’s coverage ratio of reserves to noncurrent loans increased from 65.6 percent to 67.8 percent during
the quarter, however, owing to the decline in noncurrent loan balances. The coverage ratio has increased in
each of the last six quarters. A year ago, the ratio was 59.5 percent.
Capital Measures Exhibit Strength
Equity capital increased by $29.8 billion (1.8 percent) in the quarter. Retained earnings contributed $17.3 billion,
down from $25.9 billion in the same period of 2013, as declared dividends were up by $5.5 billion (38.3 percent).
Higher market values for available-for-sale securities added $6.7 billion to equity during the quarter. Both the
core capital (leverage) ratio and the Tier 1 risk-based capital ratio (as defined for Prompt Corrective Action
purposes) rose to record levels for the industry. At the end of the first quarter, 98.2 percent of all insured
institutions, representing 99.8 percent of industry assets, met or exceeded the requirements of the highest
regulatory capital category.
Pace of Loan Growth Picks Up
Total assets increased by $178.3 billion (1.2 percent) in the first three months of 2014. Balances with Federal
Reserve banks rose by $82.5 billion (7.1 percent), accounting for 46 percent of total asset growth. Investment
securities portfolios rose by $52.7 billion (1.8 percent), as banks increased their holdings of U.S. Treasury
securities by $44.6 billion (23.1 percent). Total loans and leases increased by $37.8 billion (0.5 percent) during
the quarter. Credit card balances and agricultural production loans posted seasonal declines of $33 billion (4.8
percent) and $5.7 billion (8 percent), respectively. Home equity lines of credit declined for a 20
thconsecutive
quarter, falling by $7.2 billion (1.4 percent). Residential mortgage balances declined by $6.3 billion (0.3 percent),
as banks reduced their inventories of mortgages held for sale. All other major loan categories increased during
the quarter. Loans to commercial and industrial borrowers increased by $15.3 billion (1.0 percent), while real
estate loans secured by multifamily residential properties rose by $9 billion (3.4 percent), real estate loans
secured by nonfarm nonresidential properties increased by $8.1 billion (0.7 percent), and auto loans rose by
$6.2 billion (1.8 percent). Assets in trading accounts declined by $18.6 billion (3.1 percent).
Retail Deposits Lead Growth in Funding
Deposit balances were up by $125.8 billion (1.1 percent) in the quarter, as deposits in foreign offices fell by $5.4
billion (0.4 percent) and domestic office deposits increased by $131.1 billion (1.3 percent). Much of the increase
Quarterly Banking Profile
First Quarter 2014
All FDIC-Insured Institutions
in domestic deposits consisted of balances in smaller-denomination accounts. Deposits in accounts of less than
$250,000 rose by $85.9 billion (1.7 percent). Nondeposit liabilities increased by $25.4 billion (1.4 percent), as
unsecured borrowings increased by $28.1 billion (13.9 percent), and securities sold under repo agreements rose
by $22 billion (7.2 percent). Liabilities in trading accounts declined by $22 billion (9.1 percent).
Problem List Falls to Less Than Half of Recent Peak
The number of insured commercial banks and savings institutions reporting financial results declined to 6,730 in
the first quarter, down from 6,812 reporters at the end of fourth quarter 2013. No new reporters were added in
the first quarter. Mergers absorbed 74 institutions during the quarter, and five insured institutions failed. The
number of institutions on the FDIC’s “Problem List” declined from 467 to 411 during the quarter. Assets of
“problem” banks fell from $152.7 billion to $126.1 billion. The number of full-time equivalent employees declined
to 2,058,927, from 2,102,817 in first quarter 2013. This is the fourth consecutive quarter that the number of
employees has declined year over year.
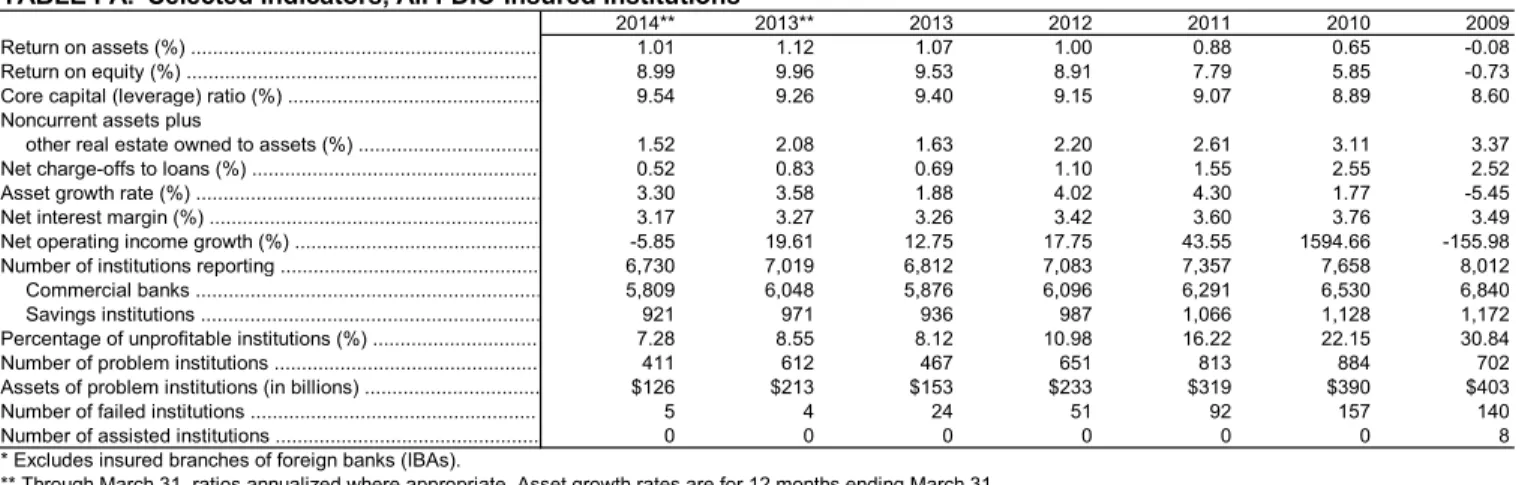
2014** 2013** 2013 2012 2011 2010 2009 Return on assets (%) ... 1.01 1.12 1.07 1.00 0.88 0.65 -0.08 Return on equity (%) ... 8.99 9.96 9.53 8.91 7.79 5.85 -0.73 Core capital (leverage) ratio (%) ... 9.54 9.26 9.40 9.15 9.07 8.89 8.60 Noncurrent assets plus
other real estate owned to assets (%) ... 1.52 2.08 1.63 2.20 2.61 3.11 3.37 Net charge-offs to loans (%) ... 0.52 0.83 0.69 1.10 1.55 2.55 2.52 Asset growth rate (%) ... 3.30 3.58 1.88 4.02 4.30 1.77 -5.45 Net interest margin (%) ... 3.17 3.27 3.26 3.42 3.60 3.76 3.49 Net operating income growth (%) ... -5.85 19.61 12.75 17.75 43.55 1594.66 -155.98 Number of institutions reporting ... 6,730 7,019 6,812 7,083 7,357 7,658 8,012 Commercial banks ... 5,809 6,048 5,876 6,096 6,291 6,530 6,840 Savings institutions ... 921 971 936 987 1,066 1,128 1,172 Percentage of unprofitable institutions (%) ... 7.28 8.55 8.12 10.98 16.22 22.15 30.84 Number of problem institutions ... 411 612 467 651 813 884 702 Assets of problem institutions (in billions) ... $126 $213 $153 $233 $319 $390 $403 Number of failed institutions ... 5 4 24 51 92 157 140 Number of assisted institutions ... 0 0 0 0 0 0 8 * Excludes insured branches of foreign banks (IBAs).
** Through March 31, ratios annualized where appropriate. Asset growth rates are for 12 months ending March 31.
TABLE I-A. Selected Indicators, All FDIC-Insured Institutions*
(dollar figures in millions)
Number of institutions reporting ... 6,730 6,812 7,019 -4.1 Total employees (full-time equivalent) ... 2,058,927 2,068,754 2,102,817 -2.1 CONDITION DATA
Total assets ... $14,901,002 $14,722,664 $14,424,434 3.3 Loans secured by real estate ... 4,075,508 4,065,663 4,059,427 0.4 1-4 Family residential mortgages ... 1,822,313 1,828,625 1,877,838 -3.0 Nonfarm nonresidential ... 1,117,684 1,109,585 1,072,938 4.2 Construction and development ... 214,319 209,935 201,534 6.3 Home equity lines ... 503,539 510,756 538,912 -6.6 Commercial & industrial loans ... 1,614,329 1,599,063 1,519,577 6.2 Loans to individuals ... 1,326,961 1,353,508 1,288,060 3.0 Credit cards ... 658,387 691,397 660,224 -0.3 Farm loans ... 64,972 70,642 59,810 8.6 Other loans & leases ... 851,019 806,149 733,951 16.0 Less: Unearned income ... 1,902 1,896 1,926 -1.3 Total loans & leases ... 7,930,910 7,893,129 7,658,899 3.6 Less: Reserve for losses ... 132,323 135,927 155,488 -14.9 Net loans and leases ... 7,798,587 7,757,202 7,503,411 3.9 Securities ... 3,054,501 3,001,760 2,998,531 1.9 Other real estate owned ... 29,367 30,209 35,892 -18.2 Goodwill and other intangibles ... 365,486 368,316 367,041 -0.4 All other assets ... 3,653,062 3,565,177 3,519,559 3.8 Total liabilities and capital ... 14,901,002 14,722,664 14,424,434 3.3 Deposits ... 11,317,837 11,192,053 10,819,197 4.6 Domestic office deposits ... 9,922,088 9,790,951 9,426,565 5.3 Foreign office deposits ... 1,395,749 1,401,102 1,392,632 0.2 Other borrowed funds ... 1,343,002 1,307,630 1,300,306 3.3 Subordinated debt ... 95,451 99,618 116,075 -17.8 All other liabilities ... 463,007 468,773 547,377 -15.4 Total equity capital (includes minority interests) ... 1,681,705 1,654,590 1,641,479 2.5 Bank equity capital ... 1,672,967 1,643,211 1,626,316 2.9 Loans and leases 30-89 days past due ... 69,570 75,883 80,037 -13.1 Noncurrent loans and leases ... 195,054 207,136 261,170 -25.3 Restructured loans and leases ... 97,167 99,419 105,772 -8.1 Mortgage-backed securities ... 1,690,537 1,673,883 1,698,409 -0.5 Earning assets ... 13,269,584 13,067,384 12,753,050 4.1 FHLB Advances ... 391,990 406,163 330,183 18.7 Unused loan commitments ... 6,214,801 6,098,254 5,908,378 5.2 Trust assets ... 20,193,283 19,691,995 18,271,244 10.5 Assets securitized and sold ... 722,091 742,448 809,168 -10.8 Notional amount of derivatives ... 233,457,475 238,755,603 232,583,465 0.4
TABLE II-A. Aggregate Condition and Income Data, All FDIC-Insured Institutions
1st Quarter
2014 4th Quarter2013 1st Quarter2013 13Q1-14Q1%Change
INCOME DATA
Total interest income ... $470,760 $486,730 -3.3 $116,125 $118,110 -1.7 Total interest expense ... 53,610 65,902 -18.7 11,937 14,284 -16.4 Net interest income ... 417,150 420,828 -0.9 104,187 103,826 0.4 Provision for loan and lease losses ... 32,426 57,807 -43.9 7,601 10,911 -30.3 Total noninterest income ... 251,844 248,629 1.3 59,513 66,621 -10.7 Total noninterest expense ... 416,751 421,221 -1.1 102,266 102,283 0.0 Securities gains (losses) ... 4,474 9,680 -53.8 827 2,071 -60.1 Applicable income taxes ... 69,530 58,303 19.3 17,304 18,758 -7.8 Extraordinary gains, net ... 243 -146 N/M 76 -59 N/M Total net income (includes minority interests) ... 155,004 141,660 9.4 37,432 40,506 -7.6 Bank net income ... 154,219 141,050 9.3 37,239 40,308 -7.6 Net charge-offs ... 53,529 82,222 -34.9 10,374 15,900 -34.8 Cash dividends ... 87,161 96,409 -9.6 19,939 14,413 38.3 Retained earnings ... 67,059 44,640 50.2 17,300 25,895 -33.2 Net operating income ... 151,632 134,484 12.8 36,765 39,051 -5.9 N/M - Not Meaningful %Change 13Q1-14Q1 Full Year
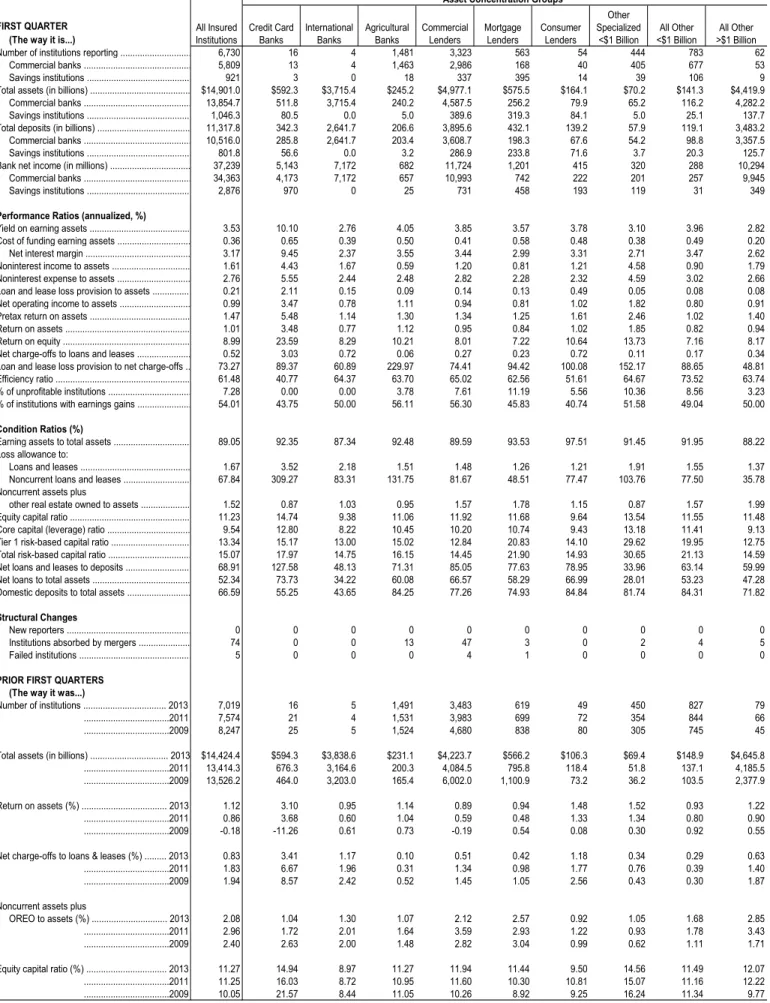
FIRST QUARTER (The way it is...)
Number of institutions reporting ... 6,730 16 4 1,481 3,323 563 54 444 783 62 Commercial banks ... 5,809 13 4 1,463 2,986 168 40 405 677 53 Savings institutions ... 921 3 0 18 337 395 14 39 106 9 Total assets (in billions) ... $14,901.0 $592.3 $3,715.4 $245.2 $4,977.1 $575.5 $164.1 $70.2 $141.3 $4,419.9 Commercial banks ... 13,854.7 511.8 3,715.4 240.2 4,587.5 256.2 79.9 65.2 116.2 4,282.2 Savings institutions ... 1,046.3 80.5 0.0 5.0 389.6 319.3 84.1 5.0 25.1 137.7 Total deposits (in billions) ... 11,317.8 342.3 2,641.7 206.6 3,895.6 432.1 139.2 57.9 119.1 3,483.2 Commercial banks ... 10,516.0 285.8 2,641.7 203.4 3,608.7 198.3 67.6 54.2 98.8 3,357.5 Savings institutions ... 801.8 56.6 0.0 3.2 286.9 233.8 71.6 3.7 20.3 125.7 Bank net income (in millions) ... 37,239 5,143 7,172 682 11,724 1,201 415 320 288 10,294 Commercial banks ... 34,363 4,173 7,172 657 10,993 742 222 201 257 9,945 Savings institutions ... 2,876 970 0 25 731 458 193 119 31 349
Performance Ratios (annualized, %)
Yield on earning assets ... 3.53 10.10 2.76 4.05 3.85 3.57 3.78 3.10 3.96 2.82 Cost of funding earning assets ... 0.36 0.65 0.39 0.50 0.41 0.58 0.48 0.38 0.49 0.20 Net interest margin ... 3.17 9.45 2.37 3.55 3.44 2.99 3.31 2.71 3.47 2.62 Noninterest income to assets ... 1.61 4.43 1.67 0.59 1.20 0.81 1.21 4.58 0.90 1.79 Noninterest expense to assets ... 2.76 5.55 2.44 2.48 2.82 2.28 2.32 4.59 3.02 2.66 Loan and lease loss provision to assets ... 0.21 2.11 0.15 0.09 0.14 0.13 0.49 0.05 0.08 0.08 Net operating income to assets ... 0.99 3.47 0.78 1.11 0.94 0.81 1.02 1.82 0.80 0.91 Pretax return on assets ... 1.47 5.48 1.14 1.30 1.34 1.25 1.61 2.46 1.02 1.40 Return on assets ... 1.01 3.48 0.77 1.12 0.95 0.84 1.02 1.85 0.82 0.94 Return on equity ... 8.99 23.59 8.29 10.21 8.01 7.22 10.64 13.73 7.16 8.17 Net charge-offs to loans and leases ... 0.52 3.03 0.72 0.06 0.27 0.23 0.72 0.11 0.17 0.34 Loan and lease loss provision to net charge-offs .. 73.27 89.37 60.89 229.97 74.41 94.42 100.08 152.17 88.65 48.81 Efficiency ratio ... 61.48 40.77 64.37 63.70 65.02 62.56 51.61 64.67 73.52 63.74 % of unprofitable institutions ... 7.28 0.00 0.00 3.78 7.61 11.19 5.56 10.36 8.56 3.23 % of institutions with earnings gains ... 54.01 43.75 50.00 56.11 56.30 45.83 40.74 51.58 49.04 50.00
Condition Ratios (%)
Earning assets to total assets ... 89.05 92.35 87.34 92.48 89.59 93.53 97.51 91.45 91.95 88.22 Loss allowance to:
Loans and leases ... 1.67 3.52 2.18 1.51 1.48 1.26 1.21 1.91 1.55 1.37 Noncurrent loans and leases ... 67.84 309.27 83.31 131.75 81.67 48.51 77.47 103.76 77.50 35.78 Noncurrent assets plus
other real estate owned to assets ... 1.52 0.87 1.03 0.95 1.57 1.78 1.15 0.87 1.57 1.99 Equity capital ratio ... 11.23 14.74 9.38 11.06 11.92 11.68 9.64 13.54 11.55 11.48 Core capital (leverage) ratio ... 9.54 12.80 8.22 10.45 10.20 10.74 9.43 13.18 11.41 9.13 Tier 1 risk-based capital ratio ... 13.34 15.17 13.00 15.02 12.84 20.83 14.10 29.62 19.95 12.75 Total risk-based capital ratio ... 15.07 17.97 14.75 16.15 14.45 21.90 14.93 30.65 21.13 14.59 Net loans and leases to deposits ... 68.91 127.58 48.13 71.31 85.05 77.63 78.95 33.96 63.14 59.99 Net loans to total assets ... 52.34 73.73 34.22 60.08 66.57 58.29 66.99 28.01 53.23 47.28 Domestic deposits to total assets ... 66.59 55.25 43.65 84.25 77.26 74.93 84.84 81.74 84.31 71.82
Structural Changes
New reporters ... 0 0 0 0 0 0 0 0 0 0 Institutions absorbed by mergers ... 74 0 0 13 47 3 0 2 4 5 Failed institutions ... 5 0 0 0 4 1 0 0 0 0
PRIOR FIRST QUARTERS (The way it was...)
Number of institutions ... 2013 7,019 16 5 1,491 3,483 619 49 450 827 79 ...2011 7,574 21 4 1,531 3,983 699 72 354 844 66 ...2009 8,247 25 5 1,524 4,680 838 80 305 745 45 Total assets (in billions) ... 2013 $14,424.4 $594.3 $3,838.6 $231.1 $4,223.7 $566.2 $106.3 $69.4 $148.9 $4,645.8 ...2011 13,414.3 676.3 3,164.6 200.3 4,084.5 795.8 118.4 51.8 137.1 4,185.5 ...2009 13,526.2 464.0 3,203.0 165.4 6,002.0 1,100.9 73.2 36.2 103.5 2,377.9 Return on assets (%) ... 2013 1.12 3.10 0.95 1.14 0.89 0.94 1.48 1.52 0.93 1.22 ...2011 0.86 3.68 0.60 1.04 0.59 0.48 1.33 1.34 0.80 0.90 ...2009 -0.18 -11.26 0.61 0.73 -0.19 0.54 0.08 0.30 0.92 0.55 Net charge-offs to loans & leases (%) ... 2013 0.83 3.41 1.17 0.10 0.51 0.42 1.18 0.34 0.29 0.63 ...2011 1.83 6.67 1.96 0.31 1.34 0.98 1.77 0.76 0.39 1.40 ...2009 1.94 8.57 2.42 0.52 1.45 1.05 2.56 0.43 0.30 1.87 Noncurrent assets plus
OREO to assets (%) ... 2013 2.08 1.04 1.30 1.07 2.12 2.57 0.92 1.05 1.68 2.85 ...2011 2.96 1.72 2.01 1.64 3.59 2.93 1.22 0.93 1.78 3.43 ...2009 2.40 2.63 2.00 1.48 2.82 3.04 0.99 0.62 1.11 1.71 Equity capital ratio (%) ... 2013 11.27 14.94 8.97 11.27 11.94 11.44 9.50 14.56 11.49 12.07 ...2011 11.25 16.03 8.72 10.95 11.60 10.30 10.81 15.07 11.16 12.22 ...2009 10.05 21.57 8.44 11.05 10.26 8.92 9.25 16.24 11.34 9.77 * See Table IV-A (page 8) for explanations.
All Other
<$1 Billion >$1 BillionAll Other TABLE III-A. First Quarter 2014, All FDIC-Insured Institutions
All Insured Institutions
Asset Concentration Groups*
Credit Card
Banks InternationalBanks AgriculturalBanks CommercialLenders MortgageLenders ConsumerLenders Other Specialized
FIRST QUARTER (The way it is...)
Number of institutions reporting ... 6,730 2,005 4,053 565 107 831 852 1,457 1,641 1,414 535 Commercial banks ... 5,809 1,770 3,496 452 91 458 767 1,209 1,571 1,319 485 Savings institutions ... 921 235 557 113 16 373 85 248 70 95 50 Total assets (in billions) ... $14,901.0 $118.1 $1,245.8 $1,494.9 $12,042.3 $2,963.4 $3,032.9 $3,417.0 $3,238.4 $883.0 $1,366.4 Commercial banks ... 13,854.7 104.6 1,051.2 1,207.5 11,491.5 2,500.0 2,947.1 3,307.6 3,177.4 777.1 1,145.4 Savings institutions ... 1,046.3 13.5 194.6 287.4 550.8 463.4 85.7 109.4 61.0 105.9 221.0 Total deposits (in billions) ... 11,317.8 100.6 1,045.5 1,174.2 8,997.6 2,213.0 2,333.5 2,479.4 2,490.7 739.0 1,062.4 Commercial banks ... 10,516.0 89.9 890.1 957.9 8,578.2 1,878.7 2,268.6 2,396.2 2,441.7 650.7 880.1 Savings institutions ... 801.8 10.7 155.5 216.2 419.4 334.3 64.8 83.2 48.9 88.3 182.3 Bank net income (in millions) ... 37,239 240 2,804 3,760 30,435 7,505 6,631 6,801 9,185 2,371 4,746 Commercial banks ... 34,363 217 2,426 3,209 28,511 6,749 6,458 6,634 9,023 2,048 3,451 Savings institutions ... 2,876 23 379 550 1,924 755 174 168 162 323 1,295
Performance Ratios (annualized, %)
Yield on earning assets ... 3.53 4.11 4.15 4.21 3.37 3.83 3.47 2.80 3.74 3.89 4.05 Cost of funding earning assets ... 0.36 0.49 0.51 0.45 0.33 0.41 0.29 0.30 0.41 0.34 0.44 Net interest margin ... 3.17 3.62 3.64 3.76 3.03 3.42 3.18 2.49 3.33 3.55 3.61 Noninterest income to assets ... 1.61 1.21 1.01 1.16 1.73 1.52 1.66 1.72 1.51 1.27 1.87 Noninterest expense to assets ... 2.76 3.47 3.12 3.03 2.68 2.73 3.03 2.64 2.60 3.02 2.75 Loan and lease loss provision to assets ... 0.21 0.09 0.12 0.17 0.22 0.35 0.17 0.14 0.16 0.10 0.31 Net operating income to assets ... 0.99 0.81 0.89 0.99 1.01 1.00 0.84 0.80 1.14 1.07 1.40 Pretax return on assets ... 1.47 0.96 1.15 1.42 1.52 1.51 1.28 1.14 1.71 1.41 2.17 Return on assets ... 1.01 0.82 0.91 1.01 1.02 1.02 0.88 0.80 1.14 1.08 1.41 Return on equity ... 8.99 6.94 8.36 8.55 9.13 8.47 7.18 8.24 10.88 9.92 11.15 Net charge-offs to loans and leases ... 0.52 0.18 0.18 0.26 0.62 0.75 0.47 0.38 0.61 0.21 0.50 Loan and lease loss provision to net charge-offs .. 73.27 87.48 100.35 99.45 70.47 87.44 63.31 80.95 48.72 76.40 102.01 Efficiency ratio ... 61.48 76.59 71.35 65.39 59.82 58.36 67.72 66.87 56.77 66.46 52.30 % of unprofitable institutions ... 7.28 12.92 5.33 2.65 0.00 7.94 11.27 8.24 5.12 5.02 9.91 % of institutions with earnings gains ... 54.01 52.47 54.48 56.46 52.34 51.26 58.69 48.73 55.51 56.36 54.39
Condition Ratios (%)
Earning assets to total assets ... 89.05 91.42 92.15 91.12 88.45 89.34 87.45 88.45 88.68 91.56 92.75 Loss Allowance to:
Loans and leases ... 1.67 1.67 1.58 1.53 1.70 1.68 1.52 1.80 1.85 1.48 1.48 Noncurrent loans and leases ... 67.84 92.50 92.54 74.41 64.77 94.10 48.26 69.62 59.46 84.47 123.46 Noncurrent assets plus
other real estate owned to assets ... 1.52 1.71 1.71 1.77 1.47 1.08 2.04 1.39 1.86 1.46 0.85 Equity capital ratio ... 11.23 11.86 10.91 11.90 11.17 12.04 12.32 9.79 10.47 10.96 12.60 Core capital (leverage) ratio ... 9.54 11.76 10.70 10.67 9.25 9.93 9.49 8.62 9.20 10.04 11.57 Tier 1 risk-based capital ratio ... 13.34 19.45 15.87 14.92 12.84 14.36 12.77 12.44 12.58 14.45 15.80 Total risk-based capital ratio ... 15.07 20.56 17.04 16.09 14.70 16.15 14.51 14.08 14.63 15.78 17.09 Net loans and leases to deposits ... 68.91 64.07 74.03 81.87 66.67 70.62 73.70 61.10 66.96 70.77 76.28 Net loans to total assets ... 52.34 54.57 62.13 64.31 49.82 52.74 56.71 44.34 51.50 59.23 59.31 Domestic deposits to total assets ... 66.59 85.18 83.87 78.14 63.18 65.93 73.69 60.78 57.89 83.30 76.57
Structural Changes
New reporters ... 0 0 0 0 0 0 0 0 0 0 0 Institutions absorbed by mergers ... 74 32 37 4 1 6 15 14 17 15 7 Failed institutions ... 5 2 3 0 0 1 1 1 0 1 1
PRIOR FIRST QUARTERS (The way it was...)
Number of institutions ... 2013 7,019 2,161 4,196 553 109 867 894 1,500 1,701 1,480 577 ...2011 7,574 2,573 4,331 563 107 942 1,010 1,581 1,811 1,580 650 ...2009 8,247 3,052 4,504 576 115 1,005 1,172 1,692 1,924 1,690 764 Total assets (in billions) ... 2013 $14,424.4 $126.0 $1,270.8 $1,423.9 $11,603.8 $2,862.6 $3,017.0 $3,345.9 $3,068.2 $870.9 $1,259.8 ...2011 13,414.3 147.1 1,284.8 1,428.4 10,554.0 2,709.1 2,913.4 3,047.9 1,680.2 788.2 2,275.5 ...2009 13,526.2 167.2 1,359.5 1,512.5 10,486.9 2,505.7 3,520.2 3,176.6 1,064.7 908.9 2,350.2 Return on assets (%) ... 2013 1.12 0.72 0.87 1.10 1.15 0.86 1.11 1.09 1.25 1.09 1.47 ...2011 0.86 0.57 0.52 0.69 0.93 1.04 0.60 0.68 1.19 0.92 0.96 ...2009 -0.18 0.25 0.27 -0.24 -0.23 -1.82 0.20 0.12 0.56 -0.37 0.37 Net charge-offs to loans & leases (%) ... 2013 0.83 0.26 0.33 0.43 0.96 1.10 0.83 0.55 1.05 0.37 0.65 ...2011 1.83 0.43 0.77 1.37 2.09 2.29 1.82 1.43 2.02 0.83 1.98 ...2009 1.94 0.57 0.76 1.43 2.26 2.23 1.76 1.63 2.15 0.91 2.67 Noncurrent assets plus
OREO to assets (%) ... 2013 2.08 2.04 2.30 2.17 2.04 1.41 3.03 1.87 2.34 2.01 1.28 ...2011 2.96 2.39 3.39 3.47 2.84 2.05 3.97 2.75 4.05 3.02 2.18 ...2009 2.40 1.87 2.53 2.98 2.31 1.53 2.56 2.43 2.72 2.60 2.81 Equity capital ratio (%) ... 2013 11.27 11.97 11.00 11.84 11.23 12.26 12.22 9.12 11.03 10.82 13.41 ...2011 11.25 11.57 10.28 11.43 11.34 12.74 11.84 8.52 11.58 10.73 12.33 ...2009 10.05 12.66 9.96 10.56 9.95 11.71 10.19 8.37 9.90 9.87 10.49 * See Table IV-A (page 9) for explanations.
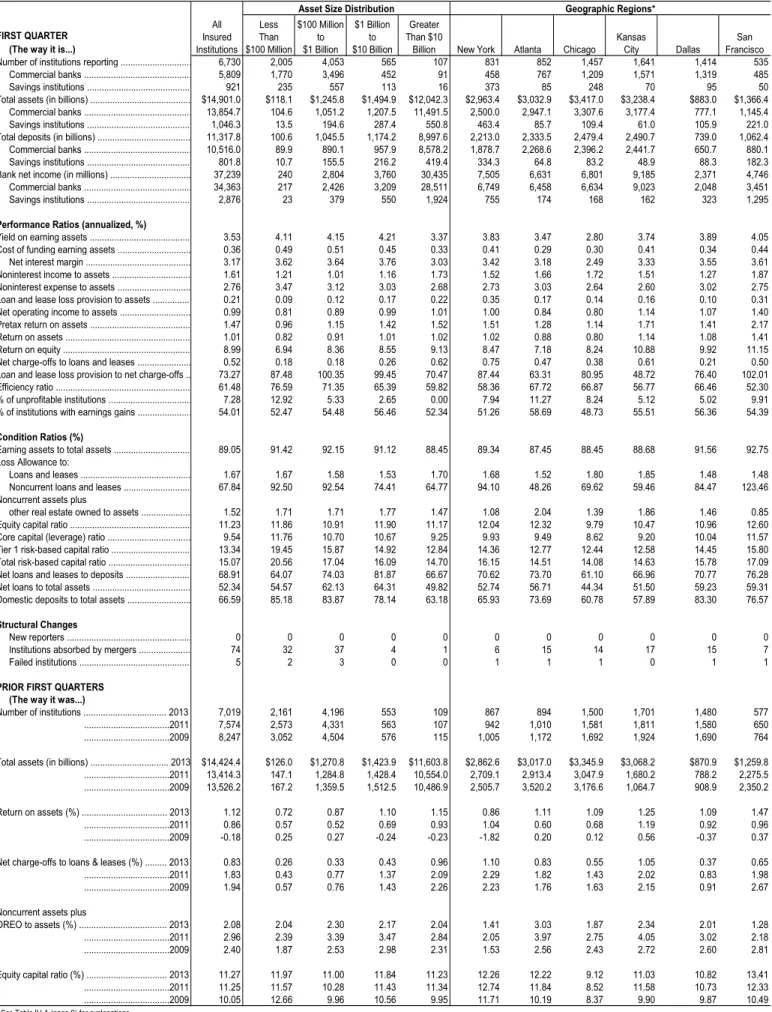
Chicago KansasCity Dallas FranciscoSan TABLE III-A. First Quarter 2014, All FDIC-Insured Institutions
Asset Size Distribution Geographic Regions*
All Insured Institutions
Less Than $100 Million
$100 Million to $1 Billion
$1 Billion to $10 Billion
Greater Than $10
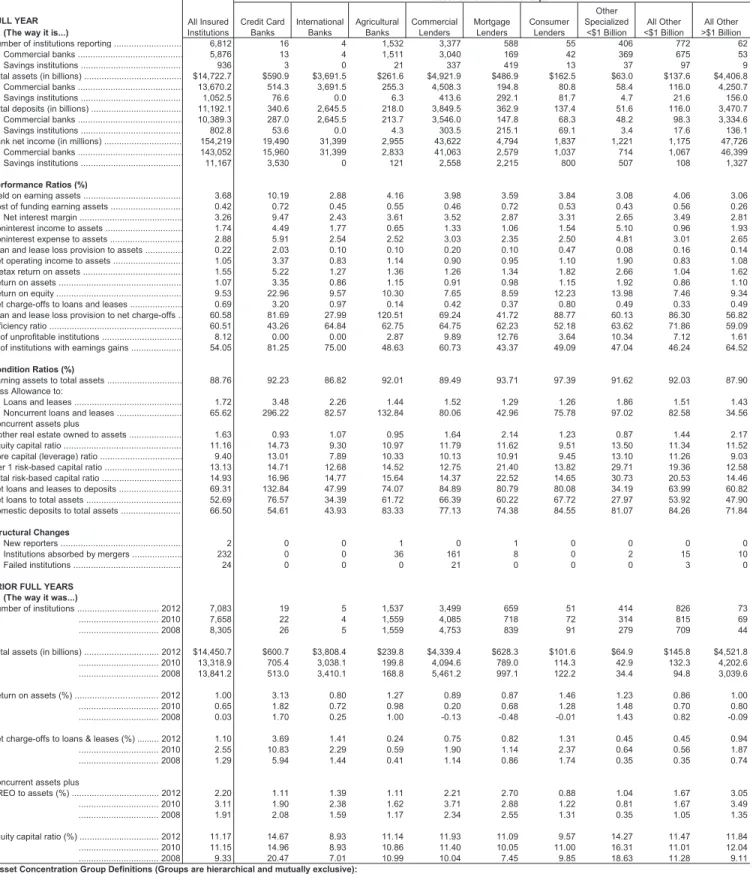
FULL YEAR (The way it is...)
Number of institutions reporting ... 6,812 16 4 1,532 3,377 588 55 406 772 62 Commercial banks ... 5,876 13 4 1,511 3,040 169 42 369 675 53 Savings institutions ... 936 3 0 21 337 419 13 37 97 9 Total assets (in billions) ... $14,722.7 $590.9 $3,691.5 $261.6 $4,921.9 $486.9 $162.5 $63.0 $137.6 $4,406.8 Commercial banks ... 13,670.2 514.3 3,691.5 255.3 4,508.3 194.8 80.8 58.4 116.0 4,250.7 Savings institutions ... 1,052.5 76.6 0.0 6.3 413.6 292.1 81.7 4.7 21.6 156.0 Total deposits (in billions) ... 11,192.1 340.6 2,645.5 218.0 3,849.5 362.9 137.4 51.6 116.0 3,470.7 Commercial banks ... 10,389.3 287.0 2,645.5 213.7 3,546.0 147.8 68.3 48.2 98.3 3,334.6 Savings institutions ... 802.8 53.6 0.0 4.3 303.5 215.1 69.1 3.4 17.6 136.1 Bank net income (in millions) ... 154,219 19,490 31,399 2,955 43,622 4,794 1,837 1,221 1,175 47,726 Commercial banks ... 143,052 15,960 31,399 2,833 41,063 2,579 1,037 714 1,067 46,399 Savings institutions ... 11,167 3,530 0 121 2,558 2,215 800 507 108 1,327 Performance Ratios (%)
Yield on earning assets ... 3.68 10.19 2.88 4.16 3.98 3.59 3.84 3.08 4.06 3.06 Cost of funding earning assets ... 0.42 0.72 0.45 0.55 0.46 0.72 0.53 0.43 0.56 0.26 Net interest margin ... 3.26 9.47 2.43 3.61 3.52 2.87 3.31 2.65 3.49 2.81 Noninterest income to assets ... 1.74 4.49 1.77 0.65 1.33 1.06 1.54 5.10 0.96 1.93 Noninterest expense to assets ... 2.88 5.91 2.54 2.52 3.03 2.35 2.50 4.81 3.01 2.65 Loan and lease loss provision to assets ... 0.22 2.03 0.10 0.10 0.20 0.10 0.47 0.08 0.16 0.14 Net operating income to assets ... 1.05 3.37 0.83 1.14 0.90 0.95 1.10 1.90 0.83 1.08 Pretax return on assets ... 1.55 5.22 1.27 1.36 1.26 1.34 1.82 2.66 1.04 1.62 Return on assets ... 1.07 3.35 0.86 1.15 0.91 0.98 1.15 1.92 0.86 1.10 Return on equity ... 9.53 22.96 9.57 10.30 7.65 8.59 12.23 13.98 7.46 9.34 Net charge-offs to loans and leases ... 0.69 3.20 0.97 0.14 0.42 0.37 0.80 0.49 0.33 0.49 Loan and lease loss provision to net charge-offs .. 60.58 81.69 27.99 120.51 69.24 41.72 88.77 60.13 86.30 56.82 Efficiency ratio ... 60.51 43.26 64.84 62.75 64.75 62.23 52.18 63.62 71.86 59.09 % of unprofitable institutions ... 8.12 0.00 0.00 2.87 9.89 12.76 3.64 10.34 7.12 1.61 % of institutions with earnings gains ... 54.05 81.25 75.00 48.63 60.73 43.37 49.09 47.04 46.24 64.52 Condition Ratios (%)
Earning assets to total assets ... 88.76 92.23 86.82 92.01 89.49 93.71 97.39 91.62 92.03 87.90 Loss Allowance to:
Loans and leases ... 1.72 3.48 2.26 1.44 1.52 1.29 1.26 1.86 1.51 1.43 Noncurrent loans and leases ... 65.62 296.22 82.57 132.84 80.06 42.96 75.78 97.02 82.58 34.56 Noncurrent assets plus
other real estate owned to assets ... 1.63 0.93 1.07 0.95 1.64 2.14 1.23 0.87 1.44 2.17 Equity capital ratio ... 11.16 14.73 9.30 10.97 11.79 11.62 9.51 13.50 11.34 11.52 Core capital (leverage) ratio ... 9.40 13.01 7.89 10.33 10.13 10.91 9.45 13.10 11.26 9.03 Tier 1 risk-based capital ratio ... 13.13 14.71 12.68 14.52 12.75 21.40 13.82 29.71 19.36 12.58 Total risk-based capital ratio ... 14.93 16.96 14.77 15.64 14.37 22.52 14.65 30.73 20.53 14.46 Net loans and leases to deposits ... 69.31 132.84 47.99 74.07 84.89 80.79 80.08 34.19 63.99 60.82 Net loans to total assets ... 52.69 76.57 34.39 61.72 66.39 60.22 67.72 27.97 53.92 47.90 Domestic deposits to total assets ... 66.50 54.61 43.93 83.33 77.13 74.38 84.55 81.07 84.26 71.84 Structural Changes
New reporters ... 2 0 0 1 0 1 0 0 0 0
Institutions absorbed by mergers ... 232 0 0 36 161 8 0 2 15 10
Failed institutions ... 24 0 0 0 21 0 0 0 3 0 PRIOR FULL YEARS
(The way it was...)
Number of institutions ... 2012 7,083 19 5 1,537 3,499 659 51 414 826 73 ... 2010 7,658 22 4 1,559 4,085 718 72 314 815 69 ... 2008 8,305 26 5 1,559 4,753 839 91 279 709 44 Total assets (in billions) ... 2012 $14,450.7 $600.7 $3,808.4 $239.8 $4,339.4 $628.3 $101.6 $64.9 $145.8 $4,521.8 ... 2010 13,318.9 705.4 3,038.1 199.8 4,094.6 789.0 114.3 42.9 132.3 4,202.6 ... 2008 13,841.2 513.0 3,410.1 168.8 5,461.2 997.1 122.2 34.4 94.8 3,039.6 Return on assets (%) ... 2012 1.00 3.13 0.80 1.27 0.89 0.87 1.46 1.23 0.86 1.00 ... 2010 0.65 1.82 0.72 0.98 0.20 0.68 1.28 1.48 0.70 0.80 ... 2008 0.03 1.70 0.25 1.00 -0.13 -0.48 -0.01 1.43 0.82 -0.09 Net charge-offs to loans & leases (%) ... 2012 1.10 3.69 1.41 0.24 0.75 0.82 1.31 0.45 0.45 0.94 ... 2010 2.55 10.83 2.29 0.59 1.90 1.14 2.37 0.64 0.56 1.87 ... 2008 1.29 5.94 1.44 0.41 1.14 0.86 1.74 0.35 0.35 0.74 Noncurrent assets plus
OREO to assets (%) ... 2012 2.20 1.11 1.39 1.11 2.21 2.70 0.88 1.04 1.67 3.05 ... 2010 3.11 1.90 2.38 1.62 3.71 2.88 1.22 0.81 1.67 3.49 ... 2008 1.91 2.08 1.59 1.17 2.34 2.55 1.31 0.35 1.05 1.35 Equity capital ratio (%) ... 2012 11.17 14.67 8.93 11.14 11.93 11.09 9.57 14.27 11.47 11.84 ... 2010 11.15 14.96 8.93 10.86 11.40 10.05 11.00 16.31 11.01 12.04 ... 2008 9.33 20.47 7.01 10.99 10.04 7.45 9.85 18.63 11.28 9.11 *Asset Concentration Group Definitions (Groups are hierarchical and mutually exclusive):
Commercial Lenders - Institutions whose commercial and industrial loans, plus real estate construction and development loans, plus loans TABLE IV-A. Full Year 2013, All FDIC-Insured Institutions
Asset Concentration Groups* All Insured
Institutions Credit CardBanks InternationalBanks AgriculturalBanks CommercialLenders MortgageLenders ConsumerLenders Other Specialized
<$1 Billion <$1 BillionAll Other >$1 BillionAll Other
Credit-card Lenders - Institutions whose credit-card loans plus securitized receivables exceed 50 percent of total assets plus securitized receivables. International Banks - Banks with assets greater than $10 billion and more than 25 percent of total assets in foreign offices.
Agricultural Banks - Banks whose agricultural production loans plus real estate loans secured by farmland exceed 25 percent of the total loans and leases.
All Other > $1 billion - Institutions with assets greater than $1 billion that do not meet any of the definitions above, they have significant lending activity with no identified asset concentrations.
secured by commercial real estate properties exceed 25 percent of total assets.
Mortgage Lenders - Institutions whose residential mortgage loans, plus mortgage-backed securities, exceed 50 percent of total assets.
Consumer Lenders - Institutions whose residential mortgage loans, plus credit-card loans, plus other loans to individuals, exceed 50 percent of total assets. Other Specialized < $1 Billion - Institutions with assets less than $1 billion, whose loans and leases are less than 40 percent of total assets.
All Other < $1 billion - Institutions with assets less than $1 billion that do not meet any of the definitions above, they have significant lending activity with no identified asset concentrations.
FULL YEAR (The way it is...)
Number of institutions reporting ... 6,812 2,056 4,090 559 107 840 869 1,470 1,659 1,431 543
Commercial banks ... 5,876 1,814 3,522 450 90 461 784 1,219 1,586 1,334 492
Savings institutions ... 936 242 568 109 17 379 85 251 73 97 51
Total assets (in billions) ... $14,722.7 $119.7 $1,246.1 $1,468.7 $11,888.2 $2,927.4 $2,998.8 $3,377.7 $3,214.1 $870.0 $1,334.6 Commercial banks ... 13,670.2 106.0 1,046.4 1,188.3 11,329.5 2,470.6 2,913.6 3,267.1 3,153.8 766.9 1,098.2 Savings institutions ... 1,052.5 13.7 199.7 280.4 558.6 456.8 85.3 110.6 60.3 103.1 236.4 Total deposits (in billions) ... 11,192.1 101.7 1,042.7 1,147.6 8,900.0 2,179.6 2,308.7 2,464.2 2,482.0 726.2 1,031.3 Commercial banks ... 10,389.3 90.8 883.1 937.5 8,477.9 1,849.5 2,244.5 2,379.8 2,433.6 641.1 840.9 Savings institutions ... 802.8 10.9 159.6 210.1 422.1 330.1 64.3 84.4 48.5 85.1 190.4 Bank net income (in millions) ... 154,219 853 11,218 16,792 125,356 25,112 29,637 31,923 38,681 9,299 19,567 Commercial banks ... 143,052 797 9,511 14,116 118,629 22,705 29,061 30,544 38,183 7,969 14,590
Savings institutions ... 11,167 56 1,707 2,676 6,727 2,407 576 1,378 499 1,330 4,977
Performance Ratios (%)
Yield on earning assets ... 3.68 4.17 4.23 4.33 3.53 3.97 3.66 2.91 3.95 3.97 4.22
Cost of funding earning assets ... 0.42 0.56 0.58 0.52 0.39 0.46 0.36 0.36 0.48 0.39 0.50
Net interest margin ... 3.26 3.62 3.66 3.81 3.14 3.51 3.30 2.54 3.47 3.57 3.72
Noninterest income to assets ... 1.74 1.11 1.13 1.31 1.86 1.58 1.77 1.92 1.62 1.42 2.05
Noninterest expense to assets ... 2.88 3.47 3.19 3.15 2.81 2.98 3.02 2.77 2.68 3.12 2.91
Loan and lease loss provision to assets ... 0.22 0.14 0.18 0.19 0.23 0.38 0.20 0.06 0.25 0.14 0.35
Net operating income to assets ... 1.05 0.69 0.89 1.15 1.05 0.86 0.96 0.93 1.23 1.09 1.50
Pretax return on assets ... 1.55 0.81 1.15 1.46 1.60 1.37 1.45 1.34 1.76 1.42 2.28
Return on assets ... 1.07 0.71 0.91 1.17 1.07 0.88 0.98 0.95 1.24 1.08 1.53
Return on equity ... 9.53 5.99 8.40 9.82 9.65 7.23 8.07 10.32 11.54 10.03 11.75
Net charge-offs to loans and leases ... 0.69 0.34 0.36 0.40 0.78 0.93 0.66 0.48 0.87 0.32 0.57
Loan and lease loss provision to net charge-offs .. 60.58 75.78 79.98 72.34 58.39 76.30 53.52 27.62 53.57 72.90 101.04
Efficiency ratio ... 60.51 78.56 70.73 64.81 58.75 58.65 64.07 66.15 55.78 66.19 52.48
% of unprofitable institutions ... 8.12 13.08 6.53 2.50 2.80 10.71 14.15 9.18 4.40 5.31 10.31
% of institutions with earnings gains ... 54.05 48.49 55.53 62.08 62.62 50.12 62.26 50.88 51.66 54.58 61.51
Condition Ratios (%)
Earning assets to total assets ... 88.76 91.40 92.10 91.13 88.09 89.25 87.09 87.72 88.60 91.44 92.68 Loss Allowance to:
Loans and leases ... 1.72 1.67 1.60 1.56 1.76 1.71 1.59 1.83 1.94 1.51 1.52
Noncurrent loans and leases ... 65.62 91.21 88.44 70.93 62.85 92.92 46.87 67.31 57.88 79.99 117.79
Noncurrent assets plus
other real estate owned to assets ... 1.63 1.75 1.81 1.89 1.57 1.12 2.23 1.47 1.99 1.58 0.92
Equity capital ratio ... 11.16 11.69 10.78 11.80 11.12 12.02 12.19 9.66 10.46 10.87 12.64
Core capital (leverage) ratio ... 9.40 11.59 10.63 10.61 9.10 9.83 9.48 8.36 8.97 9.97 11.62
Tier 1 risk-based capital ratio ... 13.13 19.06 15.73 14.88 12.60 14.07 12.67 12.25 12.20 14.36 15.79 Total risk-based capital ratio ... 14.93 20.16 16.90 16.07 14.54 15.74 14.41 14.20 14.35 15.67 17.10
Net loans and leases to deposits ... 69.31 65.66 74.89 82.42 67.01 71.14 74.55 61.24 67.00 71.50 77.02
Net loans to total assets ... 52.69 55.78 62.67 64.40 50.16 52.97 57.39 44.68 51.74 59.68 59.52
Domestic deposits to total assets ... 66.50 84.95 83.62 77.74 63.13 65.70 73.62 61.09 57.80 83.09 76.13
Structural Changes
New reporters ... 2 1 0 1 0 2 0 0 0 0 0
Institutions absorbed by mergers ... 232 80 130 20 2 29 20 42 50 56 35
Failed institutions ... 24 13 10 1 0 1 9 4 1 4 5
PRIOR FULL YEARS (The way it was...)
Number of institutions ... 2012 7,083 2,204 4,217 555 107 873 904 1,515 1,716 1,490 585
... 2010 7,658 2,625 4,367 559 107 949 1,022 1,602 1,825 1,601 659
... 2008 8,305 3,132 4,498 561 114 1,015 1,180 1,705 1,935 1,700 770
Total assets (in billions) ... 2012 $14,450.7 $128.1 $1,275.0 $1,454.8 $11,592.7 $2,896.0 $3,056.1 $3,298.5 $3,068.7 $870.4 $1,260.9 ... 2010 13,318.9 148.6 1,291.7 1,429.6 10,449.0 2,694.8 2,929.8 2,950.1 1,686.5 789.0 2,268.7 ... 2008 13,841.2 170.9 1,354.7 1,489.8 10,825.8 2,594.2 3,745.9 3,264.3 1,057.2 780.9 2,398.7
Return on assets (%) ... 2012 1.00 0.68 0.80 1.13 1.01 0.96 0.77 0.90 1.10 1.01 1.72
... 2010 0.65 0.27 0.26 0.19 0.76 0.76 0.34 0.60 0.84 0.68 0.81
... 2008 0.03 0.25 0.24 -0.30 0.05 0.25 -0.14 0.29 0.56 0.51 -0.63
Net charge-offs to loans & leases (%) ... 2012 1.10 0.43 0.64 0.73 1.22 1.24 1.19 0.85 1.37 0.55 0.84
... 2010 2.55 0.80 1.12 1.80 2.93 3.57 2.43 2.03 2.88 1.27 2.29
... 2008 1.29 0.46 0.67 1.10 1.45 1.44 1.01 1.24 1.60 0.68 1.74
Noncurrent assets plus
OREO to assets (%) ... 2012 2.20 2.10 2.37 2.46 2.15 1.46 3.23 2.00 2.45 2.06 1.38
... 2010 3.11 2.38 3.44 3.57 3.01 2.14 3.93 2.98 4.24 3.17 2.51
... 2008 1.91 1.66 2.16 2.46 1.80 1.20 2.02 1.93 2.28 1.80 2.33
Equity capital ratio (%) ... 2012 11.17 12.00 10.90 11.77 11.11 12.18 12.03 9.09 10.86 10.70 13.23
... 2010 11.15 11.70 10.15 11.18 11.26 12.58 11.59 8.71 11.33 10.54 12.11
... 2008 9.33 12.87 10.00 10.65 9.01 11.14 9.56 8.07 9.49 9.95 8.45
San Francisco - Alaska, Arizona, California, Hawaii, Idaho, Montana, Nevada, Oregon, Pacific Islands, Utah, Washington, Wyoming
Chicago KansasCity Dallas FranciscoSan
* Regions:
New York - Connecticut, Delaware, District of Columbia, Maine, Maryland, Massachusetts, New Hampshire, New Jersey, New York, Pennsylvania, Puerto Rico Rhode Island, Vermont, U.S. Virgin Islands
Atlanta - Alabama, Florida, Georgia, North Carolina, South Carolina, Virginia, West Virginia Chicago - Illinois, Indiana, Kentucky, Michigan, Ohio, Wisconsin
Kansas City - Iowa, Kansas, Minnesota, Missouri, Nebraska, North Dakota, South Dakota Dallas - Arkansas, Colorado, Louisiana, Mississippi, New Mexico, Oklahoma, Tennessee, Texas
TABLE IV-A. Full Year 2013, All FDIC-Insured Institutions
Asset Size Distribution Geographic Regions*
All Insured Institutions
Less Than $100
Million
$100 Million to $1 Billion
$1 Billion to $10 Billion
Greater Than $10
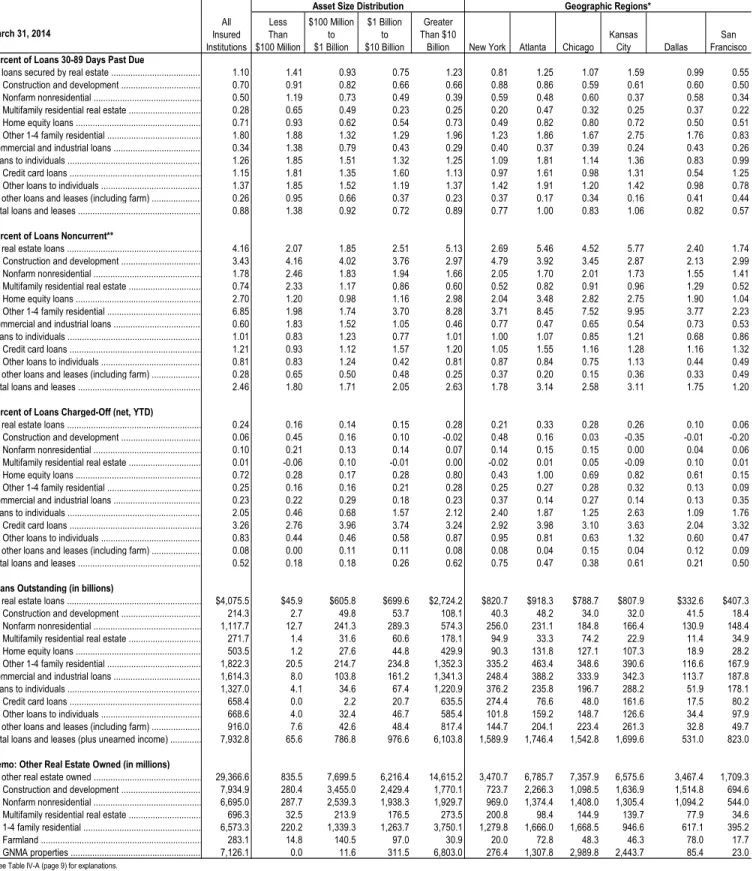
First Quarter 2014 All FDIC Insured Institutions
Percent of Loans 30-89 Days Past Due
All loans secured by real estate ... 1.10 0.15 1.45 0.87 0.78 0.95 0.73 1.51 1.50 1.63 Construction and development ... 0.70 0.00 0.80 0.88 0.65 0.72 1.14 1.11 1.32 0.79 Nonfarm nonresidential ... 0.50 0.00 0.38 0.81 0.50 0.52 1.46 1.08 1.29 0.40 Multifamily residential real estate ... 0.28 0.00 0.14 0.28 0.28 0.31 0.02 0.73 0.70 0.41 Home equity loans ... 0.71 0.62 0.94 0.62 0.59 0.70 0.47 1.03 0.66 0.74 Other 1-4 family residential ... 1.80 0.14 2.33 1.37 1.32 1.06 0.75 2.06 1.79 2.47 Commercial and industrial loans ... 0.34 0.95 0.34 1.03 0.28 0.53 0.32 1.63 1.12 0.35 Loans to individuals ... 1.26 1.11 1.36 1.43 1.13 1.36 0.76 1.52 1.85 1.64 Credit card loans ... 1.15 1.10 1.27 1.14 1.19 1.82 0.56 1.15 1.32 1.28 Other loans to individuals ... 1.37 1.22 1.52 1.45 1.12 1.00 0.82 1.55 1.86 1.70 All other loans and leases (including farm) ... 0.26 0.28 0.18 0.94 0.25 0.15 0.10 0.58 0.42 0.28 Total loans and leases ... 0.88 1.09 0.90 0.93 0.65 0.91 0.71 1.47 1.42 1.15 Percent of Loans Noncurrent**
All real estate loans ... 4.16 0.60 6.04 1.37 2.52 2.91 4.14 2.21 2.25 7.23 Construction and development ... 3.43 0.00 1.29 2.78 3.65 2.55 30.60 4.75 5.00 2.64 Nonfarm nonresidential ... 1.78 4.11 1.20 1.99 1.74 1.51 11.89 2.38 2.47 1.88 Multifamily residential real estate ... 0.74 0.00 0.47 0.69 0.81 0.67 3.19 1.03 2.18 0.67 Home equity loans ... 2.70 0.00 3.64 1.07 1.55 1.96 2.84 0.93 0.76 3.68 Other 1-4 family residential ... 6.85 0.50 10.21 1.30 3.92 3.28 3.26 1.88 2.13 10.92 Commercial and industrial loans ... 0.60 0.90 0.54 1.51 0.68 0.80 0.81 1.58 1.72 0.39 Loans to individuals ... 1.01 1.17 1.12 0.58 0.91 1.19 0.81 0.54 0.91 0.83 Credit card loans ... 1.21 1.18 1.22 0.29 1.38 1.75 1.18 0.70 0.71 1.26 Other loans to individuals ... 0.81 0.86 0.93 0.61 0.84 0.76 0.69 0.53 0.91 0.75 All other loans and leases (including farm) ... 0.28 0.17 0.33 0.43 0.38 0.14 0.09 0.65 0.49 0.15 Total loans and leases ... 2.46 1.14 2.62 1.14 1.81 2.60 1.56 1.84 1.99 3.82 Percent of Loans Charged-Off (net, YTD)
All real estate loans ... 0.24 0.07 0.35 0.05 0.21 0.22 0.43 0.05 0.15 0.27 Construction and development ... 0.06 0.00 -0.21 -0.30 0.20 0.30 0.15 0.33 0.05 -0.49 Nonfarm nonresidential ... 0.10 0.00 -0.03 0.09 0.14 0.05 -0.21 0.08 0.21 -0.01 Multifamily residential real estate ... 0.01 0.00 0.01 0.16 0.02 0.02 -0.21 -1.97 0.09 -0.03 Home equity loans ... 0.72 0.00 0.83 -0.12 0.47 0.56 1.24 0.11 0.21 0.96 Other 1-4 family residential ... 0.25 0.06 0.35 0.10 0.28 0.22 0.19 0.09 0.15 0.22 Commercial and industrial loans ... 0.23 2.42 0.19 0.10 0.23 0.04 0.08 0.02 0.22 0.09 Loans to individuals ... 2.05 3.11 2.73 0.39 0.98 0.92 0.87 0.35 0.25 1.36 Credit card loans ... 3.26 3.18 3.48 1.11 3.63 1.25 2.16 1.72 1.52 3.64 Other loans to individuals ... 0.83 1.56 1.42 0.33 0.58 0.63 0.47 0.24 0.23 0.92 All other loans and leases (including farm) ... 0.08 0.00 0.07 0.00 0.15 0.10 0.18 0.57 0.00 0.04 Total loans and leases ... 0.52 3.03 0.72 0.06 0.27 0.23 0.72 0.11 0.17 0.34 Loans Outstanding (in billions)
All real estate loans ... $4,075.5 $0.2 $476.6 $90.9 $2,060.7 $293.5 $25.5 $13.9 $59.2 $1,055.0 Construction and development ... 214.3 0.0 6.3 4.5 155.8 6.9 0.3 0.9 3.1 36.4 Nonfarm nonresidential ... 1,117.7 0.0 37.1 24.8 802.5 28.2 1.8 5.1 14.4 203.8 Multifamily residential real estate ... 271.7 0.0 49.5 2.6 175.5 9.6 0.2 0.4 1.6 32.4 Home equity loans ... 503.5 0.0 88.2 1.7 204.9 20.1 6.7 0.5 2.5 179.0 Other 1-4 family residential ... 1,822.3 0.2 237.3 23.4 688.1 227.3 16.4 6.2 33.4 590.0 Commercial and industrial loans ... 1,614.3 35.9 274.3 18.8 793.2 16.4 6.2 2.6 6.5 460.3 Loans to individuals ... 1,327.0 412.9 249.3 6.0 274.2 13.7 77.6 2.4 5.8 285.2 Credit card loans ... 658.4 396.6 157.1 0.4 35.4 5.9 18.3 0.2 0.1 44.3 Other loans to individuals ... 668.6 16.3 92.2 5.5 238.7 7.7 59.2 2.2 5.7 240.9 All other loans and leases (including farm) ... 916.0 3.6 300.0 33.9 235.8 16.3 2.0 1.2 4.9 318.2 Total loans and leases (plus unearned income) ... 7,932.8 452.7 1,300.3 149.6 3,363.9 339.8 111.3 20.1 76.4 2,118.7 Memo: Other Real Estate Owned (in millions)
All other real estate owned ... 29,366.6 1.2 3,076.8 612.5 16,733.6 1,345.9 148.2 232.0 670.4 6,545.9 Construction and development ... 7,934.9 0.0 2.1 216.8 6,252.3 251.6 23.1 98.4 206.8 883.8 Nonfarm nonresidential ... 6,695.0 0.0 61.4 229.3 5,029.4 137.0 42.2 81.0 204.7 910.1 Multifamily residential real estate ... 696.3 0.0 6.0 21.7 522.7 18.2 0.4 5.1 17.3 104.9 1-4 family residential ... 6,573.3 0.2 739.3 101.5 3,611.3 489.2 72.7 45.5 229.7 1,283.8 Farmland ... 283.1 0.0 0.0 42.7 212.4 2.3 0.9 2.0 12.0 10.8 GNMA properties ... 7,126.1 0.0 2,213.0 0.4 1,105.7 447.5 8.9 0.0 0.0 3,350.6 * See Table IV-A (page 8) for explanations.
** Noncurrent loan rates represent the percentage of loans in each category that are past due 90 days or more or that are in nonaccrual status.
Other Specialized
<$1 Billion <$1 BillionAll Other >$1 BillionAll Other
TABLE V-A. Loan Performance, All FDIC-Insured Institutions
March 31, 2014
Asset Concentration Groups* All Insured
Percent of Loans 30-89 Days Past Due
All loans secured by real estate ... 1.10 1.41 0.93 0.75 1.23 0.81 1.25 1.07 1.59 0.99 0.55 Construction and development ... 0.70 0.91 0.82 0.66 0.66 0.88 0.86 0.59 0.61 0.60 0.50 Nonfarm nonresidential ... 0.50 1.19 0.73 0.49 0.39 0.59 0.48 0.60 0.37 0.58 0.34 Multifamily residential real estate ... 0.28 0.65 0.49 0.23 0.25 0.20 0.47 0.32 0.25 0.37 0.22 Home equity loans ... 0.71 0.93 0.62 0.54 0.73 0.49 0.82 0.80 0.72 0.50 0.51 Other 1-4 family residential ... 1.80 1.88 1.32 1.29 1.96 1.23 1.86 1.67 2.75 1.76 0.83 Commercial and industrial loans ... 0.34 1.38 0.79 0.43 0.29 0.40 0.37 0.39 0.24 0.43 0.26 Loans to individuals ... 1.26 1.85 1.51 1.32 1.25 1.09 1.81 1.14 1.36 0.83 0.99 Credit card loans ... 1.15 1.81 1.35 1.60 1.13 0.97 1.61 0.98 1.31 0.54 1.25 Other loans to individuals ... 1.37 1.85 1.52 1.19 1.37 1.42 1.91 1.20 1.42 0.98 0.78 All other loans and leases (including farm) ... 0.26 0.95 0.66 0.37 0.23 0.37 0.17 0.34 0.16 0.41 0.44 Total loans and leases ... 0.88 1.38 0.92 0.72 0.89 0.77 1.00 0.83 1.06 0.82 0.57
Percent of Loans Noncurrent**
All real estate loans ... 4.16 2.07 1.85 2.51 5.13 2.69 5.46 4.52 5.77 2.40 1.74 Construction and development ... 3.43 4.16 4.02 3.76 2.97 4.79 3.92 3.45 2.87 2.13 2.99 Nonfarm nonresidential ... 1.78 2.46 1.83 1.94 1.66 2.05 1.70 2.01 1.73 1.55 1.41 Multifamily residential real estate ... 0.74 2.33 1.17 0.86 0.60 0.52 0.82 0.91 0.96 1.29 0.52 Home equity loans ... 2.70 1.20 0.98 1.16 2.98 2.04 3.48 2.82 2.75 1.90 1.04 Other 1-4 family residential ... 6.85 1.98 1.74 3.70 8.28 3.71 8.45 7.52 9.95 3.77 2.23 Commercial and industrial loans ... 0.60 1.83 1.52 1.05 0.46 0.77 0.47 0.65 0.54 0.73 0.53 Loans to individuals ... 1.01 0.83 1.23 0.77 1.01 1.00 1.07 0.85 1.21 0.68 0.86 Credit card loans ... 1.21 0.93 1.12 1.57 1.20 1.05 1.55 1.16 1.28 1.16 1.32 Other loans to individuals ... 0.81 0.83 1.24 0.42 0.81 0.87 0.84 0.75 1.13 0.44 0.49 All other loans and leases (including farm) ... 0.28 0.65 0.50 0.48 0.25 0.37 0.20 0.15 0.36 0.33 0.49 Total loans and leases ... 2.46 1.80 1.71 2.05 2.63 1.78 3.14 2.58 3.11 1.75 1.20
Percent of Loans Charged-Off (net, YTD)
All real estate loans ... 0.24 0.16 0.14 0.15 0.28 0.21 0.33 0.28 0.26 0.10 0.06 Construction and development ... 0.06 0.45 0.16 0.10 -0.02 0.48 0.16 0.03 -0.35 -0.01 -0.20 Nonfarm nonresidential ... 0.10 0.21 0.13 0.14 0.07 0.14 0.15 0.15 0.00 0.04 0.06 Multifamily residential real estate ... 0.01 -0.06 0.10 -0.01 0.00 -0.02 0.01 0.05 -0.09 0.10 0.01 Home equity loans ... 0.72 0.28 0.17 0.28 0.80 0.43 1.00 0.69 0.82 0.61 0.15 Other 1-4 family residential ... 0.25 0.16 0.16 0.21 0.28 0.25 0.27 0.28 0.32 0.13 0.09 Commercial and industrial loans ... 0.23 0.22 0.29 0.18 0.23 0.37 0.14 0.27 0.14 0.13 0.35 Loans to individuals ... 2.05 0.46 0.68 1.57 2.12 2.40 1.87 1.25 2.63 1.09 1.76 Credit card loans ... 3.26 2.76 3.96 3.74 3.24 2.92 3.98 3.10 3.63 2.04 3.32 Other loans to individuals ... 0.83 0.44 0.46 0.58 0.87 0.95 0.81 0.63 1.32 0.60 0.47 All other loans and leases (including farm) ... 0.08 0.00 0.11 0.11 0.08 0.08 0.04 0.15 0.04 0.12 0.09 Total loans and leases ... 0.52 0.18 0.18 0.26 0.62 0.75 0.47 0.38 0.61 0.21 0.50
Loans Outstanding (in billions)
All real estate loans ... $4,075.5 $45.9 $605.8 $699.6 $2,724.2 $820.7 $918.3 $788.7 $807.9 $332.6 $407.3 Construction and development ... 214.3 2.7 49.8 53.7 108.1 40.3 48.2 34.0 32.0 41.5 18.4 Nonfarm nonresidential ... 1,117.7 12.7 241.3 289.3 574.3 256.0 231.1 184.8 166.4 130.9 148.4 Multifamily residential real estate ... 271.7 1.4 31.6 60.6 178.1 94.9 33.3 74.2 22.9 11.4 34.9 Home equity loans ... 503.5 1.2 27.6 44.8 429.9 90.3 131.8 127.1 107.3 18.9 28.2 Other 1-4 family residential ... 1,822.3 20.5 214.7 234.8 1,352.3 335.2 463.4 348.6 390.6 116.6 167.9 Commercial and industrial loans ... 1,614.3 8.0 103.8 161.2 1,341.3 248.4 388.2 333.9 342.3 113.7 187.8 Loans to individuals ... 1,327.0 4.1 34.6 67.4 1,220.9 376.2 235.8 196.7 288.2 51.9 178.1 Credit card loans ... 658.4 0.0 2.2 20.7 635.5 274.4 76.6 48.0 161.6 17.5 80.2 Other loans to individuals ... 668.6 4.0 32.4 46.7 585.4 101.8 159.2 148.7 126.6 34.4 97.9 All other loans and leases (including farm) ... 916.0 7.6 42.6 48.4 817.4 144.7 204.1 223.4 261.3 32.8 49.7 Total loans and leases (plus unearned income) ... 7,932.8 65.6 786.8 976.6 6,103.8 1,589.9 1,746.4 1,542.8 1,699.6 531.0 823.0
Memo: Other Real Estate Owned (in millions)
All other real estate owned ... 29,366.6 835.5 7,699.5 6,216.4 14,615.2 3,470.7 6,785.7 7,357.9 6,575.6 3,467.4 1,709.3 Construction and development ... 7,934.9 280.4 3,455.0 2,429.4 1,770.1 723.7 2,266.3 1,098.5 1,636.9 1,514.8 694.6 Nonfarm nonresidential ... 6,695.0 287.7 2,539.3 1,938.3 1,929.7 969.0 1,374.4 1,408.0 1,305.4 1,094.2 544.0 Multifamily residential real estate ... 696.3 32.5 213.9 176.5 273.5 200.8 98.4 144.9 139.7 77.9 34.6 1-4 family residential ... 6,573.3 220.2 1,339.3 1,263.7 3,750.1 1,279.8 1,666.0 1,668.5 946.6 617.1 395.2 Farmland ... 283.1 14.8 140.5 97.0 30.9 20.0 72.8 48.3 46.3 78.0 17.7 GNMA properties ... 7,126.1 0.0 11.6 311.5 6,803.0 276.4 1,307.8 2,989.8 2,443.7 85.4 23.0 * See Table IV-A (page 9) for explanations.
** Noncurrent loan rates represent the percentage of loans in each category that are past due 90 days or more or that are in nonaccrual status. TABLE V-A. Loan Performance, All FDIC-Insured Institutions
March 31, 2014
Asset Size Distribution Geographic Regions*
All Insured Institutions
Less Than $100 Million
$100 Million to $1 Billion
$1 Billion to $10 Billion
Greater Than $10
ALL DERIVATIVE HOLDERS
Number of institutions reporting derivatives ... 1,398 1,390 1,424 1,412 1,400 -0.1 72 855 372 99 Total assets of institutions reporting derivatives ... $13,233,953 $13,068,354 $12,906,608 $12,690,786 $12,689,035 4.3 $5,355 $357,844 $1,086,216 $11,784,538 Total deposits of institutions reporting derivatives ... 9,974,698 9,858,640 9,682,692 9,410,509 9,427,713 5.8 4,583 297,053 867,615 8,805,447 Total derivatives ... 233,457,475 238,755,603 243,290,586 236,542,159 232,583,465 0.4 190 20,638 91,148 233,345,500
Derivative Contracts by Underlying Risk Exposure
Interest rate ... 185,830,083 194,555,379 195,710,388 188,190,450 184,797,423 0.6 189 18,787 83,240 185,727,867 Foreign exchange* ... 32,994,577 29,668,744 31,200,455 31,471,711 30,374,632 8.6 0 1,680 6,852 32,986,044 Equity ... 2,151,169 2,077,309 2,191,416 2,130,468 2,064,904 4.2 0 73 415 2,150,681 Commodity & other (excluding credit derivatives) ... 1,263,060 1,208,874 1,339,676 1,367,298 1,445,238 -12.6 0 5 220 1,262,835 Credit ... 11,218,586 11,245,297 12,848,651 13,382,231 13,901,267 -19.3 0 93 420 11,218,072 Total ... 233,457,475 238,755,603 243,290,586 236,542,159 232,583,465 0.4 190 20,638 91,148 233,345,500
Derivative Contracts by Transaction Type
Swaps ………..……… 139,451,119 150,608,677 150,075,780 141,036,599 137,818,904 1.2 47 7,389 49,558 139,394,125 Futures & forwards ... 44,424,266 42,022,121 42,067,188 43,970,239 46,024,148 -3.5 44 6,926 22,456 44,394,840 Purchased options ... 17,909,006 16,870,263 17,637,787 17,680,639 16,644,988 7.6 14 815 4,785 17,903,392 Written options ... 17,629,569 16,929,743 17,784,103 17,800,582 17,161,532 2.7 85 5,399 12,705 17,611,380 Total ... 219,413,960 226,430,803 227,564,857 220,488,059 217,649,573 0.8 190 20,528 89,504 219,303,737
Fair Value of Derivative Contracts
Interest rate contracts ... 72,730 71,270 64,832 60,694 67,678 7.5 1 40 56 72,633 Foreign exchange contracts ... 5,563 5,991 -10,390 -4,673 -6,685 N/M 0 0 -6 5,569 Equity contracts ... 1,553 32 -1,928 1,396 -2,588 N/M 0 9 8 1,537 Commodity & other (excluding credit derivatives) ... -893 1,350 1,181 1,298 -2,544 N/M 0 1 -4 -890 Credit derivatives as guarantor ... 80,758 74,870 27,246 -8,729 -20,833 N/M 0 0 0 80,758 Credit derivatives as beneficiary ... -77,327 -71,252 -22,672 13,888 25,373 N/M 0 0 -24 -77,303
Derivative Contracts by Maturity**
Interest rate contracts ... < 1 year 77,936,405 77,933,066 91,852,227 88,198,011 86,869,690 -10.3 41 5,237 17,252 77,913,874 ... 1-5 years 37,667,856 44,472,870 32,988,175 30,694,796 29,322,277 28.5 25 3,423 23,953 37,640,454 ... > 5 years 24,282,231 24,885,723 21,753,468 20,836,812 20,275,485 19.8 38 4,104 23,790 24,254,299 Foreign exchange contracts ... < 1 year 20,099,306 18,349,410 18,975,694 19,247,580 18,646,641 7.8 0 1,249 4,232 20,093,826 ... 1-5 years 2,299,021 2,325,624 2,870,026 2,737,466 2,758,223 -16.6 0 0 93 2,298,928 ... > 5 years 974,381 1,029,302 1,503,977 1,456,229 1,427,702 -31.8 0 0 0 974,381 Equity contracts ... < 1 year 673,720 661,448 706,604 660,945 648,510 3.9 0 3 37 673,679 ... 1-5 years 305,141 292,486 311,790 271,219 255,625 19.4 0 12 112 305,017 ... > 5 years 89,804 135,907 88,294 80,891 74,515 20.5 0 23 18 89,763 Commodity & other contracts ... < 1 year 379,469 338,091 375,292 424,508 479,201 -20.8 0 1 137 379,331 ... 1-5 years 140,984 163,812 175,069 163,093 179,141 -21.3 0 0 8 140,976 ... > 5 years 18,960 5,903 16,142 15,300 21,505 -11.8 0 0 0 18,960
Risk-Based Capital: Credit Equivalent Amount
Total current exposure to tier 1 capital (%) ... 23.5 26.1 27.1 30.5 32.6Blank 0.1 0.3 0.6 26.7 Total potential future exposure to tier 1 capital (%) ... 56.7 58.7 62.4 62.8 62.3Blank 0.1 0.3 0.5 64.5 Total exposure (credit equivalent amount) to tier 1 capital (%) ... 80.3 84.8 89.5 93.3 94.9Blank 0.2 0.6 1.1 91.3
Credit losses on derivatives*** ... 12.9 264.2 180.7 145.0 84.3 -84.7 0.0 0.3 0.1 12.5
HELD FOR TRADING
Number of institutions reporting derivatives ... 245 253 242 242 239 2.5 8 92 81 64 Total assets of institutions reporting derivatives ... 10,658,787 10,573,821 10,414,762 10,169,674 10,137,664 5.1 641 45,186 282,175 10,330,786 Total deposits of institutions reporting derivatives ... 8,023,514 7,985,223 7,805,731 7,533,192 7,537,825 6.4 545 37,451 223,522 7,761,996
Derivative Contracts by Underlying Risk Exposure
Interest rate ... 182,694,013 190,617,697 191,932,848 184,197,615 180,965,139 1.0 25 2,320 21,682 182,669,985 Foreign exchange ... 29,320,112 27,745,453 27,518,482 28,043,313 28,471,504 3.0 0 0 2,700 29,317,411 Equity ... 2,135,205 2,060,585 2,175,912 2,116,168 2,051,707 4.1 0 0 1 2,135,204 Commodity & other ... 1,256,235 1,200,547 1,330,681 1,356,542 1,428,759 -12.1 0 3 123 1,256,108 Total ... 215,405,564 221,624,282 222,957,923 215,713,638 212,917,110 1.2 26 2,323 24,507 215,378,708
Trading Revenues: Cash & Derivative Instruments
Interest rate ... 1,775 475 3,085 2,762 2,216 -19.9 0 0 27 1,748 Foreign exchange ... 2,201 1,532 499 3,139 3,190 -31.0 0 0 2 2,199 Equity ... 607 470 230 922 830 -26.9 0 0 4 603 Commodity & other (including credit derivatives) ... 1,531 483 656 452 1,253 22.2 0 0 0 1,532 Total trading revenues ... 6,114 2,960 4,469 7,275 7,489 -18.4 0 0 32 6,082
Share of Revenue
Trading revenues to gross revenues (%) ... 5.4 2.6 3.9 6.0 6.2Blank 0.0 0.0 1.0 5.5 Trading revenues to net operating revenues (%) ... 26.5 11.5 20.8 31.2 29.0Blank 0.0 0.3 7.9 27.0
HELD FOR PURPOSES OTHER THAN TRADING
Number of institutions reporting derivatives ... 1,280 1,254 1,287 1,272 1,264 1.3 64 785 340 91 Total assets of institutions reporting derivatives ... 12,928,122 12,757,901 12,611,978 12,299,488 12,355,856 4.6 4,715 328,413 993,839 11,601,154 Total deposits of institutions reporting derivatives ... 9,732,773 9,614,299 9,449,509 9,103,518 9,168,313 6.2 4,038 272,530 793,395 8,662,811
Derivative Contracts by Underlying Risk Exposure
Interest rate ... 3,136,071 3,937,682 3,777,540 3,992,835 3,832,284 -18.2 164 16,467 61,558 3,057,882 Foreign exchange ... 849,536 843,789 804,895 756,530 870,503 -2.4 0 1,664 2,929 844,944 Equity ... 15,964 16,724 15,504 14,300 13,197 21.0 0 73 414 15,477 Commodity & other ... 6,825 8,327 8,995 10,756 16,479 -58.6 0 2 97 6,727 Total notional amount ... 4,008,396 4,806,521 4,606,934 4,774,421 4,732,462 -15.3 164 18,205 64,997 3,925,029
TABLE VI-A. Derivatives, All FDIC-Insured Call Report Filers
(dollar figures in millions;
notional amounts unless otherwise indicated) 1st Quarter2014 4th Quarter2013 3rd Quarter2013 2nd Quarter2013 1st Quarter2013 %Change
13Q1-14Q1
Asset Size Distribution
Less Than $100 Million
$100 Million to $1 Billion
$1 Billion to
$10 Billion Greater Than$10 Billion
*Include spot foreign exchange contracts. All other references to foreign exchange contracts in which notional values or fair values are reported exclude spot foreign exchange contracts. ** Derivative contracts subject to the risk-based capital requirements for derivatives.
*** The reporting of credit losses on derivatives is applicable to all banks filing the FFIEC 031 report form and to those banks filing the FFIEC 041 report form that have $300 million or more in total assets. All line items are reported on a quarterly basis. N/M - Not Meaningful
Assets Securitized and Sold with Servicing Retained or with Recourse or Other Seller-Provided Credit Enhancements
Number of institutions reporting securitization activities ... 79 83 82 88 96 -17.7 1 30 17 31
Outstanding Principal Balance by Asset Type
1-4 family residential loans ... $598,531 $610,275 $625,642 $634,877 $636,296 -5.9 $0 $2,824 $13,689 $582,018 Home equity loans ... 41 42 44 46 47 -12.8 0 0 0 40 Credit card receivables ... 16,349 19,405 17,115 17,945 18,832 -13.2 0 161 0 16,189 Auto loans ... 4,735 4,676 4,708 3,860 4,505 5.1 0 711 0 4,024 Other consumer loans ... 4,462 4,607 4,790 4,938 5,155 -13.4 0 2 0 4,460 Commercial and industrial loans ... 1,881 1,987 3,945 4,472 4,025 -53.3 0 12 0 1,869 All other loans, leases, and other assets ... 96,092 101,456 104,890 99,226 140,309 -31.5 0 3,507 5,040 87,545 Total securitized and sold ... 722,091 742,448 761,133 765,366 809,168 -10.8 0 7,218 18,730 696,144
Maximum Credit Exposure by Asset Type
1-4 family residential loans ... 2,895 2,794 2,927 3,086 3,254 -11.0 0 6 38 2,851 Home equity loans ... 0 0 0 0 0 0.0 0 0 0 0 Credit card receivables ... 1,455 603 554 557 588 147.4 0 76 0 1,379 Auto loans ... 5 0 0 0 0 0.0 0 0 0 5 Other consumer loans ... 174 164 168 168 185 -5.9 0 0 0 174 Commercial and industrial loans ... 38 27 20 33 41 -7.3 0 0 0 38 All other loans, leases, and other assets ... 1,308 1,633 1,729 1,861 2,438 -46.3 0 1 0 1,307 Total credit exposure ... 5,876 5,221 5,397 5,705 6,506 -9.7 0 83 38 5,755 Total unused liquidity commitments provided to institution's own securitizations ... 120 121 121 121 121 -0.8 0 0 0 120
Securitized Loans, Leases, and Other Assets 30-89 Days Past Due (%)
1-4 family residential loans ... 3.3 4.3 4.1 4.3 4.0Blank 0.0 1.2 4.4 3.3 Home equity loans ... 8.8 10.4 10.7 9.5 11.5Blank 0.0 0.0 0.0 8.9 Credit card receivables ... 0.9 0.8 1.0 0.8 0.8Blank 0.0 1.4 0.0 0.9 Auto loans ... 0.6 1.0 0.6 0.4 0.3Blank 0.0 0.0 0.0 0.7 Other consumer loans ... 5.2 5.6 5.4 6.0 4.9Blank 0.0 0.0 0.0 5.2 Commercial and industrial loans ... 0.0 0.0 0.0 0.0 0.0Blank 0.0 0.0 0.0 0.0 All other loans, leases, and other assets ... 0.3 0.8 1.1 1.2 1.2Blank 0.0 1.0 0.2 0.3 Total loans, leases, and other assets ... 2.9 3.7 3.6 3.8 3.4Blank 0.0 1.0 3.2 2.9
Securitized Loans, Leases, and Other Assets 90 Days or More Past Due (%)
1-4 family residential loans ... 3.3 3.4 3.7 4.2 4.7Blank 0.0 1.4 6.5 3.2 Home equity loans ... 37.8 36.5 34.4 32.3 31.7Blank 0.0 0.0 0.0 38.3 Credit card receivables ... 0.7 0.6 0.6 0.4 0.4Blank 0.0 1.7 0.0 0.7 Auto loans ... 0.1 0.1 0.0 0.0 0.0Blank 0.0 0.0 0.0 0.1 Other consumer loans ... 6.7 7.3 7.1 6.3 6.9Blank 0.0 0.0 0.0 6.7 Commercial and industrial loans ... 0.0 0.0 0.0 0.0 0.0Blank 0.0 4.2 0.0 0.0 All other loans, leases, and other assets ... 8.7 9.2 8.9 10.2 8.8Blank 0.0 0.6 1.7 9.4 Total loans, leases, and other assets ... 3.9 4.1 4.3 4.9 5.3Blank 0.0 0.9 5.2 3.9
Securitized Loans, Leases, and Other Assets Charged-Off (net, YTD, annualized, %)
1-4 family residential loans ... 0.2 0.9 0.7 0.5 0.3Blank 0.0 0.0 0.0 0.2 Home equity loans ... -0.1 0.2 0.3 0.2 0.3Blank 0.0 0.0 0.0 -0.1 Credit card receivables ... 0.6 2.2 2.0 1.3 0.6Blank 0.0 1.4 0.0 0.6 Auto loans ... 0.0 0.3 0.1 0.1 0.1Blank 0.0 0.0 0.0 0.0 Other consumer loans ... 0.2 0.9 0.7 0.4 0.2Blank 0.0 0.0 0.0 0.2 Commercial and industrial loans ... 0.0 0.0 0.0 0.0 0.0Blank 0.0 0.0 0.0 0.0 All other loans, leases, and other assets ... 0.7 0.9 0.6 0.5 0.1Blank 0.0 0.0 0.0 0.8 Total loans, leases, and other assets ... 0.2 0.9 0.7 0.5 0.3Blank 0.0 0.1 0.0 0.2
Seller's Interests in Institution's Own Securitizations - Carried as Loans
Home equity loans ... 0 0 0 0 0 0.0 0 0 0 0 Credit card receivables ... 13,116 12,850 13,451 13,076 11,868 10.5 0 257 0 12,859 Commercial and industrial loans ... 2 3 3 3 0 0.0 0 2 0 0
Seller's Interests in Institution's Own Securitizations - Carried as Securities
Home equity loans ……….………… 0 0 0 0 0 0.0 0 0 0 0 Credit card receivables ... 0 0 0 0 0 0.0 0 0 0 0 Commercial and industrial loans ... 48 52 0 0 0 0.0 0 0 0 48
Assets Sold with Recourse and Not Securitized
Number of institutions reporting asset sales ... 1,086 1,083 1,066 1,065 1,059 2.5 149 718 171 48
Outstanding Principal Balance by Asset Type
1-4 family residential loans ... 43,650 46,443 48,349 48,783 50,644 -13.8 1,712 13,540 7,842 20,556 Home equity, credit card receivables, auto, and other consumer loans ... 755 776 802 829 852 -11.4 0 14 6 734 Commercial and industrial loans ... 69 62 64 71 74 -6.8 0 23 40 6 All other loans, leases, and other assets ... 65,974 67,794 62,143 63,988 64,769 1.9 2 61 199 65,713 Total sold and not securitized ... 110,448 115,074 111,358 113,671 116,339 -5.1 1,713 13,639 8,087 87,008
Maximum Credit Exposure by Asset Type
1-4 family residential loans ... 9,529 10,727 11,607 12,225 13,152 -27.5 110 1,981 2,669 4,768 Home equity, credit card receivables, auto, and other consumer loans ... 155 160 156 151 167 -7.2 0 14 3 138 Commercial and industrial loans ... 33 27 29 34 36 -8.3 0 23 10 1 All other loans, leases, and other assets ... 16,970 17,058 15,316 15,360 15,216 11.5 2 18 55 16,896 Total credit exposure ... 26,687 27,973 27,109 27,769 28,571 -6.6 112 2,035 2,738 21,802
Support for Securitization Facilities Sponsored by Other Institutions
Number of institutions reporting securitization facilities sponsored by others ... 139 148 154 157 167 -16.8 14 78 28 19 Total credit exposure ... 42,058 44,707 44,848 45,095 48,946 -14.1 12 194 347 41,506 Total unused liquidity commitments ... 1,017 981 923 828 673 51.1 0 0 0 1,016
Other
Assets serviced for others* ... 4,557,964 4,712,508 4,773,340 4,885,219 5,186,035 -12.1 5,373 158,848 287,074 4,106,670 Asset-backed commercial paper conduits
Credit exposure to conduits sponsored by institutions and others ... 12,110 12,317 13,049 11,316 10,925 10.8 5 0 3 12,102 Unused liquidity commitments to conduits sponsored by institutions and others ... 30,515 31,113 40,363 51,893 63,355 -51.8 0 0 798 29,716 Net servicing income (for the quarter) ... 2,141 4,627 3,182 5,827 4,218 -49.2 8 184 155 1,795 Net securitization income (for the quarter) ... 283 395 352 273 394 -28.2 0 8 8 266 Total credit exposure to Tier 1 capital (%)** ... 5.4 5.8 5.9 6.0 6.5Blank 0.9 1.8 2.0 6.5 *The amount of financial assets serviced for others, other than closed-end 1-4 family residential mortgages, is reported when these assets are greater than $10 million.
**Total credit exposure includes the sum of the three line items titled "Total credit exposure" reported above.
$100 Million to $1 Billion
$1 Billion to
$10 Billion Greater Than$10 Billion
TABLE VII-A. Servicing, Securitization, and Asset Sales Activities (All FDIC-Insured Call Report Filers)
(dollar figures in millions) 1st Quarter2014 4th Quarter2013 3rd Quarter2013 2nd Quarter2013 1st Quarter2013 13Q1-14Q1%Change
Asset Size Distribution
Less Than $100 Million
First Quarter 2014
Community Banks
COMMUNITY BANK PERFORMANCE
•
Community Banks Earn $4.4 Billion in First Quarter 2014
•
Net Interest Income Up 5 Percent From a Year Ago, Boosted by Loan Growth
•
Loan Balances Rise During the Quarter, Outpacing Industry Growth
•
Asset Quality Indicators Show Continuing Improvement
•
Community Banks Account for 45 Percent of Small Loans to Businesses
Community Banks Represent 93 Percent of Insured Institutions
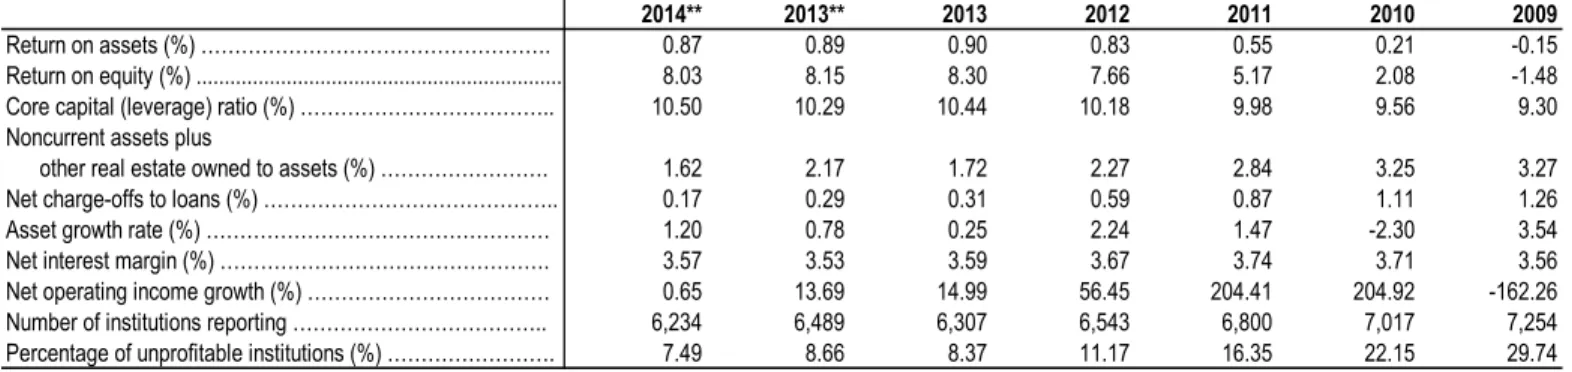
In December 2012, the FDIC released the Community Banking Study which examined institutions that provide traditional, relationship-based banking services in their communities. Based on criteria developed for the study, there were 6,234 community banks (93 percent of all FDIC-insured institutions) in the first quarter of 2014 with assets of $2.0 trillion (14 percent of industry assets). This new section of the Quarterly Banking Profile will provide insight into the condition and performance of this important part of the banking industry.
Earnings Down 1.5 Percent From a Year Ago, Far Less Than the Industry Decline
Community banks reported net income of $4.4 billion, down $67 million (1.5 percent) from first quarter 2013.1 Despite the decline, more than half (54 percent) of all community banks reported higher earnings from a year ago and the percentage reporting a quarterly loss fell to 7.5 percent from 8.7 percent. The percentage decline in earnings at community banks was far less than the 7.6 percent decline for the industry.
Net Interest Income Increases at a Faster Pace Than the Industry
Net interest income—which accounts for about 80 percent of net operating revenue at community banks—was $16.6 billion during the quarter, up $790 million (5 percent) from a year ago. Two-thirds (67 percent) of
community banks reported a year-over-year increase. The average net interest margin at community banks of 3.57 percent was 4 basis points higher than a year ago and 40 basis points above the industry average. Nearly 76 percent of community banks reported net interest margins above the industry average of 3.17 percent.
Lower Noninterest Income and Higher Noninterest Expense Reduce Earnings
Noninterest income—which accounts for about 20 percent of net operating revenue at community banks—was $4.1 billion in the first quarter, down $562 million (12 percent) from first quarter 2013 as revenue from loan sales—including mortgage sales—declined by $657 million (52 percent) from a year ago. Like community banks, the industry experienced an 11 percent year-over-year decline in noninterest income, driven by a 44 percent decline in income from loan sales. Noninterest expense at community banks was $315 million (2.2 percent) higher than a year earlier. Relative to total assets at community banks, noninterest expense declined to 0.72 percent from 0.73 percent a year ago, as assets grew at a faster pace than noninterest expense.
Loan Growth at Community Banks Higher Than the Industry
Total assets at community banks increased by $28 billion (1.4 percent) from the previous quarter, as loan balances grew by $12.3 billion (0.9 percent). Community banks reported higher loan growth than the industry, which experienced 0.5 percent growth. Over 75 percent of the increase in loan balances at community banks during the quarter was due to nonfarm nonresidential real estate loans (up $5.8 billion or 1.5 percent) and commercial and industrial loans (up $3.6 billion or 2.0 percent). Year-over-year loan growth at community banks of 6.6 percent also outpaced the industry at 3.6 percent. Total unused loan commitments at community banks increased by $12.1 billion (5.2 percent) during the quarter to $245 billion, indicating the potential for additional on-balance sheet loan growth in future quarters.
1
Prior period dollar amounts used for comparisons are merger-adjusted, meaning the same institutions identified as community banks in the current quarter are used to determine dollar amounts in prior quarters, after taking into account acquisitions. Performance ratios are not merger-adjusted.
First Quarter 2014
Community Banks
Community Banks Hold 45 Percent of Small Loans to Businesses
Small loans to businesses—loans to commercial borrowers up to $1 million, and farm loans up to $500,000—at community banks totaled $296.1 billion in the first quarter, down by $920 million (0.3 percent) from the prior quarter but up by $8.2 billion (2.9 percent) from a year ago. Commercial and industrial loans increased by $1.4 billion (1.6 percent) from last quarter, while agricultural production loans fell by $2.8 billion (10.5 percent). Over two-thirds (68 percent) of the year-over-year increase in small loans to businesses was driven by improvement in commercial and industrial loans, and nonfarm nonresidential real estate loans.
Noncurrent Loan Rate at Community Banks Declines for 16 Consecutive Quarters
Loan performance at community banks continued to improve, as the noncurrent loan rate and the net-charge off rate both declined from the previous quarter and a year ago. Noncurrent loans (those 90+ days past due or in nonaccrual status) totaled $22 billion, down $6.2 billion (22 percent) from a year ago. Over 60 percent of community banks reported a decline in noncurrent loans relative to a year ago. The noncurrent rate was 1.68 percent in the first quarter, its lowest level since the first quarter of 2008. The noncurrent rate fell 11 basis points from the previous quarter and 65 basis points from a year ago, and it is 78 basis points below the industry rate of 2.46 percent. The coverage ratio (loan loss reserves relative to noncurrent loans) for community banks improved for a 10th consecutive quarter, rising from 87.4 percent to 91.2 percent despite a small ($55 million or 0.3 percent) decline in reserves during the quarter. The coverage ratio at community banks is well above the industry average of 67.8 percent.