Seismic Accelerometer Installation and User
Guide
Owen Giersch
January 1, 2021
Contents
1 Introduction 1
2 Hardware Setup 2
3 Software Installation 5
3.1 Requirements . . . 5
3.2 Install Instructions . . . 5
3.3 List of Installed Programs and Libraries . . . 7
3.4 Directory Structure . . . 10
4 Configuration: The siteinfo.dat File 10 5 Program Operation 11 5.1 seismic.sh . . . 11
5.2 dailyseismicplot.sh . . . 11
5.3 seismicrtviewer.sh . . . 12
5.4 seismicarchiveviewer.sh . . . 12
6 Data Format 13 6.1 File Name Format . . . 14
6.2 Header Line . . . 14
6.3 Data Description . . . 14
1
Introduction
The purpose of these programs is to collect acceleration data caused by seis-mic activity. The accelerometer is sampled at 20 Hz. Data is saved both in a text file and as a gif image.
There are three main programs: A data collection program, a real time viewer and a data archive viewer.
The data collection program is automated. The real time viewer has minmal interaction, mostly for saving plots. The data archive viewer Allows data to be viewed at different time resolutions.
This guide describes the hardware setup, intallation process, data format, adjusting settings and viewing data.
2
Hardware Setup
The hardware required is as follows:
• Raspberry Pi with a minimum 16 GB SD card (preferably 32 GB or more) which has an active internet connection.
• Adafruit ADXL345 - Triple-Axis Accelerometer (May work with other Adafruit accelerometers, but has not been tested with them).
• A breadboard or other means to mount the accelerometer, along with jumper cables for connection between the RPi and accelerometer.
• A mouse, keyboard and monitor for initial setup. Once installed the programs can run headless.
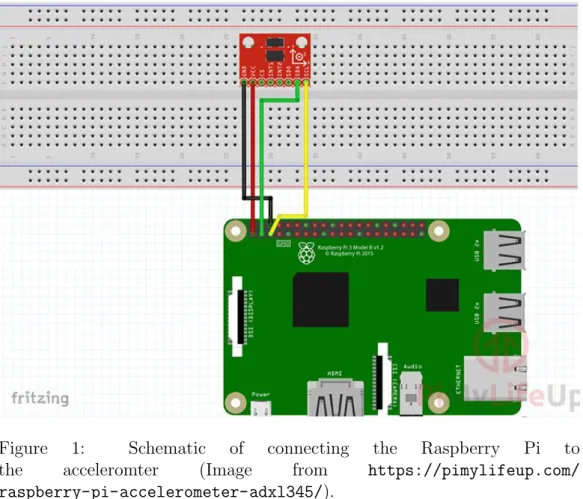
Figure 2 shows how to connect the RPi to the accelerometer. Note that some accelerometers and older RPi’s may have slightly different pin-outs, so check the boards and documentation carefully.
• Connect the ground on the accelerometer to the ground on the RPi (typically pin 6).
• Connect VCC on the accelerometer to the 3v3 pin on the RPi (typically pin1).
• Connect SDA on the accelerometer to the SDA pin on the RPi (typi-cally pin3).
• Finally, connect SCL on the accelerometer to the SCL pin on the RPi (typically pin5).
Figure 1: Schematic of connecting the Raspberry Pi to the acceleromter (Image from https://pimylifeup.com/ raspberry-pi-accelerometer-adxl345/).
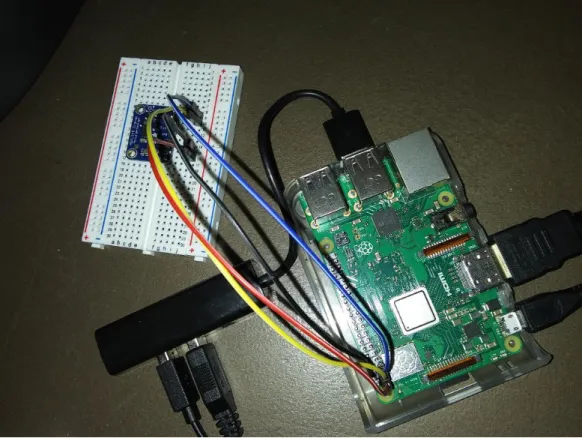
Figure ?? shows an accelerometer mounted on a breadboard connected to a RPi.
3
Software Installation
3.1
Requirements
The programs are written for the raspberry pi. The have been tested on the RPi 3.. In principal, this software and installation should work on Rasp-berry Pi. This guide specifically deals with installation using the Raspbian operating system.
You will require the follwing files:
• seismic.tar.gz
Figure 2: Photo of the accelerometer mounted on a breadboard connected to a Raspberri Pi.
3.2
Install Instructions
The procedure below details the installation. The seiinstall.shfile makes the process automated aside from a few options that will need to be entered. The user entered values can be changed at a later time if needed. The installation can take a few hours as some libraries are compiled from source.
1. Ensure you have a SD card with Raspbian installed on it and inserted into the RPi.
2. Connect the accelerometer as described in section??. 3. Power on the RPi.
4. Open up a terminal.
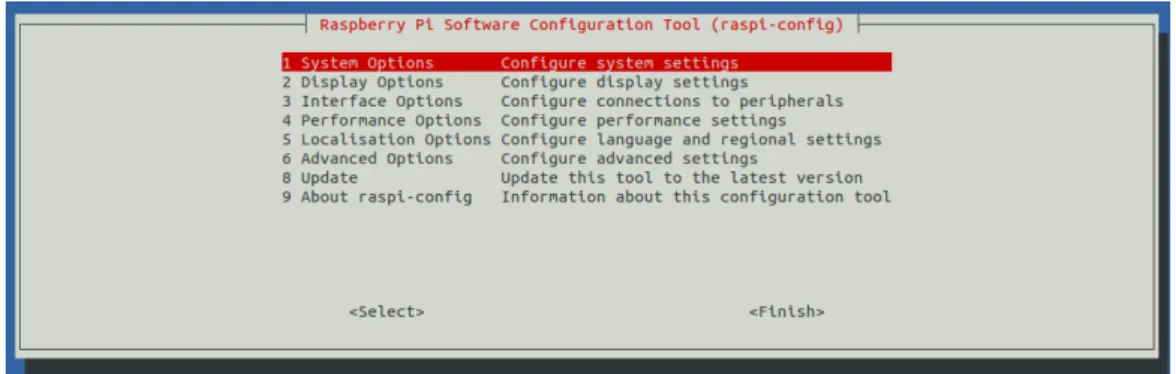
5. Enter the command: sudo raspi-config
6. A new screen shown in figure 3. Using the arrow keys select3 Interface Options and then press enter.
7. A new list of options will appear as shown in figure 4. Again using the arrow keys select P5 I2C and press enter.
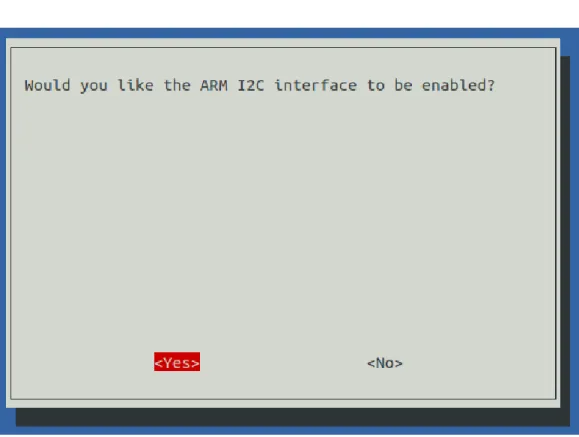
8. A screen asking ”Would you like the ARM I2C interface to be enabled?” (Figure) 6Using the arrow keys select Yes and then press enter. 9. A screen will appear stating that ”The ARM I2C interface is enabled”
(??). Just press enter.
10. Using the tab key, select Finish and press enter.
11. Copy the seismic.tar.gz and seiinstall.sh files to the /home/pi
folder.
12. Enter the command: chmod +x seiinstall.sh(This makes the script executable).
13. Run the install script by issuing the command: seiinstall.sh
14. The script will issue the following prompts:
• Enter the Site Name:
Enter the name for the site where the accelerometer is to be de-ployed. if no name is entered then the site name will default to
• Enter the Site Abrieviation:
Supply a site abbrieviation. This will be used in file names. If no abrieviation is entered the site abrieviation will default to AA. It should consist of 1 to 3 characters.
• Enter the axis to use (x, y or z) [Enter for z]: ’
Supply the axis to use: x, y or z. If no axis is supplied, z is selected by default. In addition, if anything other than x, y, or z is entered then, z is selected by default.
• Enter the FTP address [Enter for none]:
If data is going to be ftp’d enter the ftp address for the images that are produced. Do not enter anything if you do not wish to ftp images.
• Enter the path on the FTP server [Enter for default of .]:
This prompt will only appear if you have entered ftp address. En-ter a path for where the images are to be stored on the ftp server. If none is selected, the root directory (.) will be used.
• Enter the FTP username:
This prompt will only appear if you have entered ftp address. Enter the user name for the ftp account.
• Enter the FTP password:
This prompt will only appear if you have entered ftp address. Enter the password for the ftp account.
15. The remainder of the process is entirely automatic, except after in-stalling updates, it will display a screen show what has been changed. Just press q to quit this screen.
16. At the end of the installation the RPi will rebooot and start collecting data.
3.3
List of Installed Programs and Libraries
The following are the required programs and libraries that are installed.
• gfortran: The numpy, astropy and adafruit libraries for python.
• ncftp: FTP programs for sending images to a remote server.
• java: Java compiler used for compiling display programs.
Figure 3: The main menu of the raspi-config program. Select Option 3 using the up and down arrows.
Figure 4: The Interface Options menu of the raspi-config program. Select Option P5 using the up and down arrows.
• dailyseismicplot.jar: Creates a plot of the last UT day’s data.
• seismicrtviewer.jar: Displays the last 10 minutes of real time data.
• seismicarchiveviewer.jar: Allows viewing of archived data at dif-ferent resolutions.
The .exe and .jar files are executed by scripts. These are detailed in section 5.
3.4
Directory Structure
All programs and data are stored in sub-directories in the/home/pi/satellite
folder. Below is a list of the directories and what they contain.
• /home/pi/seismic/bin: Contains the executables and scripts for seis-mic data collection and viewing.
• /home/pi/seismic/src: Contains the source code for the programs in case they need to be recompiled for some reason.
• /home/pi/seismic/temp: Contains temporary images for FTP. This only contain a file around the UT change of day.
• /home/pi/seismic/archive: Contains the seismic accelerometer data files (.sei files). These files should be moved to more permanent storage every few months.
• /home/pi/seismic/images: This contains the 12 hour seismic ac-celerometer images (.gif files). These files should be moved to more permanent storage every few months.
Note that the archive and image directories should be emptied on a reg-ular basis to prevent the memory card from becoming full.
4
Configuration: The
siteinfo.dat
File
The siteinfo.dat file is set up initially with options entered during in-stall. These can be changed by editing the siteinfo.dat file found in the
/home/pi/satellite/bin folder. Below is a sample siteinfo.dat file.
sitename=Bishop siteabr=BI
axis=z archivepath=/home/pi/seismic/archive/ imagepath=/home/pi/seismic/images/ temppath=/home/pi/seismic/temp/ ftpaddr=spaceacademy.net.au ftppath=. ftpuser=myusername ftppw=mypassword
A description of each of the parameters is given in section 3.2.
Once you edit the siteinfo.dat file you will need to restart the RPi in order for the changes to take effect.
5
Program Operation
All programs are started from scripts. The heading below detail the script name. Results will be unpredictable if you try to run the executables directly. In addition both the seismic.sh and dailyseismicplot.sh are designed to be run from cronjobs and should not be executed by the user.
5.1
seismic.sh
Program executed: seismic.py User executed: No
The seismic.sh script starts seismic.py program which collects and saves the accelerometer data (saved in the/home/pi/seismic/archivefolder). The script is started a cron job at startup. This should never be run by the user.
5.2
dailyseismicplot.sh
Program executed: dailyseismicplot.jar User executed: No
The dailyseismicplot.sh script runs the dailyseismicplot.jar file. This creates a gif file for the previous 24 hours (0 to 24 UT) of data. The gif files are stored in the /home/pi/seismic/images folder. In addition the script will also FTP the gif file if this option was selected. This script is run automaticcaly as a cron job every 24 hours.
Figure 7: Screenshot of the realtime viewer.
5.3
seismicrtviewer.sh
Program executed: seismicrtviewer.jar User executed: Yes
The seismicrtviewer.sh script runs the seismicrtviewer.jar pro-gram. This displays a near real-time plot of the previous 10 minutes of data. Figure 7 shows a sample of realtime viewer.
The display updates every minute. This program can be executed from a terminal from within any directory simply by issuing the command:
seismicrtviewer.sh
5.4
seismicarchiveviewer.sh
Program executed: seismicarchiveviewer.jar User executed: Yes
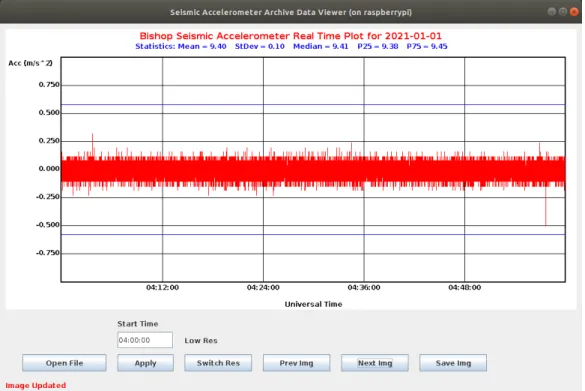
The seismicarchiveviewer.sh script allows data from different dates to be viewed. The data can be viewed in high resolotution (15 minute time
Figure 8: Screenshot of the data viewer.
span) or low resolution (1 hour time span). Figure 8 shows a sample archive plot.
The start time of the plot can be adjusted by changing the time in the
Start Time box and clicking Apply. The resoloution can be changed by clicking on the Switch Res button. Click on Prev Img or Next Img to go through the loaded UT days data. Click on Open File to load a new day of data. Clicking on Save Imgwill allow you to save the currently displayed image in a chosen location.
This program can be executed from a terminal from within any directory simply by issuing the command:
seismicarchiveviewer.sh
6
Data Format
The data files .sei files are simply text files. The first line is file header information, and the remaining lines contain the data for each second.
6.1
File Name Format
Each file as the following naming convention: AAyyyymmdd.sei whereAA is the site abbrieviation (can be more than two character if required), yyyy is the year, mm is the month and dd is the day.
6.2
Header Line
The header line contain 4 comma seperated fields. below is an example: 20210101,Bishop,BI,z
The first field is the UT date for the data in the form of YYYYMMDD. The second field is the site name. The third firld is the site abbrieviation, and the fourth field is the axis that the data was collected from.
6.3
Data Description
Immediately following the header line is the data section. Each line contains 21 fields. The first field is the Universal Time in the form hhmmss. The remaining twenty fields the acceleration measured at 50 ms intervals and are of the form F6.2. Each field is space delimited. An example of a data line with the firrst few fields is given below.
031400 9.26 9.53 9.53 9.45 9.22 9.34 9.41 ...
Note that occassionally a sample will not be read or missed. In this case the field is given the value of -99.9.
7
Errors
Errors are logged in the /home/pi/seismic/bin/error.log file. Each of these files gives a date and a time of the error and what the error was. These files should be deleted periodically.