© The Author 2014. Published by Oxford University Press on behalf of The Gerontological Society of America. All rights reserved. For permissions, please e-mail: [email protected].
525
Research Article
Mobility Disability in Older Adults: At the Intersection of
People and Places
William A. Satariano, PhD, MPH,
*
,1Melissa Kealey, PhD, MPH,
1Alan Hubbard, PhD,
1Elaine Kurtovich, MPH, PT,
1Susan L. Ivey, MD, MHSA,
1Constance M. Bayles, PhD,
2Rebecca H. Hunter, MEd,
3and Thomas R. Prohaska, PhD
41
School of Public Health, University of California, Berkeley.
2Center for Social and Urban Research, University of Pittsburgh,
Pennsylvania.
3Center for Health Promotion and Disease Prevention, University of North Carolina, Chapel Hill.
4College of
Health and Human Services, George Mason University, Fairfax, Virginia.
*Address correspondence to William A. Satariano, PhD, MPH, School of Public Health, University of California, Berkeley, Berkeley, CA 94720-7360. E-mail: [email protected]
Received May 30, 2014; Accepted September 8, 2014
Decision Editor: Rachel Pruchno, PhD
Abstract
Purpose: Mobility disability is associated with poor lower body function among older adults. This study examines whether specific types of neighborhood characteristics moderate that association.
Design and Methods: This study is based on a cross-sectional sample of 884 people aged ≥ 65 years identified through service organizations in Alameda County, CA; Cook County, IL; Allegheny County, PA; and Wake and Durham counties, NC. In-person interviews focus on neighborhood characteristics, physical and cognitive function, depression, and walking. Functional capacity is tested using objective measures of lower body strength, balance, and walking speed. Mobility disabil-ity, the main study outcome, is measured as self-reported level of difficulty in walking 2–3 neighborhood blocks. Estimates of main and interactive effects are derived from logistic regression models.
Results: Among older adults with poor lower body function, those who report less proximity to goods and services and barriers to walking report more mobility disability than other older adults. In contrast, among older adults with good lower body function, there is a low prevalence of mobility disability and little association between perceptions of the neighbor-hood and mobility disability.
Implications: In addition to more refined longitudinal studies, this research provides a foundation for innovative place-based rehabilitation and hospital discharge programs for older adults newly diagnosed and treated for chronic health conditions.
Level of difficulty in walking is an important measure of mobility disability among older adults (Lee & Buchner, 2008; Satariano et al., 2012). Those who report difficulty in walking two to three neighborhood blocks, a stand-ard measure of mobility disability (Rosow & Breslau, 1966), are in poorer health and have lower levels of overall functioning than those who do not report such difficulty (Hardy, Kang, Studenski, & Degenholtz, 2010;
Simonsick, Guralnik, Volpato, Balfour, & Fried, 2005). Disability is typically defined as physical or cognitive difficulty in performing social roles or other everyday
activities (Pope & Tarlov, 1991). It represents a dynamic state in which functional capacities, such as balance and lower body strength, are insufficient to meet current and changing social expectations and environmental chal-lenges (Verbrugge & Jette, 1994). Functional limitations, in turn, refer to either self-reported or directly measured reduced generic capacities, such as lifting, balance, walk-ing speed, and lower body strength (Pope & Tarlov, 1991;
Verbrugge & Jette, 1994).
Given the health and functional impact of walking, it is important to understand the reasons why some older adults
report difficulty walking in their neighborhood (defined here as “mobility disability”), whereas others do not. Not only will this research contribute to a better understanding of the epidemiology of aging, health, and mobility, it will also serve as a foundation for the development of innova-tive interventions to promote walking and good health.
Reported difficulty in walking is associated with char-acteristics of both lower body functional capacity and environmental challenge (King, 2008; Lawton, 1986). For example, older adults with reduced functional capacity, such as poor lower body function, are more likely than those with good lower body function to be less mobile, experience greater disability, and suffer premature death (Guralnik, Ferrucci, Simonsick, Salive, & Wallace, 1995). There is also research indicating that older adults’ perceptions of their neighborhoods as well as the structural characteristics of the neighborhoods are associated with both frequency and level of difficulty in walking (Satariano, Ory, & Lee, 2012;
Yen, Michael, & Perdue, 2009). Older adults who reside in neighborhoods that are single-use, have broken sidewalks, extended block lengths, or few walkable destinations tend to walk less than older residents living in more compact, mixed use (i.e., residences in close proximity to goods and services) neighborhoods with well-maintained sidewalks (Clarke, Ailshire, & Lantz, 2009; Li, Fisher, Brownson, & Bosworth, 2005; Satariano et al., 2010; Shumway-Cook et al., 2003). In addition, older adults who perceive their neighborhoods as unsafe with more impediments to walk-ing are, in fact, less likely to walk and more likely to report difficulty walking there (Balfour & Kaplan, 2002; Clark et al., 2009; Wang & Lee, 2010).
There is a growing body of research indicating that the joint or interactive effects of characteristics of people and places may be especially important (Clarke, Ailshire, Bader, Morenoff, & House, 2008; Clarke & George, 2005; Gong, Gallacher, Palmer, & Fone, 2014). Indeed, the basic tenet of the environmental theory of aging, as first proposed by Lawton and colleagues, is that the effects of the envi-ronment on health and well-being become more salient as age-related functional limitations increase (Lawton & Nahemow, 1973; Lawton, 1986). This suggests, in turn, that elements of the environment, as measured by either self-reports or objective indicators, have a more significant effect on health and function both among older adults than among younger adults, and also among older adults with poor functional capacity than among older adults with good functional capacity. In other words, the character-istics of place may moderate the adverse effects of poor lower body functioning on ease of walking. Although the nature of the interaction involving the functional capac-ity of individuals and the characteristics of neighborhoods may vary by the type and measurement of mobility exam-ined (e.g., reports of time spent walking in a typical week vs. reports of overall difficulty walking) and the type of analytic approach employed (Satariano et al., 2010), there is evidence to support Lawton and colleagues’ hypothesis.
Compared with disabled older adults, those without dis-abilities travel greater distances, complete more errands, and are better able to circumvent environmental barri-ers, such as poor street conditions (Shumway-Cook et al., 2003; Shumway-Cook et al., 2002). From a policy perspec-tive then, this research suggests that good neighborhood design and maintenance may reduce the extent and sever-ity of difficulty walking among older people with reduced lower body capacity (Dumbaugh, 2008; Plouffe & Kalache, 2010). With the aging of the population and the prospects of an increase in the prevalence of lower body functional limitations, more detailed research in this area is needed.
Our purpose here is to examine whether elements of the neighborhood environment moderate the association between objectively measured lower body function and mobility disability, as measured by self-reported difficulty in walking two to three neighborhood blocks.
Methods
Sample
The data set used for this study is from the Healthy Aging Research Network (HAN) Walking Study, a cross-sectional study of the associations among functional capacity, the neighborhood environment, and walking in older residents in four locations across the United States, and funded by the Centers for Disease Control and Prevention (CDC). The sample consists of 884 people aged 65 and older iden-tified through senior organizations in Alameda County, CA; Cook County, IL; Allegheny County, PA; and Wake and Durham Counties, NC. These counties, selected from among participating sites in the CDC HAN, reflect a range of weather and topographic patterns.
All senior organizations (in most cases, senior centers) in these geographic areas were geocoded and categorized into quintiles of housing density levels as a general proxy for “walkability,” based on the 2000 U.S. Census. In order to ensure that senior centers from different types of neighbor-hoods were selected, at least four senior organizations were randomly sampled from each of the five categories of hous-ing density to ensure variability in walkability. This sam-pling was conducted in each of the four geographic areas. Fifteen participants per senior organization were targeted for enrollment. Ultimately, participants were recruited from 77 different senior organizations, which helped to ensure that the participants’ home residences were located in a wide variety of neighborhood types.
to prevent completion of the interview and walking diary. These criteria restricted the sample to individuals who were physically capable of walking within their neighborhood. Enrollment was monitored to ensure recruitment of people with a range of self-reported overall health.
Eligible participants were interviewed at the senior organizations (78.7%); in the participant’s home (17.4%); or at some other location (3.9%). Informed consent was obtained prior to the interview, as provided by the Institutional Review Board at each of the participating uni-versities: University of California, Berkeley; University of Illinois, Chicago; University of Pittsburgh; and University of North Carolina, Chapel Hill. The interviews were con-ducted between September 2005 and November 2007.
Baseline Interview
The interview included both a questionnaire and direct assessments of physical performance. The questionnaire included demographic and socioeconomic factors; his-tory of chronic conditions and symptoms; hishis-tory of falls and injuries; physical function and activities of everyday life (activities of daily living [ADLs], instrumental ADLs, Rosow-Breslau and Nagi items; Nagi, 1976; Rosow & Breslau, 1966; VanSwearingen & Brach, 2001); cognitive function (the Mental Alternation Test and a modified ver-sion of the Mini-Mental State Examination; Barnes, Yaffe, Satariano, & Tager, 2003; Billick, Siedenburg, Burgert, & Bruni-Solhkhah, 2001; Folstein, Folstein, & McHugh, 1975; Reitan, 1958); general feelings and a modified ver-sion of the Center for Epidemiologic Studies Depresver-sion Scale (Andresen, Malmgren, Carter, & Patrick, 1994); self-efficacy for walking; social networks and social sup-port; extensive questions on assessments of neighborhood characteristics (Saelens, Sallis, Black, & Chen, 2003); and levels of walking and other forms of physical activity. Direct measures of performance were also included, based on measures of walking speed, balance, and lower body strength (Guralnik et al., 1995; Guralnik & Simonsick, 1993; Guralnik et al., 1994; Satariano et al., 2010).
Study Variables
Mobility Disability
Mobility disability, the main study outcome, is measured by self-reported walking difficulty, based on a modified set of standard questions from Rosow and Breslau (Rosow & Breslau, 1966; VanSwearingen & Brach, 2001). In this version, respondents were asked what level of difficulty they have had in the past month (a) getting up or down a flight of stairs and (b) walking two to three neighborhood blocks. If they had done the activity in the past month, respondents were asked to report their level of difficulty from the following options: “a lot,” “some,” “a little,” or “none.” If they had not done the activity in the past month, they were asked to report whether they did not do the activity because of doctor’s orders, are
not able to, they never do, they do not know, or they refused to answer. Responses to the extent of difficulty were dichoto-mized as “no difficulty” (“none”) versus “any difficulty” (“a little”, “some”, or “a lot”). Those who reported that they did not do the activity because they were “not able to” were also included in the general summary category of “any difficulty.” Those reporting that they did not do the activity because of “doctor’s orders” (0%), because they “never do” (2.5%), “don’t know” (0%), or they “refused” to answer (0%) were dropped from the analysis. Given our focus on the outdoor environment and the inability to differentiate between indoor and outdoor stair climbing, we restricted the measurement of mobility disability to reported difficulty in walking two to three neighborhood blocks, which is consistent with other studies in this area (Clarke et al., 2008).
Lower Body Functional Capacity
A modified version of the Short Physical Performance Battery (SPPB) was used (Guralnik et al., 1995; Satariano et al., 2010). The standard version of SPPB, which is based on direct, objective measures of walking speed, balance, and lower body strength, was modified in several ways. First, to obtain a more sensitive measure of regular, sustained walk-ing, walking speed (feet per second) was derived from a 60-s walk rather than a single 8-foot walk. Second, a one-legged stand was included to distinguish among those who could complete the full tandem stand (standing with the heel of one foot in front of and touching the toes of the other foot for 10 s), the final and most difficult standard SPPB assessment of balance. Seventy-six percent of the respondents could hold the full-tandem stand for 10 s, but 47.1% could not complete the more difficult one-legged test. More (49.1%) of the par-ticipants who completed the one-legged stand reported walk-ing ≥ 150 minutes per week, the CDC recommended level of walking, compared with those who completed the full tan-dem stand only (30.6%). Finally, as in the standard SPPB, lower body strength was measured as the time to rise from a seated position to a standing position five times in sequence with arms folded across the chest. This modified SPPB, like the original version, was summarized in quartiles from poor to excellent lower body function (Satariano et al., 2010). The terms “lower body functional capacity,” “lower body func-tion,” and “capacity” are used interchangeably in this article.
Neighborhood Environment: Self-report
pedestrian traffic safety, crime and safety, neighborhood satis-faction/social capital, parking, cul-de-sacs, hilliness, and bar-riers to walking (e.g., freeways, railway lines, and rivers) .
Neighborhood Environment: Geographic Information Systems
Three geographic information systems (GIS)-derived neigh-borhood variables were included in the analysis (number of selected types of businesses within 400 m of participant’s residence, median block length for census track of resi-dence, and housing density for census track of residence).
Geocoding of participants’ residences was conducted in two rounds. The first round used ESRI Business Analyst 9.2. For the second round of geocoding, ArcInfo 9.3 was employed to take advantage of improvements to the base map. Manual geocoding was also used.
The GIS-derived neighborhood business density vari-able was based on geocoded environmental data within a 400-m buffer (radial distance) of each participant’s residen-tial address (Nagel, Carlson, Bosworth, & Michael, 2008). This distance (a) has been used in other studies of older populations; (b) is comparable to the average distance traveled by older subjects, based on direct observations of neighborhood walking (~300 m) (Shumway-Cook et al., 2002); and (c) is consistent with a regular median walking distance traveled by members of the present study cohort (366 m), based on direct assessment of their walking speed (43 m/min) and reported time to reach common walking destinations. ESRI Business Analyst was used, which con-tains data from InfoUSA for businesses listed on January 1, 2006. Businesses that were possible walking destinations were categorized according to North American Industry Classification System codes and summed to create a count of the number of retail businesses within the 400 m buffer.
Street connectivity (e.g., median block length) and hous-ing unit density were determined by the census tract of each participant’s residence. The U.S. Census 2000 data from the SF3 files was used to measure housing unit density. Median block length data from 2000 was used from the RAND Center for Population Health and Health Disparities (CPHHD) was used to measure street connectivity. In addi-tion, the CPHHD median block length data for 2000 were supplemented with 1990 data when 2000 data were miss-ing after validatmiss-ing that, when both 1990 and 2000 median block length data were available, they were usually identical.
Covariates
Data included a standard set of covariates: study site, age, gender, race, household income, education level, access to a car, and number of years at the current residential address.
Analytic Plan
General linear models (GLM) were used to fit models in R statistical software version 3.0.2 (R Development Core
Team, 2013). We constructed a series of estimates of the interaction of lower body function with a series of neigh-borhood variables on the outcome of walking difficulty. We fit logistic regression models. All of the main effects were specified as dummy variables, including lower body func-tion (four categories) and the neighborhood variables (two, three, or four categories). Each interaction term was speci-fied as the continuous product of the ordered categories (lower body function times a neighborhood variable). To reduce the number of parameters in the models, we entered the ordered categorical variables for the interaction terms, not via dummy variables, but a simple integer scale (e.g., the barrier variable was parameterized in the interaction term as 4, 3, 2, and 1, with 4 = least barriers [most walk-able] to 1 = most barriers [least walkwalk-able], whereas lower body function was parameterized in all the interaction term as 4, 3, 2, and 1, with 4 = best quartile of lower body func-tion and 1 = worst quartile of lower body funcfunc-tion). For the main effect variables, these same variables were coded as three dummy variables, that is, indicators of membership in groups 2–4. A separate model was derived for each of the 17 NEWS and GIS neighborhood variables and its interac-tion with lower body funcinterac-tion, adjusting for a standard set of 8 previously identified potential confounders (study site, age, gender, race, education, income, access to a car, and number of years at the current address). For each model, we predicted the probability of difficulty walking two to three neighborhood blocks (mobility disability), setting the two variables of interest that make up the interaction at all relevant combinations, keeping the remaining variables at their observed value. Based on these adjusted marginal pre-dictions, we constructed measures of additive interaction to calculate the excess risk associated with the extremes of perceived and GIS-based neighborhood characteristics for both the group with the highest functional capacity and the group with the lowest functional capacity. We then used the clustered nonparametric bootstrap (that is, randomly sampled clusters with replacement) (Efron, 1982) to derive robust standard errors, which account for correlation due to the clustering. Following convention, interaction terms with p < .20, rather than 0.05, were considered to be sig-nificant (Selvin, 1996). The Bonferroni correction was also calculated to adjust for multiple comparisons (Bland & Altman, 1995). Because there is some disagreement about the value of the Bonferroni correction in all instances, for example, unnecessary reduction of statistical power (Rothman, 1990), we present the results with and without the correction for the readers’ consideration.
Results
Sample Characteristics
are generally consistent with a 1984 national survey that found that women were over represented at senior centers (Krout, Cutler, & Coward, 1990). Census 2000 data on
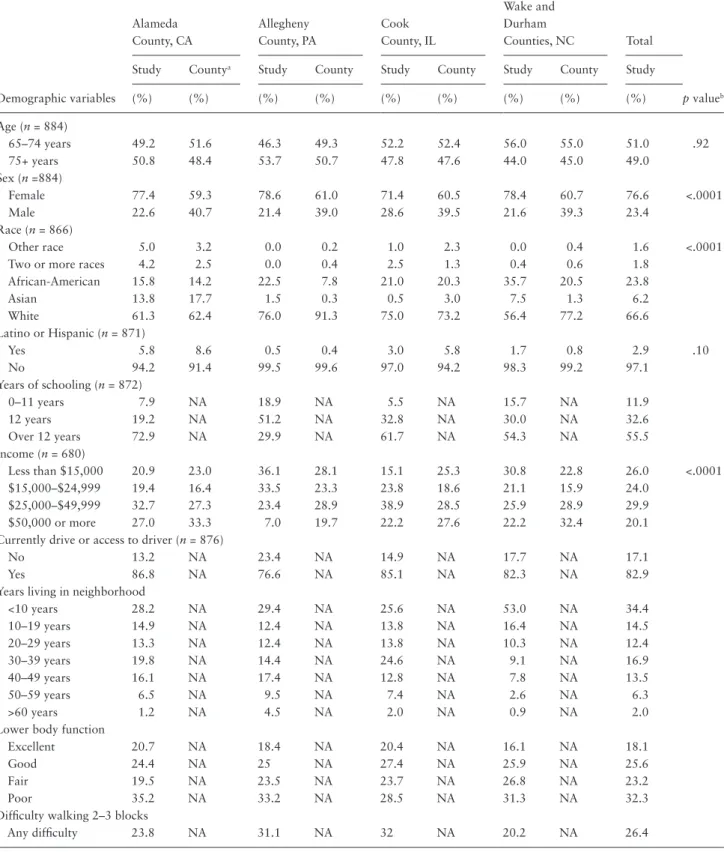
educational level, years living in neighborhood, and access to a car were categorized differently in the census data than in our interview data, so a comparison was not made. Table 1. Demographics, Lower Body Function, and Mobility Disability of Sample by Site Compared With County Census Data
Demographic variables
Alameda County, CA
Allegheny County, PA
Cook County, IL
Wake and Durham
Counties, NC Total
p valueb
Study Countya Study County Study County Study County Study
(%) (%) (%) (%) (%) (%) (%) (%) (%)
Age (n = 884)
65–74 years 49.2 51.6 46.3 49.3 52.2 52.4 56.0 55.0 51.0 .92
75+ years 50.8 48.4 53.7 50.7 47.8 47.6 44.0 45.0 49.0
Sex (n =884)
Female 77.4 59.3 78.6 61.0 71.4 60.5 78.4 60.7 76.6 <.0001
Male 22.6 40.7 21.4 39.0 28.6 39.5 21.6 39.3 23.4
Race (n = 866)
Other race 5.0 3.2 0.0 0.2 1.0 2.3 0.0 0.4 1.6 <.0001
Two or more races 4.2 2.5 0.0 0.4 2.5 1.3 0.4 0.6 1.8
African-American 15.8 14.2 22.5 7.8 21.0 20.3 35.7 20.5 23.8
Asian 13.8 17.7 1.5 0.3 0.5 3.0 7.5 1.3 6.2
White 61.3 62.4 76.0 91.3 75.0 73.2 56.4 77.2 66.6
Latino or Hispanic (n = 871)
Yes 5.8 8.6 0.5 0.4 3.0 5.8 1.7 0.8 2.9 .10
No 94.2 91.4 99.5 99.6 97.0 94.2 98.3 99.2 97.1
Years of schooling (n = 872)
0–11 years 7.9 NA 18.9 NA 5.5 NA 15.7 NA 11.9
12 years 19.2 NA 51.2 NA 32.8 NA 30.0 NA 32.6
Over 12 years 72.9 NA 29.9 NA 61.7 NA 54.3 NA 55.5
Income (n = 680)
Less than $15,000 20.9 23.0 36.1 28.1 15.1 25.3 30.8 22.8 26.0 <.0001
$15,000–$24,999 19.4 16.4 33.5 23.3 23.8 18.6 21.1 15.9 24.0
$25,000–$49,999 32.7 27.3 23.4 28.9 38.9 28.5 25.9 28.9 29.9
$50,000 or more 27.0 33.3 7.0 19.7 22.2 27.6 22.2 32.4 20.1
Currently drive or access to driver (n = 876)
No 13.2 NA 23.4 NA 14.9 NA 17.7 NA 17.1
Yes 86.8 NA 76.6 NA 85.1 NA 82.3 NA 82.9
Years living in neighborhood
<10 years 28.2 NA 29.4 NA 25.6 NA 53.0 NA 34.4
10–19 years 14.9 NA 12.4 NA 13.8 NA 16.4 NA 14.5
20–29 years 13.3 NA 12.4 NA 13.8 NA 10.3 NA 12.4
30–39 years 19.8 NA 14.4 NA 24.6 NA 9.1 NA 16.9
40–49 years 16.1 NA 17.4 NA 12.8 NA 7.8 NA 13.5
50–59 years 6.5 NA 9.5 NA 7.4 NA 2.6 NA 6.3
>60 years 1.2 NA 4.5 NA 2.0 NA 0.9 NA 2.0
Lower body function
Excellent 20.7 NA 18.4 NA 20.4 NA 16.1 NA 18.1
Good 24.4 NA 25 NA 27.4 NA 25.9 NA 25.6
Fair 19.5 NA 23.5 NA 23.7 NA 26.8 NA 23.2
Poor 35.2 NA 33.2 NA 28.5 NA 31.3 NA 32.3
Difficulty walking 2–3 blocks
Any difficulty 23.8 NA 31.1 NA 32 NA 20.2 NA 26.4
Notes: aU.S. Census 2000 data for adults 65+.
Lower Body Function, Neighborhoods, and
Walking Difficulty
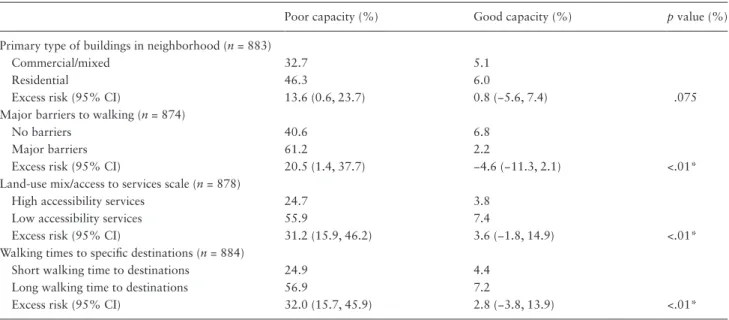
Overall, 26.4% of the respondents report difficulty in walk-ing 2–3 neighborhood blocks (mobility disability). Here, difficulty is categorized as reports of any difficulty versus no difficulty. Table 2 shows the modeled percentage of peo-ple who have difficulty in the lowest and highest quartiles of objectively measured lower body function.
Estimates of interaction were obtained from lower body function and each of the NEWS and GIS neighborhood vari-ables. Separate models were derived for each of the 17 envi-ronmental variables and their interaction with lower body function, adjusting for the covariates. Of the 17 neighbor-hood models, significant interactions (p < .20) were found for four self-report NEWS variables: Type of neighborhood buildings (commercial/mixed vs. residential), major barriers to walking (no barriers vs. major barriers), land use mix/ access to services (high accessibility to services vs. low acces-sibility to services), and walking time to specific destinations (short walking time to destinations vs. long walking time to destinations). There were no significant interactions found for lower body function and any of the GIS variables. (Table 2; Figures 1–4)
When adjusting for multiple comparisons, using the con-servative Bonferroni correction, there is still a significant interaction for three of the four interactions (lower body function interacting with major barriers, land use mix/ access to services, and walking time to specific destina-tions). However, with this correction, there is no significant interaction at p < .20 for lower body function and the per-ceived primary neighborhood building type (mixed com-mercial vs. residential). The symbol (*) is used in Table 2 to designate those tests of interaction that are still statistically significant (at p < .20) following the Bonferroni correction.
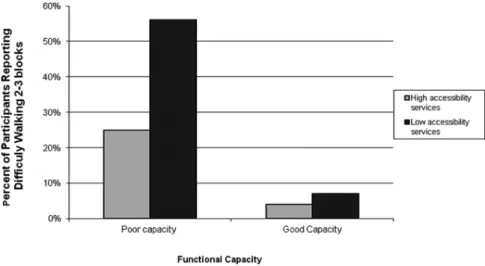
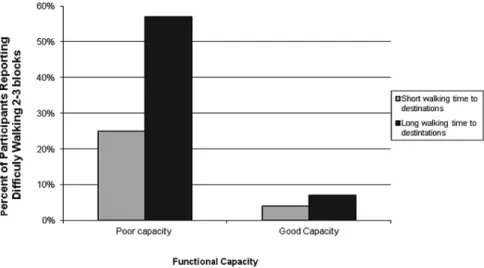
In each of the four models, people in the lowest quartile of lower body function were more likely than those in the highest quartile to report difficulty walking two to three neighborhood blocks, suggesting a main effect for capacity. Furthermore, the environment mattered more to those in the lowest quartile of lower body function. Put differently, the additive impact of perceived elements of the neighbor-hood is greatest among those with the poorest level of lower body functioning. In contrast, less than 10% of those with the best lower body functioning reported difficulty walking two to three neighborhood blocks.
Discussion
The association between reduced lower body function and reported mobility disability among older adults is moder-ated by neighborhood factors, consistent with other studies in this area (Clarke et al., 2008; Clarke et al., 2009). Among older adults with poor lower body function, those perceiv-ing their neighborhood as “walkable”, based on the number of walking destinations, time to destinations, and barriers to walking, were less likely to report mobility disability, as measured by difficulty in walking two to three neighbor-hood blocks. To recall, the interaction between lower body function and perceived primary building type (residential vs. mixed commercial) is not statistically significant at the
p < .020, based the Bonferroni correction for multiple
com-parisons. Overall, the results suggest that there is less of a mobility disadvantage experienced by older adults with poor lower body function if they reside in a neighborhood perceived by them to be more “walkable.” Among older adults with good lower body function, however, their per-ceptions of the walkability of their neighborhood, as meas-ured by the same set of factors, did not affect their reports
Table 2. Modeled Percent of People in Best and Worse Functional Capacity Categories Having Difficulty Walking Two to Three Blocks by Neighborhood Characteristics
Poor capacity (%) Good capacity (%) p value (%)
Primary type of buildings in neighborhood (n = 883)
Commercial/mixed 32.7 5.1
Residential 46.3 6.0
Excess risk (95% CI) 13.6 (0.6, 23.7) 0.8 (−5.6, 7.4) .075
Major barriers to walking (n = 874)
No barriers 40.6 6.8
Major barriers 61.2 2.2
Excess risk (95% CI) 20.5 (1.4, 37.7) −4.6 (−11.3, 2.1) <.01*
Land-use mix/access to services scale (n = 878)
High accessibility services 24.7 3.8
Low accessibility services 55.9 7.4
Excess risk (95% CI) 31.2 (15.9, 46.2) 3.6 (−1.8, 14.9) <.01*
Walking times to specific destinations (n = 884)
Short walking time to destinations 24.9 4.4
Long walking time to destinations 56.9 7.2
Excess risk (95% CI) 32.0 (15.7, 45.9) 2.8 (−3.8, 13.9) <.01*
Figure 1. Percentage of participants reporting difficulty walking two to three blocks by functional capacity by primary type of building in neighborhood.
Figure 2. Percentage of participants reporting difficulty walking two to three blocks by functional capacity by barriers to walking.
of walking disability. Those demonstrating good lower body function were unlikely to report difficulty walking two to three neighborhood blocks, regardless of their place of residence. It is clear from Figures 1–4 that lower body function is more strongly associated with reported walking difficulty than are perceived neighborhood characteristics. Second, perceived neighborhood characteristics are most meaningful as a modifier of the relatively strong associa-tion between lower body funcassocia-tion and reports of walking difficulty.
One study limitation is related to the subject population of community-dwelling older adults who were enrolled from senior-serving organizations. Accordingly, the study is not population-based, which may create bias toward the type of older adult common at such sites, including the pos-sibility that they are healthier than older adults who are not affiliated with such sites. We attempted to offset this by ensuring that our recruitment sample targeted the vari-ety of older adults at each senior center, including people who did not rate their health as good or excellent (22% of the sample rated their health as poor or fair). Our results, therefore, may not be generalizable to the entire older adult population in the United States, specifically a population that also includes more frail institutionalized older adults.
While the results of this study are also limited by a cross-sectional design, which precludes any consideration of causality, selection bias (in this case, selection of residen-tial neighborhood based on level of walking), or even the temporal nature of the associations, there are a number of strengths, which should be noted. First, this examination was not limited to older adults living in a single community. The sample of older adults is derived from people residing in four different locations in the United States. Each area reflects a distinctive geographic and climatic area. Second, lower body function is based on direct measures of performance, that is, measures of balance, lower body strength, and walking speed. Third, measures of neighborhood characteristics are based on both GIS and report. In this study, only self-reported assessments of neighborhood elements, based on
NEWS items, are associated with reports of difficulty walk-ing two to three neighborhood blocks. It is possible that the three objective GIS measures used here were too crude to measure the elements of the objective environment most important to older adults. Street-level, objective measures, such as those used for neighborhood audits may be more appropriate in this regard (Kealey et al., 2005).
the relative significance of self-reported and objective meas-ures of the neighborhood environment, including system-atic assessments of whether the interaction between these neighborhood factors and lower body function varies by the type of mobility outcome as well as the neighborhood fac-tors themselves. It is also necessary to begin to look beyond individual types of mobility, for example, walking, and begin to investigate the ease with which older adults use
combi-nations of different types of mobility, for example, walking
and driving, as part of their daily activities (Satariano et al., 2012). In the end, research of this kind will require a more precise assessment and conceptual understanding of the health effects of neighborhood residence over the life course.
Conclusion
If the results are confirmed in other, more sophisticated, lon-gitudinal studies, there are important implications for public health promotion in aging populations. Environmental inter-ventions may serve to moderate impairments, limitations, disabilities, and perhaps health care costs associated with a growing and increasingly diverse aging population. This may suggest new strategies (a) to better design neighborhoods, for example, through more informed building codes, and (b) to more effectively introduce older adults to the best fea-tures of their neighborhoods, for example, knowledge of and access to safe walking routes and other modes of mobility (Satariano et al., 2012). Finally, the results underscore the importance of the association between directly measured lower body function and self-reported difficulty in walk-ing, and thus the need to continue to improve strategies to enhance the functional capacity of individuals, perhaps lead-ing to innovative multilevel interventions that focus on both people and places (Satariano & McAuley, 2003).
Funding
This work was supported by a grant from the Robert Wood Johnson Foundation, Active Living Research Program (grant # 052515). The CDC Healthy Aging Research Network is a Prevention Research Centers program funded by the CDC Healthy Aging Program. We also used data from the RAND Center for Population Health and Health Disparities (CPHHD), which is funded by Grant 1-P50-ES012383 from the National Institute of Environmental Health Sciences.
Acknowledgments
It represents a collaboration of the CDC Healthy Aging Research Network. Efforts were supported in part by cooperative agreements from CDC’s Prevention Research Centers Program: U48-DP-000033, 001908, 000059, 001944, 000048, and 000025. The contents of this manuscript are solely the responsibility of the authors and do not necessarily represent the official views of the CDC.
References
Andresen, E. M., Malmgren, J. A., Carter, W. B., & Patrick, D. L. (1994). Screening for depression in well older adults: evaluation
of a short form of the CES-D (Center for Epidemiologic Studies Depression Scale). American Journal of Preventive Medicine, 10, 77–84. doi:10.1037/t10141-000
Balfour, J. L., & Kaplan, G. A. (2002). Neighborhood environment and loss of physical function in older adults: evidence from the Alameda County Study. American Journal of Epidemiology,
155, 507–515. doi:10.1093/aje/155.6.507
Barnes, D., Yaffe, K., Satariano, W., & Tager, I. (2003). A lon-gitudinal study of cardiorespiratory fitness and cognitive function in healthy older adults. Geriatrics, 51, 459–465. doi:10.1046/j.1532-5415.2003.51153.x
Billick, S. B., Siedenburg, E., Burgert, W. 3rd, & Bruni-Solhkhah, S. M. (2001). Validation of the Mental Alternation Test with the Mini-Mental State Examination in geriatric psychiatric inpa-tients and normal controls. Comprehensive Psychiatry, 42, 202– 205. doi:10.1053/comp.2001.23146
Bland, J. M., & Altman, D. G. (1995). Multiple significance tests: the Bonferroni method. BMJ, 310, 170. doi:10.1136/ bmj.310.6973.170
Cerin, E., Saelins, B. E., Sallis, J. F., & Frank, L. D. (2006). Neighborhood environment walkability scale: Validity and devel-opment of a short form. Medicine & Science in Sports & Medicine, 38, 1682–1691. doi:10.1249/01.mss.0000227639.83607.4d Clark, C. R., Kawachi, I., Ryan, L., Ertel, K., Fay, M. E., & Berkman,
L. F. (2009). Perceived neighborhood safety and incident mobil-ity disabilmobil-ity among elders: the hazards of poverty. BMC Public
Health, 9, 162. doi:10.1186/1471-2458-9-162
Clarke, P., Ailshire, J. A., Bader, M., Morenoff, J. D., & House, J. S. (2008). Mobility disability and the urban built environment.
American Journal of Epidemiology, 168, 506–513. doi:10.1093/ aje/kwn185
Clarke, P., Ailshire, J. A., & Lantz, P. (2009). Urban built environ-ments and trajectories of mobility disability: findings from a national sample of community-dwelling American adults (1986-2001). Social science & medicine (1982), 69, 964–970. doi:10.1016/j.socscimed.2009.06.041
Clarke, P., & George, L. K. (2005). The role of the built environment in the disablement process. American Journal of Public Health,
95, 1933–1939. doi:10.2105/AJPH.2004.054494
Dumbaugh, E. (2008). Designing communities to enhance the safety and mobility of older adults a universal approach. Journal of
Planning Literature, 23, 17–36. doi:10.1177/0885412208318559 Efron, B. (1982). The jackknife, the bootstrap and other
resam-pling plans. Philadelphia, PA: Society for Industrial and Applied
Mathematics.
Folstein, M. F., Folstein, S. E., & McHugh, P. R. (1975). “Mini-mental state”. A practical method for grading the cognitive state of patients for the clinician. Journal of Psychiatric Research, 12, 189–198. doi:10.1016/0022-3956(75)90026-6
Gomez, S. L., Glaser, S. L., McClure, L. A., Shema, S. J., Kealey, M., Keegan, T. H., et al. (2011). The California Neighborhoods Data System: a new resource for examining the impact of neigh-borhood characteristics on cancer incidence and outcomes in populations. Cancer Causes & Control: CCC, 22, 631–647. doi:10.1007/s10552-011-9736-5
Gong, Y., Gallacher, J., Palmer, S., & Fone, D. (2014). Neighbourhood green space, physical function and participation in physical activities among elderly men: the Caerphilly Prospective study.
Guralnik, J. M., Ferrucci, L., Simonsick, E. M., Salive, M. E., & Wallace, R. B. (1995). Lower-extremity function in persons over the age of 70 years as a predictor of subsequent disability. The
New England Journal of Medicine, 332, 556–561. doi:10.1056/ NEJM199503023320902
Guralnik, J. M., & Simonsick, E. M. (1993). Physical disability in older Americans. Journal of Gerontology, 48 Spec No, 3–10. doi:10.1093/geronj/48.Special_Issue.3
Guralnik, J. M., Simonsick, E. M., Ferrucci, L., Glynn, R. J., Berkman, L. F., Blazer, D. G., et al. (1994). A short physical performance battery assessing lower extremity function: association with self-reported disability and prediction of mortality and nurs-ing home admission. Journal of Gerontology, 49, M85–M94. doi:10.1093/geronj/49.2.M85
Hardy, S., Kang, Y., Studenski, S., & Degenholtz, H. (2010). Ability to walk 1/4 mile predicts subsequent disability, mortality, and health care costs. Journal of General Internal Medicine, 26, 130– 135. doi:10.1007/s11606-010-1543-2
Kealey, M., Kruger, J., Hunter, R., Ivey, S., Satariano, W., Bayles, C., …Williams, K. (2005). Engaging older adults to be more active where they live: Audit tool development. Preventing Chronic
Disease: Public Health Research, Practice, and Policy, 2, 1–2. King, D. (2008). Neighborhood and individual factors in activity in
older adults: results from the neighborhood and senior health study. Journal of Aging and Physical Activity, 16, 144–170. Krout, J. A., Cutler, S. J., & Coward, R. T. (1990). Correlates of
sen-ior center participation: a national analysis. The Gerontologist,
30, 72–79. doi:10.1093/geront/30.1.72
Lawton, M., & Nahemow, L. (1973). Ecology and the aging pro-cess. In C. Eisdorfer & M. Lawton (Eds.), The psychology of
adult development and aging (pp. 619–674). Washington, DC:
American Psychological Association.
Lawton, M. P. (1986). Environment and aging (2nd ed.). Albany, NY: Center for the Study of Aging.
Lee, I. M., & Buchner, D. M. (2008). The importance of walking to public health. Medicine and Science in Sports and Exercise, 40(7 Suppl), S512–S518. doi:10.1249/MSS.0b013e31817c65d0 Li, F., Fisher, K. J., Brownson, R. C., & Bosworth, M. (2005).
Multilevel modelling of built environment characteristics related to neighbourhood walking activity in older adults.
Journal of Epidemiology and Community Health, 59, 558–564. doi:10.1136/jech.2004.028399
Nagel, C. L., Carlson, N. E., Bosworth, M., & Michael, Y. L. (2008). The relation between neighborhood built environment and walking activity among older adults. American Journal of
Epidemiology, 168, 461–468. doi:10.1093/aje/kwn158 Nagi, S. Z. (1976). An epidemiology of disability among adults in the
United States. The Milbank Memorial Fund quarterly. Health
and society, 54, 439–467. doi:10.2307/3349677
Plouffe, L., & Kalache, A. (2010). Towards global age-friendly cities: determining urban features that promote active aging. Journal of
Urban Health: bulletin of the New York Academy of Medicine,
87, 733–739. doi:10.1007/s11524-010-9466-0
Pope, A. M., & Tarlov, A. R. (1991). Disability in America: toward
a national agenda for prevention. Washington, DC: National
Academies Press.
R Development Core Team. (2013). R: A language and environment for statistical computing. Vienna, Austria: R Foundation for Statistical Computing. Retrieved from http://www R-project.org/
Reitan, R. (1958). Validity of the Trail Making Test as an indicator of organic brain damage. Perceptual and Motor Skills, 8, 76. doi:10.2466/PMS.8.7.271-276
Rosow, I., & Breslau, N. (1966). A Guttman health scale for the aged.
Journal of Gerontology, 21, 556–559. doi:10.1093/geronj/21.4. 556
Rothman, K. J. (1990). No adjustments are needed for multiple comparisons. Epidemiology, 1, 43–46. doi:10.1097/00001648- 199001000-00010
Saelens, B. E., Sallis, J. F., Black, J. B., & Chen, D. (2003). Neighborhood-based differences in physical activity: an envi-ronment scale evaluation. American Journal of Public Health,
93, 1552–1558. doi:10.1016/j.socscimed.2009.01.017
Satariano, W. A., Guralnik, J. M., Jackson, R. J., Marottoli, R. A., Phelan, E. A., & Prohaska, T. R. (2012). Mobility and aging: new directions for public health action. American Journal of Public
Health, 102, 1508–1515. doi:10.2105/AJPH.2011.300631 Satariano, W. A., Ivey, S. L., Kurtovich, E., Kealey, M., Hubbard,
A. E., Bayles, C. M., et al. (2010). Lower-body function, neigh-borhoods, and walking in an older population. American
Journal of Preventive Medicine, 38, 419–428. doi:10.1016/j. amepre.2009.12.031
Satariano, W. A., & McAuley, E. (2003). Promoting physical activity among older adults: From ecology to the individual. American
Journal of Preventive Medicine, 25(3 Suppl. 2), 184–192. doi: 10.1016/S0749-3797(03)00183-1
Satariano, W. A., Ory, M. G., & Lee, C. (2012). Planned and built environments in public health. In T. R. Prohaska, L. A. Anderson & R. H. Binstock (Eds.), Public health for an aging society (pp. 327).
Selvin, S. (1996). Statistical analysis of epidemiological data (2nd ed., Vol. 25). New York: Oxford University Press.
Shumway-Cook, A., Patla, A., Stewart, A., Ferrucci, L., Ciol, M. A., & Guralnik, J. M. (2003). Environmental components of mobility disability in community-living older persons.
Journal of the American Geriatrics Society, 51, 393–398. doi:10.1046/j.1532-5415.2003.51114.x
Shumway-Cook, A., Patla, A. E., Stewart, A., Ferrucci, L., Ciol, M. A., & Guralnik, J. M. (2002). Environmental demands associ-ated with community mobility in older adults with and without mobility disabilities. Physical Therapy, 82, 670–681.
Simonsick, E. M., Guralnik, J. M., Volpato, S., Balfour, J., & Fried, L. P. (2005). Just get out the door! Importance of walking outside the home for maintaining mobil-ity: findings from the women’s health and aging study.
Journal of the American Geriatrics Society, 53, 198–203. doi:10.1111/j.1532-5415.2005.53103.x
VanSwearingen, J. M., & Brach, J. S. (2001). Making geriatric assessment work: selecting useful measures. Physical Therapy, 81, 1233–1252. Verbrugge, L. M., & Jette, A. M. (1994). The disablement process.
Social science & medicine (1982), 38, 1–14. doi:10.1016/0277- 9536(94)90294-1
Wang, Z., & Lee, C. (2010). Site and neighborhood environments for walking among older adults. Health & Place, 16, 1268– 1279. doi:10.1016/j.healthplace.2010.08.015