SPECTROSCOPIC MONITORING OF PROTON TRANSFER AND PROTON-COUPLED ELECTRON TRANSFER REACTIONS
Thomas T. Eisenhart
A dissertation submitted to the faculty at the University of North Carolina at Chapel Hill in partial fulfillment of the requirements for the degree of Doctorate of Philosophy in the
Department of Chemistry.
Chapel Hill 2016
iii ABSTRACT
Thomas T. Eisenhart: Spectroscopic Monitoring of Proton Transfer and Proton-Coupled Electron Transfer Reactions
(Under the direction of Jillian Dempsey)
iv
ACKNOWLEDGMENTS
Jillian: thank you for giving me the opportunity to learn from you. Thank you for making me work hard, for challenging me, and for teaching me how to think critically and creatively. I will carry the lessons I’ve learned from you into all of my future endeavors.
To the Dempsey lab (especially Brian, Robin, and Eric): thank you for your patience, your caring personalities, your knowledge, and most of all, your friendship. This was
certainly a wild journey, and it was made all the better because I got to share it with you. To my friends in the department, in particular Andrew, Dan, Guy and Melissa: I did not anticipate meeting such incredible, smart, funny, and well-rounded people when I decided to attend UNC, but I could not imagine the past few years without you. Thanks for the laughter, the jokes, the coffee, the beer, and the many, many memories. Here’s to a few more in the years to come.
To my parents: thank you for the love, support, and wisdom over the past five years. You both were always quick to listen, slow to give unwanted (but needed) advice, and eager to help in any way possible. From an early age I was given every educational opportunity, and I can’t thank you enough for instilling in me a desire to learn. And thank you Emily for being the best sister I could ever ask for!
v
TABLE OF CONTENTS
LIST OF FIGURES ... vii
LIST OF ABBREVIATIONS ... xiii
CHAPTER 1: INTRODUCTION ... 1
1.1. A Challenge to the Scientific Community ... 1
1.2. A Multifaceted Solution ... 2
1.3. Nature’s Roadmap to a Solar-Powered Future ... 3
1.4. Proton-Coupled Electron Transfer ... 5
1.5. PCET of Phenols in Non-Aqueous Solvent Environments ... 7
1.6. New Optical Methods for Monitoring PCET ... 18
1.7. References ... 22
CHAPTER 2: PHOTO-INDUCED PROTON-COUPLED ELECTRON TRANSFER REACTIONS OF ACRIDINE ORANGE: COMPREHENSIVE SPECTRAL AND KINETICS ANALYSIS... 26
2.1. Introduction ... 26
2.2. Discussion and Results ... 27
2.3. Experimental Details ... 41
2.4. Thermochemical Analysis ... 43
2.5. Details of Kinetic Modeling ... 53
vi
CHAPTER 3: PROTON-COUPLED ELECTRON TRANSFER REACTIONS WITH PHOTOMETRIC BASES REVEAL FREE ENERGY RELATIONSHIPS FOR PROTON
TRANSFER ... 61
3.1. Introduction ... 61
3.2. Results ... 64
3.3. Discussion ... 80
3.4. Conclusions ... 107
3.5. Experimental Details ... 109
3.6. Details of Kinetics Modeling ... 116
3.7. References ... 123
CHAPTER 4: EXCITED-STATE AND THERMAL PROTON TRANSFER REACTIONS OF QUINOLINE PHOTOBASES: INFLUENCES OF DRIVING FORCE, ELECTRONIC STRUCTURE AND HYDROGEN-BONDING ... 129
4.1. Introduction ... 129
4.2. Electronic Structure of Quinolines ... 131
4.3. Results and Discussion ... 132
4.4. Conclusions ... 168
4.5. Experimental Details ... 170
vii
LIST OF FIGURES
Figure 1.1. Keeling Curve ... 2
Figure 1.2. Photosynthetic Scheme. ... 4
Figure 1.3. PCET in PSII ... 5
Figure 1.4. PCET Square Scheme. ... 6
Figure 1.5. Mayer PCET Motif ... 8
Figure 1.6. Rhenium (I) tricarbonyl photosensitizers ... 11
Figure 1.7. Ru(II) photosensitizers linked to hydrogen bonded tyrosine moieties ... 13
Figure 1.8. Photoexcited rhenium complexes ... 16
Figure 2.1. PCET square scheme incorporating ground and excited state reactivity. ... 27
Figure 2.2. Spectrophotometric titration of acridine orange ... 28
Figure 2.3. Transient difference spectra of AO. ... 29
Figure 2.4. Decay of the triplet excited state of AO monitored at 560 nm. ... 30
Figure 2.5. Transient difference spectra of AO and ttbPhOH ... 31
Figure 2.6. Spectroelectrochemistry of AOH+. ... 32
Figure 2.7. Mechanism of reactivity and recombination of 3*AO + ttbPhOH. ... 33
Figure 2.8. Mechanism of reactivity for 3*AO and TEMPOH. ... 33
Figure 2.9. Decay of the triplet excited state of AOH+ in CH3CN monitored at 560 nm ... 35
Figure 2.10. Kinetics traces of AO with ttbPhOH at 560 nm ... 36
Figure 2.11. Kinetics traces of AO with ttbPhOD at 560 nm ... 37
Figure 2.12. Kinetics traces of AO with ttbPhOH at 460 nm. ... 39
Figure 2.13. Kinetics traces of µM AO with ttbPhOD at 460 nm ... 40
viii
Figure 3.1. General schematic of the PCET reaction between NH2PhOH, Fc+, and
R-7DMAQ. ... 64
Figure 3.2. General scheme of R-7DMAQs ... 65
Figure 3.3. UV-vis absorbance spectrum of TMP-7DMAQ ... 66
Figure 3.4. Absorbance spectrum Ph-7DMAQ. ... 66
Figure 3.5. Absorbance spectrum of H-7DMAQ. ... 67
Figure 3.6. Absorbance spectrum of MeO-7DMAQ ... 67
Figure 3.7. Absorbance spectrum of .TMP-7DMAQ ... 68
Figure 3.8. Spectrophotometric titration of TMP-7DMAQ with 2-picoline. ... 69
Figure 3.9. Spectrophotometric titration of MeO-7DMAQ with 2-picoline ... 70
Figure 3.10. Spectrophotometric titration of H-7DMAQ with 2-picoline ... 71
Figure 3.11. Spectrophotometric titration of Ph-7DMAQ with 2-picoline. ... 72
Figure 3.12. Absorbance spectra recorded at various time delays upon rapid mixing of NH2PhOH and Ph-7DMAQ with Fc+ ... 74
Figure 3.13. Stopped-flow kinetics traces monitoring the appearance of TMP-7DMAQH+ at 450 nm and the disappearance of Fc+ at 620 nm. ... 75
Figure 3.14. Stopped-flow kinetics traces monitoring the appearance of Ph-7DMAQH+ at 460 nm and the disappearance of Fc+ at 620 nm ... 76
Figure 3.15. Stopped-flow kinetics traces monitoring the appearance of MeO-7DMAQH+ at 460 nm and the disappearance of Fc+ at 620 nm. ... 77
Figure 3.16. Stopped-flow kinetics traces monitoring the appearance of H-7DMAQH+ at 440 nm and the disappearance of Fc+ at 620 nm.. ... 78
Figure 3.17. Stopped-flow kinetics traces monitoring the disappearance of Fc+ at 620 nm as a function of Ph-7DMAQ.. ... 79
Figure 3.18. Cyclic voltammogram of NH2PhOH ... 82
Figure 3.19. Cyclic voltammogram of NH2PhOH upon the addition of 2-picoline ... 82
ix
Figure 3.21. Spectrophotometric titration of TMP-7DMAQH+ with NH2PhOH ... 85
Figure 3.22. Spectrophotometric titration of MeO-7DMAQH+ with NH2PhOH ... 86
Figure 3.23. Spectrophotometric titration of H-7DMAQH+ with NH2PhOH ... 87
Figure 3.24. Spectrophotometric titration of Ph-7DMAQH+ with NH2PhOH. ... 88
Figure 3.25. Adduction of MeO-7DMAQ with Fc+. ... 90
Figure 3.26. Adduction of TMP-7DMAQ (with Decamethylferrocenium ... 91
Figure 3.27. Titration of TMP-7DMAQ with Fc+ ... 92
Figure 3.28. Titration of MeO-7DMAQ with Fc+ ... 93
Figure 3.29. Titration of H-7DMAQ with Fc+ ... 94
Figure 3.30. Titration of Ph-7DMAQ with Fc+. ... 95
Figure 3.31. Kinetics and accompanying fit for ET between Fc+ and NH2PhOH ... 97
Figure 3.32. Stopped-flow kinetics traces monitoring the appearance of TMP-7DMAQH+ at 450 nm and the disappearance of Fc+ at 620 nm ... 99
Figure 3.33. Stopped-flow kinetics traces monitoring the appearance of MeO-7DMAQH+ at 460 nm and the disappearance of Fc+ at 620 nm ... 100
Figure 3.34. Stopped-flow kinetics traces monitoring the appearance of H-7DMAQH+ at 440 nm and the disappearance of Fc+ at 620 nm ... 101
Figure 3.35. Stopped-flow kinetics traces monitoring the appearance of Ph-7DMAQH+ at 460 nm and the disappearance of Fc+ at 620 nm ... 102
Figure 3.36. ΔConcentration profiles from simulated kinetic traces of NH2PhOH, Fc+, NHPhOH, H-7DMAQ, NH3PhOH+, and NHPhO.. ... 104
Figure 3.37. Free Energy Relationships ... 106
Figure 4.1. Structure and UV-vis absorbance spectrum of CF3-7DMAQ and its conjugate acid CF3-7DMAQH+ ... 132
Figure 4.2. Spectrophotometric titration of CF3-7DMAQ with aniline ... 134
Figure 4.3. Steady-state luminescence and lifetime of CF3-7DMAQ ... 136
x
Figure 4.5. Normalized absorbance and emission spectrum of CF3-7DMAQH+ ... 137
Figure 4.6. Forster cycle calculations for determining the pKa* of CF3-7DMAQ. ... 138
Figure 4.7. General reaction scheme of CF3-7DMAQ and HA ... 139
Figure 4.8. Chemical structures of HA. ... 140
Figure 4.9. Static and dynamic quenching Pathways ... 141
Figure 4.10. Steady-state luminescence spectra and Stern-Volmer plot for Collidinium. ... 142
Figure 4.11. Steady-state luminescence spectra and Stern-Volmer plot for 2-Ammoniumbenzimidazole ... 143
Figure 4.12. Steady-state luminescence and Stern-Volmer plot for Benzylammonium ... 144
Figure 4.13. Steady-state luminescence spectra and Stern-Volmer plot for Isobutylammonium ... 145
Figure 4.14. Steady-state luminescence and Stern-Volmer plot for Triethylammonium ... 146
Figure 4.15. Luminescence lifetime decays and Stern-Volmer plot for Collidinium ... 148
Figure 4.16. Luminescence lifetime decays and Stern-Volmer plot for 2-Ammoniumbenzimidazole ... 149
Figure 4.17. Luminescence lifetime decays and Stern-Volmer plot for Benzylammonium 150 Figure 4.18. Luminescence lifetime decays and Stern-Volmer plot for Isobutylammonium151 Figure 4.19. Luminescence lifetime decays and Stern-Volmer plot for Triethylammonium 152 Figure 4.20. Determination of KSwith Collidnium ... 153
Figure 4.21. Determination of KSwith 2-Ammoniumbenzimidazole. ... 154
Figure 4.22. Determination of KSwith Benzylammonium ... 154
Figure 4.23. Determination of KS with Isobutylammonium ... 155
Figure 4.24. Hydrogen Bonding Illustration ... 156
Figure 4.25. Titration of collidinium with pyridine ... 157
xi
Figure 4.27. Titration of 2-ammoniumbenzimidazole with pyridine ... 158
Figure 4.28. Titration of 2-ammoniumbenzimidazole with dimethylaniline ... 158
Figure 4.29. Titration of benzylammonium with pyridine ... 159
Figure 4.30. Titration of isobutylammonium with pyridine ... 159
Figure 4.31. Titration of isobutylammonium with dimethylaniline ... 160
Figure 4.32. Titration of triethylammonium with pyridine ... 160
Figure 4.33. Titration of triethylammonium with dimethylaniline ... 161
Figure 4.34. Transient difference spectrum of CF3-7DMAQ and collidinium ... 163
Figure 4.35. Recombination of CF3-7DMAQH+ and Isobutylamine ... 164
Figure 4.36. Recombination of CF3-7DMAQH+ and Benzylamine ... 165
Figure 4.37. Recombination of CF3-7DMAQH+ and 2-Aminobenzimidazole ... 165
Figure 4.38. Recombination of CF3-7DMAQH+ and Collidine ... 166
xii
LIST OF ABBREVIATIONS
AO Acridine Orange
AOH+ Acridinium orange
B Generic Base
bpy 2,2'-bipyridine
bpz 2,2'-bipyrazine
CF3-7DMAQ 2,4-Bis(3,5-trifluoromethyl)phenyl-7-dimethlaminoquinoline CPET Concerted proton-electron transfer
DFT Density Functional Theory
ESPT Excited-state proton transfer
ET Electron Transfer
Fc Ferrocene
Fc+ Ferrocenium
GHG Green House Gas
H-7DMAQ 7-dimethlaminoquinoline
HA Generic Acid
KIE Kinetic isotope effect
MeO-7DMAQ 2,4-Bis(3,4-methoxy)phenyl-7-dimethlaminoquinoline NH2PhOH p-aminophenol
NMR Nuclear magnetic resonance
OEC Oxygen evolving complex
xiii
Ph-7DMAQ 2,4-Diphenyl-7-dimethlaminoquinoline
PT Proton Transfer
PV Photovoltaic
pyr Pyridine
pyz Pyrazine
R-7DMAQ 2,4-R-7-dimethylaminoquinoline TA Transient Absorption Spectroscopy TCSPC Time-correlated single photon counting TEMPOH 2,2′-6,6′-tetramethylpiperidine-1-ol
TMP-7DMAQ 2,4-Bis(2,3,5,6-tetramethyl)phenyl-7-dimethlaminoquinoline ttbPhOH Tri-tertbutylphenol
1
CHAPTER 1: INTRODUCTION
1.1. A Challenge to the Scientific Community
The past century has been a golden age for the scientific community. The
development of modern medicine has extended life expectancies to eighty or more years in industrialized nations. The birth of air travel has made it possible to reach every corner of planet Earth in a single day. Advances in agricultural practices continue to help the planet’s population of seven billion grow larger every day. In a nutshell, numerous scientific
advancements have made the developed world richer, smarter, and more connected than ever before. Instrumental to these developments has been access to cheap and abundant energy sources – most notably fossil fuels like oil, coal, and natural gas. It is no secret that the developed world is heavily reliant on fossil fuels to power vehicles and heat homes, but it also needs these natural resources to develop life-saving medicines, and to fertilize and harvest crops. The demand for fossil fuels has continued to increase over recent decades as the world population grown, and developing countries like China, India, and Brazil crave increasing amounts cheap energy.1 While cheap energy is beneficial to economic
2
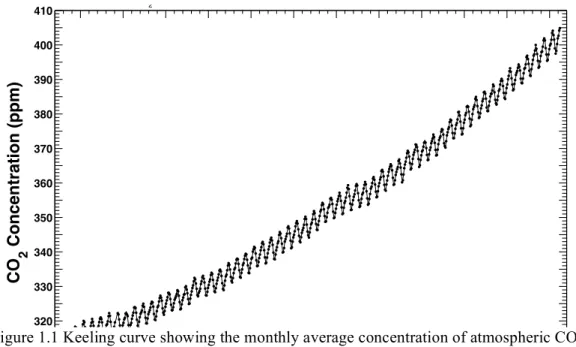
In just the past decade, atmospheric CO2 levels have passed the 400 parts per million mark for the first time in a few million years. Scientists are in overwhelming agreement that this increase in concentration of carbon dioxide (among other GHGs) is playing a role in warming the planet.1–3 Compounding this, the world’s population is estimated to grow to a level of 9 billion by 2040.1 Demand for energy, food, transportation, and medicine will only increase with population growth. A continued reliance solely on fossil fuels to meet demand for these needs will result in staggering and unpredictable environmental consequences to society. As such, the scientific community is facing a challenge of historic and
unprecedented challenge. Politics and economics will continue to dictate that fossil fuels are widely used, so the time is now for scientists to develop new technologies that force society to rethink how our world is powered – the livelihood of future generations depends on it.
1.2. A Multifaceted Solution
Though the energy and environmental challenges facing society have been well documented, strategies to develop sustainable solutions to address these challenges have been
1960 1965 1970 1975 1980 1985 1990 1995 2000 2005 2010 2015
310 320 330 340 350 360 370 380 390 400 410 Year CO 2 Concentration (ppm)
Mauna Loa Observatory, Hawaii
Monthly Average Carbon Dioxide Concentration
Data from Scripps CO2 Program Last updated April 2016
3
pursued to limited degrees of success. Wind energy has long been used to carry out work, and advances in turbine technology have allowed for the development of wind turbines that generate appreciable amounts of electricity. The conversion of biomass to useable fuels has long been touted as a potential pathway to synthesize liquid fuels from renewable feedstocks. Geothermal energy can be harvested on both small and large scales to heat water and
generate electricity. Most notably, solar photovoltaic cells (PVs), devices that convert solar photons directly to electricity, have rapidly developed in their efficiency. These advances have translated to a steep increase in adoption of this technology amongst developed and developing nations.
The continued adoption of solar technologies is particularly encouraging as the solar flux bombarding the earth each hour (4.3 x 10²⁰ J) is roughly equivalent to the energy consumed by the entire planet in one year.2 Solar energy is abundant, free, and while some geographic areas may have a larger influx, there is not a small oligarchy controlling the collection and distribution of this energy source (like the current petroleum economy). However, a downfall of current solar technologies (notably PVs) is that the electricity produced must be utilized immediately. Storage of this energy is not currently viable using traditional battery storage methods. While research is being carried out to develop efficient and robust batteries that can operate on the large scale necessary, another storage approach has developed that draws inspiration from the natural world: storing solar energy in chemical bonds of fuels.
1.3. Nature’s Roadmap to a Solar-Powered Future
4
sunlight to drive the oxidation of water and reduction of carbon dioxide to produce oxygen and store energy in the form of carbohydrates (Figure 1.2).
Figure 1.2. Schematic representing green plants’ use of solar energy to catalyze the transformation of water and carbon dioxide into oxygen and carbohydrates.
Not only does nature provide insight into storing solar energy in chemical bonds, it demonstrates this process using H2O and CO2 as reactants. Both of these inputs are cheap and abundant, thus their utilization as reactants for a renewable fuel process is of great interest to the scientific community.4–9 Both CO2 and H2O are highly stable molecules, meaning the photosynthetic reactions involving these substrates do not proceed spontaneously and thus require an input of energy to be carried out. The full equation and thermodynamic potential for water oxidation in aqueous solution is shown below as an example (Equation 1.1). Equation 1.1
In nature, H2O oxidation is carried out in Photosystem II (PSII), with the process beginning in chlorophyll P680. Chlorophyll P680 absorbs a photon and quickly undergoes
H
2
O & CO
2
O
2
& C
6
H
12
O
6
5
electron transfer (ET) to a nearby pheophytin molecule to generate a powerful oxidant P680●+. A nearby tyrosine (YZ) is oxidized by P680●+, with proton-transfer (PT) from YZ to Histidine 190 (His190) coupled to this ET reaction (Figure 1.3).
Oxidized, deprotonated YZ then goes on to oxidize the oxygen evolving complex (OEC), a cluster of four manganese ions and one calcium ion that carries out the actual water oxidation event, regenerating YZ upon reprotonation by His190. This process of photon absorption and coupled ET and PT steps must be completed four times before the OEC has the necessary oxidative strength to fully oxidize two equivalents of H2O. In the case of photosynthesis, the protons released are used to regenerate NADPH; however, in a solar fuels device, these protons could be used for a number of fuel forming reactions. The efficient reduction of protons to H2 would generate a storable fuel, or the coupling of CO2 reduction to proton transfer could potentially generate valuable feedstocks like formic acid, methanol, or methane. Developing either of these potential strategies would be a significant achievement in developing new energy technologies.10–12
1.4.Proton-Coupled Electron Transfer
A defining characteristic of water oxidation is the movement of multiple protons and electrons. Reactions of this type, appropriately referred to as proton-coupled electron
transfer (PCET) reactions, were first described in 1981 by T.J. Meyer, and have been widely
P
680 Yz OH NNH
His190
e-H+
6
investigated over the past few decades.13–16 PCET reactions are generally described using a square scheme (Figure 1.4) where the PCET process can proceed through three different mechanisms. The first two are stepwise mechanisms where either initial ET is followed by PT, or vice versa (edges of the square scheme). Conversely, in a concerted proton-electron transfer (CPET) reaction, both the proton and electron move in a single kinetic step, avoiding possible high-energy, charged intermediates (diagonal).
Figure 1.4. Square scheme denoting the three pathways for a single proton-coupled electron transfer event. The outside of the square shows the stepwise pathways, ET-PT or PT-ET, while the diagonal shows the concerted pathway, CPET.
PCET reactions are vital to important reactions like water oxidation and proton reduction, and thus a comprehensive understanding of PCET is desired. For any particular PCET reaction, that understanding involves elucidating the mechanism of reactivity, developing a thermodynamic picture of the system, and extracting relevant kinetic
information about the process. Further, using that knowledge to understand which parameters control PCET is vital to the development of technologies relying on these reactions, in
7
parameters governing PCET reactivity are not easy tasks as the current techniques employed to study these reactions rarely give a comprehensive picture of the reaction of interest.17,18
1.5. PCET of Phenols in Non-Aqueous Solvent Environments
PCET is a massive field that covers a variety of substrates and solvent systems (aqueous vs. non-aqueous, for example).16,17,19,20 As such, the scope of the studies discussed here includes PCET as it relates to phenols (and phenol derivatives) in non-aqueous solvents. Phenols are often used in PCET studies as they are structural models for biologically relevant PCET reactions that involve tyrosine; YZ in PSII is a notable example.7 They are also used because the sterics and electronics of phenols can be easily tuned, and phenoxyl radicals (the PCET product of phenols) are moderately stable with spectroscopic signatures in the visible region.16,17 These reactions are often coupled to stopped-flow rapid-mixing21–25 and laser flash photolysis methods.26–32 Electrochemistry is also widely utilized,33–38 and can be especially useful as a complementary technique to time-resolved measurements. There are also a few groups making valuable contributions to the field using theoretical and
computational methods.14,18,39–41 In this subset of PCET, studies have focused on
understanding how a few important variables affect both the rate and mechanism of PCET: how does the overall driving force affect the reaction, what effect does hydrogen bonding have on PCET, and how does PT/ET distance affect the overall PCET process?
8
Figure 1.5. General motif used by Mayer to study PCET in phenols hydrogen-bound to a nearby amine. Oxidation of the phenol, ET, (usually by a chemical oxidant, A+) generates an acidic phenol radical cation that undergoes PT to the nearby amine. Figure adapted with permission.42
An early publication using this motif examined how driving force affects the PCET reactivity of one of the aforementioned hydrogen bonded phenol-amine compounds.42 Five nitrogen-based oxidants of varying strength were used, and kinetic isotope effects (KIEs) and
thermochemical arguments suggested a CPET mechanism for all oxidants used. A plot of the rate of ET versus driving force was fit with the adiabatic Marcus equation (Equation 1.2), yielding a large intrinsic barrier of λ = 34 kcal mol-1.
Equation 1.2
𝑘 = 10!!∗exp[(𝜆+∆𝐺°)! 4𝜆𝑘!𝑇 ]
This large barrier is similar to what that observed by Hammarström and co-workers for an aqueous system involving the oxidation of a tyrosine tethered to Ru(bpy)32+ (λ = 55 kcal mol -1).46 In both cases, this large kinetic barrier is overcome by the fact that the possible stepwise intermediates are charged, high-energy species, favoring the CPET mechanism.
This was followed by one of the first detailed analyses of bi-directional CPET.47 Using various chemical oxidants, three substituted-phenols containing differing pendant amines (imidazole, pyridine, primary amine – all of the same general motif in Figure 1.5) exhibited CPET behavior upon mixing (KIEs and thermochemical arguments were used to support this assignment). This reaction was also well-described by the adiabatic Marcus
tBu tBu
O NH2
H
tBu tBu
O NH2
H
PCET
9
equation, and it was noted that large intrinsic barriers to CPET cause CPET rate constants to be slower than those for simple ET reactions in organic systems with comparable driving forces. Most interestingly, the authors observed that varying the structure of the proton acceptor had a drastic effect on the rate of CPET, even though the driving force was the same across the three molecules studied.
In another example examining how driving force influences PCET reactivity, Mayer
et al. synthesized seven phenol-amine compounds, where the amine was an imidazole with various electron donating and withdrawing substituents.45 The initial goal was to influence the nature of the hydrogen bond between phenol and amine by varying the electronics of the amine, and to determine whether this affected PCET reactivity. As previously seen, all seven compounds react via CPET upon mixing with a chemical oxidant. However, the rate of CPET correlated only with the driving force for reactivity. This is in contrast to the
previously described paper where the driving force was the same, but rate of CPET varied as the structure of the proton acceptor was changed.43 The authors note that comparing reactions at similar driving forces allows one to observe “more subtle effects of structure and
substituent effects on other features of CPET.”45
Mayer has also used the phenol-amine motif (Figure 1.5) to investigate how varying the proton-donor acceptor distance can affect the rate of PCET.22 Using two amino-phenols with differing proton acceptors – one a traditional primary amine, the other an amino-indanol – PCET occurs in concerted fashion as similarly describe in the aforementioned studies. The amino-indanol has a PT distance between 0.13 – 0.16 Å greater than that of the phenol-amine, and simple tunneling and kinetic models predict this longer donor distance to
10
is observed for the rate of CPET (1.4 – 2.8 x 10⁴ M-1s-1). Because multiple parameters (not just PT distance) are affected by the change in proton acceptor, this study highlights the complexity of PCET reactions and associated challenges of controlling them.
In another example of distance effects in thermal PCET, Mayer et al. synthesized a ruthenium terpyridine-4’-carboxylate complex containing 11.2 Å of separation between the carboxylate anion and the ruthenium center.48 The oxidized Ru(III) form of this complex was isolated, and stopped-flow rapid-mixing was used to initiate PCET with the hydrogen atom donor TEMPOH. TEMPOH reduced Ru(III) to Ru(II) and transferred a proton to the carboxylate anion in a bidirectional PCET process. Despite the fact that electrochemical experiments show no communication between the ruthenium and carboxylate ligand (the pKa of the molecule does not change with oxidation state of the ruthenium), this reaction
proceeds via CPET mechanism as confirmed by thermodynamic analysis and KIEs. Rates for this reaction were compared to that of a similar ruthenium molecule containing a 6.9 Å distance from metal to carboxylate, and it was found that this shorter molecule, even though it has a smaller driving force for the same PCET reaction with TEMPOH, occurred a
thousand times faster than the longer PCET reaction. This study highlights nicely how PCET can be highly distance dependent.
11
Figure 1.6. Rhenium (I) tricarbonyl photosensitizers with appended 2,6-di-tert-butylphenol moieties, linked via p-xylene linkers (n = 0 – 3). Upon excitation, the phenol is oxidized by rhenium with proton transfer to solvent (1:1 H2O/CH3CN) coupled to the oxidation. Figure used with permission.31
When no p-xylene linker is present, excitation induces the release of the phenolic proton, meaning the n = 0 dyad behaves like a photoacid, with no ET observed. For the n = 1 dyad, the excited complex is quenched via ET from the phenol to rhenium center with no KIE observed for ET. A phenoxyl radical is spectroscopically observed via transient
absorption spectroscopy (TA), providing direct evidence for PT (and it was determined this PCET process occurs via stepwise ET-PT. The n = 2 dyad exhibits a similar quenching rate via ET as the n = 1 dyad, however no phenoxyl radical is observed in this case. This study nicely highlights that strongly coupled donor-acceptor systems exhibit different PCET reactivity as compared to weakly coupled donor-acceptor systems.
12
spectral and thermodynamic evidence support this molecule reacting like a photoacid without coupled electron transfer to the ruthenium center. The n = 1 dyad is thought to react through initial PCET, forming Ru(I) and phenoxyl radical, with subsequent ET from ruthenium to the phenoxyl moiety. The activation energies for the PCET reactions for these two complexes differ by an order of magnitude, and it is thought that this difference gives rise to the variations in reactivity. This study highlights the difficulties in observing PCET
photoproducts while demonstrating again how PCET reactivity can vary when the coupling between donor-acceptor is varied.
Because long-range PCET is an important component of PSII, a thorough understanding of the parameters governing the long-range movement of protons and electrons is an important step in developing a better understanding of PCET.50 To begin untangling this problem, a Ru(bpz)32+ (bpz = 2,2’-bipyrazine) complex with a bpz containing one p-xylene spacer bound to a cyanophenol was excited and subsequent PCET reactivity monitored using TA spectroscopy. At first glance this molecule appears to act as a photoacid, as the phenolate anion signal is observed within 2 µs of excitation – this would be consistent with similar studies where no p-xylene linker was present.31,49 However, a KIE of 2.0 is determined, and this is used as evidence for initial CPET (too fast to detect photoproducts), followed by rapid back ET (from Ru(I) to phenoxyl radical). This reactivity was compared to that of a similar complex, one containing an unsubstituted phenol moiety, and while the same photoproducts were observed, no KIE was detected. The authors suggest that the
13
electron-withdrawing group can affect the mechanism by which an excited-state PCET process occurs, even when the electron-withdrawing group is some distance from the electron acceptor.
Combining some of the work done by Mayer and Wenger, Hammarström synthesized a series of four ruthenium – tyrosine complexes that undergo intramolecular PCET and have varying PT distances (Figure 1.7).51
Figure 1.7 Ru(II) photosensitizers linked to hydrogen bonded tyrosine moieties. Upon excitation of Ru(II), methyl viologen is used to oxidatively quench the excited state and generate a Ru(III) species. Ru(III) initiates PCET via ET from tyrosine to Ru(III) and PT to pendant amine. Figure used with permission.51
14
Wenger et al. follow up on this work by Hammarström with two studies that again use ruthenium compounds containing phenol moieties that are tethered through p-xylene linkers. In the first example,52 complexes with n = 1 – 3 p-xylene linkers are used, and upon excitation, the photosensitizer initiates CPET with ET occurring from phenol to ruthenium, and PT occurring to a pyrolidine base in solution. By varying the number of p-xylene linkers, the distance for the ET component of PCET is increased, and TA was used to monitor how varying this distance affects the rate for the PCET process. The overall reaction was
determined to proceed via CPET, and the rates were comparable to similar studies of simple ET.52 Importantly, a value of β = 0.67 ± 0.23 Å-1 for this bidirectional PCET process was determined from this data. This is similar in magnitude to that of simple electron tunneling across oligo-p-spacers,53 and provides an initial suggestion that a distance dependence for rates of CPET are not significantly steeper than typical ET rates.
The second study again used a Ru(bpy)32+–phenol dyad linked via p-xylene linkers, but now methyl viologen was used as an external quencher and imidazole as a proton acceptor. Ru(bpy)32+ is excited and rapidly oxidatively quenched to form a Ru(III) species. PCET then occurs, with ET occurring from phenol to Ru(III) and PT to imidazole. This process was determined to occur via CPET, and another distance decay constant was determined for CPET. In this case β = 0.87 ± 0.09 Å-1, which is one of the largest values determined for ET across materials of this nature. This provides a second data point regarding the effect distance has on the rate of bidirectional CPET.
15
have touched on hydrogen bonding and the role it can play in solution, other studies have solely focused on the role hydrogen bonding can play in PCET.
Mayer and co-workers investigated how the strength of a hydrogen bond in
pyridylphenols affects the rate of CPET.44 Two phenol-amine compounds were used in this study. The first was a phenol with pendant pyridine directly linked to the phenol, and the second phenol contained a pendant pyridine linked via methylene spacer. This methylene spacer breaks conjugation between pyridine and phenol, and crystallographic evidence suggests the pyridine ring twists out of plane when H-bonding to phenol, making the O--N distance 0.13 Å greater for the compound with the methylene spacer. The CPET reaction for these two compounds was monitored, and the species without a spacer reacts 25-150x faster (depending on the oxidant) than the compound containing the spacer, even though the proton acceptor is the same in both molecules. Rates for the spacer-containing compound were comparable to those of a phenol-primary amine compound (also not conjugated to the phenol), suggesting the nature of the base in this example is not important. The authors conclude that conjugation has a marked effect on the nature of the hydrogen bond, which is reflected in the rates of CPET.
Similar complexes were also utilized by Wenger to begin studying how hydrogen bonding between phenols and pyrazine can affect the favorability of either ET or PT in a PCET reaction. Using two rhenium (I) tricarbonyl diimine complexes, containing a
16
Figure 1.8. Photoexcited rhenium complexes containing (left) a bipyrazine and pyridine ligand (to favor PT, disfavor ET), and (right) a bipyridine and pyrazine ligand (to disfavor PT, favor ET). Figure used with permission.30
In the case of the bpz-py complex, MLCT excitation occurs towards the bpz ligand, to which p-cyanophenol is hydrogen bound. The increased electron density on the bpz ring makes PT favorable, but ET to Re(II) less favorable. Conversely, MLCT excitation of the bpy-pyz complex occurs towards the bpy ligand. Because p-cyanophenol is hydrogen bonded to pyz in this scenario, ET can more easily occur to the rhenium center, while PT is less favored. TA was used to observe the photoproducts, and in both cases a PCET reaction occurs. Both are most likely to occur via CPET, however, a PT-ET pathway cannot be completely ruled out. The most interesting aspect of this study is the fact that bimolecular rate constants for quenching of the rhenium compounds are on the same order of magnitude. It appears that in this particular case, it does not matter whether the MLCT process occurs towards or away from the protonatable ligand, PCET still occurs at roughly the same rate (2.0 – 3.6 x 10⁷ M-1 s-1 depending on the complex analyzed and optical technique used).
17
examples of hydrogen bonding, and what the current best practices are for measuring and accounting for this parameter. Three methods have traditionally been employed to quantify this technique. Consider Equation 1.3 where species HA and B can hydrogen bonded in solution.
Equation 1.3
The first method uses UV-vis absorption spectroscopy to quantify the amount of hydrogen bonding. Assuming HA has a strong ground-state absorbance feature in the UV-vis spectrum, species B should either not have any appreciable absorbance features, or it should absorb in a different region of the spectrum from the peak of interest. Beginning with a solution of just HA, UV-vis spectroscopy should be used to monitor the shift of the HA absorbance feature as known concentrations of species B are titrated into solution. This is comparable to a spectrophotometric titration,23,32 and is highlighted in a seminal PCET paper by Linschitz et al.54 This technique becomes challenging however, when peaks overlap or there is no absorbance shift upon addition of HA to B.
The second method uses steady-state luminescence quenching to quantify the amount of hydrogen bonding. This method was first proposed in 2007 to quantify a proposed excited-state hydrogen bonding adduct that was not present in the ground excited-state.55 It has subsequently been used in a variety of PCET papers,56,57 however this method has recently come under scrutiny.52
The final technique uses nuclear magnetic resonance (NMR) to quantify hydrogen bonding between two species. By monitoring the chemical shift for the acidic proton on HA while adding increasing amounts of B, an association constant can be extracted by plotting
18
the chemical shift against the concentration of B added. This has been used successfully to quantify the extent of hydrogen bonding and is the recommended method for doing so if experimental conditions allow.12,58,59
1.6. New Optical Methods for Monitoring PCET
Stopped-flow rapid-mixing coupled with optical monitoring, TA spectroscopy, and electrochemistry are all well understood and valuable techniques for studying PCET reactions. They complement one another well and have served as the tools for much of the advancement in the field. However, a shortcoming that prevails throughout these techniques, and the chemistry exploited while using them, is that few PCET processes can be directly monitored in their entirety. That is to say, observing both the ET and PT components of a PCET reaction is no easy task. This is largely due to the fact that electron movement is much easier to monitor than proton movement. With stopped-flow spectroscopy, an electron transfer event is typically observed by monitoring the disappearance of the visible
19
to drive the transformation of small molecules, like H2O, into energy rich fuels, developing methods that can study excited-state PCET processes would be particularly valuable. Very few of the studies described above (and in the broader context of all PCET research) have been able to study excited-state PCET reactions, leading to a lack of understanding of these processes when comparing what is known about their thermal counterparts. As such, the studies described within seek to develop new methods for studying both ET and PT, particularly in the excited state, in order to gain insight to aid in the development of solar fuels technologies.
In the following chapters, this dissertation will describe the use of a commercially available N-heterocycle to initiate and monitor an excited-state PCET reaction, as well as a series of molecules that have been developed to monitor PT reactions in both the ground-state and excited-ground-state. The first study described centers around acridine orange (AO), a commercially available N-heterocycle that displays a red-shifted visible absorbance feature upon protonation.32 TA was used to monitor the reactivity of AO when excited in the presence of tri-tert-butylphenol (ttbPhOH). Spectral evidence, supported by
spectroelectrochemistry and thermochemical calculations, clearly showed that excited AO reacts with ttbPhOH to form acridinium orange radical (AOH●) via excited-state CPET. Recombination was observed to occur via ET-PT, and again the spectroscopic evidence was supported by thermochemical calculations. Rates for each of the processes were determined by monitoring kinetics at specific wavelengths, rounding out a comprehensive spectral and kinetic picture of the reaction between AO and ttbPhOH.
20
optical probes for PT reactions. These molecules are particularly useful for this type of reactivity because upon protonation, the UV-visible absorbance of these R-7DMAQs undergoes a significant red-shift, providing an excellent spectroscopic handle for optically monitoring PT. By varying the substituent at the 2- and 4- positions, the electronics of each R-7DMAQ are changed, providing both spectroscopic and pKa tunability. Dubbed
“photometric bases,” four of these molecules were used in stopped-flow studies to monitor PT, while the decay of the absorbance of the chemical oxidant (used to initiate PCET by oxidizing p-aminophenol) was used to monitor the ET step. The rate of PT showed a dependence on the pKa of the conjugate acid of the R-7DMAQ employed, which could be explained by either transition state theory or by Marcus-type nonadiabatic PT.
The fifth of these R-7DMAQs was used as a photosensitizer for excited-state proton transfer (ESPT) reactions. The conjugate acid of
2,4-bis(3,5-trifluoromethyl)-7-dimethlaminoquinoline (CF3-7DMAQ) has a pKa = 11.5 in acetonitrile. Upon excitation, CF3-7DMAQ becomes much more basic; it’s conjugate acid has an excited-state pKa = 17.7. Using two types of time-resolved spectroscopy, CF3-7DMAQ was excited in the presence of a series of acids with pKa’s ranging from 15.0 – 17.9, and both the forward and back PT were monitored. The forward PT reaction was observed by monitoring quenching of the
fluorescence of CF3-7DMAQ (30 ns lifetime). TA was also used to monitor forward PT as the growth of the conjugate acid of CF3-7DMAQ is easily observed at 490 nm.
21
hydrogen bonding in order to explain the observed rate constants for the forward process, and provide insight into the role hydrogen bonding plays in static quenching processes.
By studying the PT component in all of these systems, a few trends have become clear. In the case of acridine orange, monitoring the PT component of the reaction allowed for direct detection of the PT product in an excited state PCET reaction, and the
determination that recombination for this system occurred in stepwise ET-PT fashion. Using photometric bases to monitor PT in stopped-flow studies also provided a complete picture of the mechanism for this PCET process, but also was critical in observing a free energy
relationship between the rate of PT and driving force for reactivity. Lastly, monitoring PT in the excited state provided another example of a free energy relationship for PT reactions, and also key insight into the effect hydrogen bonding can have on an excited state process.
This work described in this dissertation aims to develop new methods for monitoring PT and PCET for the purpose of extracting relevant kinetic information regarding PCET reactions. By using N-heterocycles whose optical signatures shift upon a change in
22 REFERENCES (1) Agency, I. E. World Energy Outlook 2015; 2015.
(2) Lewis, N. S.; Nocera, D. G. Proc. Nat. Acad. Sci. USA2006, 103 (43), 15729. (3) Pales, J. C.; Keeling, C. D. J. Geophys. Res.1965, 70 (24), 6053.
(4) Hammarström, L.; Styring, S. Energy Environ. Sci.2011, 4 (7), 2379.
(5) Carra, C.; Iordanova, N.; Hammes-Schiffer, S. J. Am. Chem. Soc.2003, 125 (34), 10429.
(6) Magnuson, A.; Berglund, H.; Korall, P.; Hammarström, L. J. Am. Chem. Soc.1997,
119 (Ii), 10720.
(7) Mayer, J. M.; Rhile, I. J.; Larsen, F. B.; Mader, E. A.; Markle, T. F.; DiPasquale, A. G. Photosynth. Res.2006, 87 (1), 3.
(8) Svensson, B.; Etchebest, C.; Tuffery, P.; van Kan, P.; Smith, J.; Styring, S.
Biochemistry1996, 35 (46), 14486.
(9) Artero, V.; Fontecave, M. Chem. Soc. Rev.2013, 42 (6), 2338.
(10) Rountree, E. S.; McCarthy, B. D.; Eisenhart, T. T.; Dempsey, J. L. Inorg. Chem.2014,
53 (19), 9983.
(11) Dempsey, J. L.; Winkler, J. R.; Gray, H. B. J. Am. Chem. Soc.2010, 132 (47), 16774. (12) McCarthy, B. D.; Martin, D. J.; Rountree, E. S.; Ullman, A. C.; Dempsey, J. L. Inorg.
Chem.2014, 53 (16), 8350.
(13) Robert A. Binstead; Bruce A. Moyer; Samuels, G. J.; Thomas J. Meyer. J. Am. Chem. Soc.1981, 103, 2897.
(14) Hammes-Schiffer, S. J. Am. Chem. Soc.2015, 137, 8860. (15) Costentin, C. Chem. Rev.2008, 108 (7), 2145.
(16) Weinberg, D. R.; Gagliardi, C. J.; Hull, J. F.; Murphy, C. F.; Kent, C. a; Westlake, B. C.; Paul, A.; Ess, D. H.; McCafferty, D. G.; Meyer, T. J. Chem. Rev.2012, 112 (7), 4016.
23
(19) Costentin, C.; Robert, M.; Savéant, J.-M. Chem. Soc. Rev.2010, 110.
(20) Kaila, V. R. I.; Verkhovsky, M. I.; Wikström, M. Chem. Rev.2010, 110 (12), 7062. (21) Manner, V. W.; Dipasquale, A. G.; Mayer, J. M. J. Am. Chem. Soc.2008, 130, 7210. (22) Markle, T. F.; Rhile, I. J.; Mayer, J. M. J. Am. Chem. Soc.2011, 133, 17341.
(23) Saouma, C. T.; Kaminsky, W.; Mayer, J. M. J. Am. Chem. Soc.2012, 134, 10. (24) Warren, J. J.; Mayer, J. M. J. Am. Chem. Soc.2008, 130 (9), 2774.
(25) Bourrez, M.; Steinmetz, R.; Ott, S.; Gloaguen, F.; Hammarström, L. Nat. Chem.2015,
7 (2), 140.
(26) Zhang, M.-T.; Hammarström, L. J. Am. Chem. Soc.2011, 133 (23), 8806.
(27) Sjödin, M.; Irebo, T.; Utas, J. E.; Lind, J.; Merényi, G.; Akermark, B.; Hammarström, L. J. Am. Chem. Soc.2006, 128 (40), 13076.
(28) Johannissen, L. O.; Irebo, T.; Sjödin, M.; Johansson, O.; Hammarström, L. J. Phys. Chem. B2009, 113 (50), 16214.
(29) Gagliardi, C. J.; Westlake, B. C.; Kent, C. A.; Paul, J. J.; Papanikolas, J. M.; Meyer, T. J. Coord. Chem. Rev.2010, 254 (21-22), 2459.
(30) Bronner, C.; Wenger, O. S. Inorg. Chem.2012, 51 (15), 8275.
(31) Kuss-Petermann, M.; Wolf, H.; Stalke, D.; Wenger, O. S. J. Am. Chem. Soc.2012, 134
(30), 12844.
(32) Eisenhart, T. T.; Dempsey, J. L. J. Am. Chem. Soc.2014, 136 (35), 12221.
(33) Costentin, C.; Drouet, S.; Passard, G.; Robert, M.; Savéant, J.-M. J. Am. Chem. Soc. 2013, 135, 9023.
(34) Costentin, C.; Hajj, V.; Louault, C.; Robert, M.; Savéant, J.-M. J. Am. Chem. Soc. 2011, 133 (47), 19160.
(35) Savéant, J.-M. Energy Environ. Sci.2012, 5 (7), 7718.
(36) Costentin, C.; Robert, M.; Savéant, J.-M.; Teillout, A.-L. Proc. Natl. Acad. Sci. U. S. A.2009, 106 (29), 11829.
24
(38) Alligrant, T. M.; Hackett, J. C.; Alvarez, J. C. Electrochim. Acta2010, 55 (22), 6507. (39) Hammes-Schiffer, S. Energy Environ. Sci.2012, 5 (7), 7696.
(40) Hammes-Schiffer, S.; Stuchebrukhov, A. A. Chem. Rev.2010, 110 (12), 6939. (41) Skone, J. H.; Soudackov, A. V; Hammes-schiffer, S. J. Am. Chem. Soc.2006, 128
(16), 16655.
(42) Rhile, I. J.; Mayer, J. M. J. Am. Chem. Soc.2004, 126 (40), 12718.
(43) Rhile, I. J.; Markle, T. F.; Nagao, H.; Dipasquale, A. G.; Lam, O. P.; Lockwood, M. A.; Rotter, K.; Mayer, J. M. J. Am. Chem. Soc.2006, 128, 6075.
(44) Markle, T. F.; Mayer, J. M. Angew. Chemie - Int. Ed.2008, 47 (4), 738.
(45) Markle, T. F.; Markle, T. F.; Rhile, I. J.; Rhile, I. J.; Dipasquale, A. G.; Dipasquale, A. G.; Mayer, J. M.; Mayer, J. M. Proc. Natl. Acad. Sci.2008, 105, 8185.
(46) Sjodin, M.; Hammarström, L. J. Am. Chem. Soc.2000, 122, 3932.
(47) Rhile, I. J.; Markle, T. F.; Nagao, H.; Dipasquale, A. G.; Lam, O. P.; Lockwood, M. A.; Rotter, K.; Mayer, J. M. J. Am. Chem. Soc.2006, 128, 6075.
(48) Manner, V. W.; Mayer, J. M. J. Am. Chem. Soc.2009, 131 (29), 9874. (49) Kuss-Petermann, M.; Wenger, O. S. J. Phys. Chem. A2013, 117 (28), 5726. (50) Bronner, C.; Wenger, O. S. Phys. Chem. Chem. Phys.2014, 16 (8), 3617.
(51) Zhang, M.; Irebo, T.; Johansson, O.; Hammarström, L. J. Am. Chem. Soc.2011, 133
(34), 13224.
(52) Chen, J.; Kuss-Petermann, M.; Wenger, O. S. Chem. A Eur. J.2014, 20, 4098. (53) Wenger, O. S. Chem. Soc. Rev.2011, 40 (7), 3538.
(54) Biczok, L.; Gupta, N.; Linschitz, H. J. Am. Chem. Soc.1997, 119 (51), 12601. (55) Concepcion, J. J.; Brennaman, M. K.; Deyton, J. R.; Lebedeva, N. V; Forbes, M. D.
E.; Papanikolas, J. M.; Meyer, T. J. J. Am. Chem. Soc.2007, 129, 6968. (56) Bronner, C.; Wenger, O. S. J. Phys. Chem. Lett.2012, 3, 70.
25
26
CHAPTER 2: PHOTO-INDUCED PROTON-COUPLED ELECTRON TRANSFER REACTIONS OF ACRIDINE ORANGE: COMPREHENSIVE SPECTRAL AND
KINETICS ANALYSIS
Reprinted with permission from Eisenhart, T.T. and Dempsey, J.L. Photo-induced Proton-Coupled Electron Transfer Reactions of Acridine Orange: Comprehensive Spectral and Kinetics Analysis. J. Am. Chem. Soc., 2014, 136, 12221-12224. © 2014 American Chemical Society.
2.1. Introduction
Proton-coupled electron transfer (PCET) processes are central to the conversion of small molecules to energy-rich fuels.1,2 Harvesting solar energy to achieve these challenging transformations is an increasingly attractive option as the need for alternative energy
resources becomes more pressing. Investigation of PCET in biological systems and in
molecular models provides a general understanding of PCET processes between molecules in their electronic ground states,1–6 but comparatively little is known about PCET reactions of electronically excited molecules.7–9 In response, we are undertaking mechanistic studies to provide a comprehensive understanding of excited-state PCET reactions. Rationalizing how to integrate light absorption and H+/e- transfer will facilitate the design of new systems that can effectively couple energy capture and conversion.
A great deal of research has focused on the thermal PCET reactions of phenol substrates, in part because of the importance of tyrosine radicals in biological systems such as photosystem II and ribonucleotide reductase.1,2,4,5,10 As a result, the PCET
27
information to excited-state reduction potentials (obtained via modified Latimer diagrams12,13) and excited-state pKa values (determined from Förster cycles14,15), a thermochemical picture of excited-state PCET reactions can be developed.8
Figure 2.1 PCET square scheme incorporating ground and excited state reactivity.
2.2. Discussion and Results
28
3*AO can react with ttbPhOH through a concerted pathway or one of several stepwise PCET reaction pathways (Figure 2.1). The strong absorption features of AO (λmax = 425 nm, ε = 25,000 M-1 cm-1) and the corresponding acridinium (AOH+, λmax = 495 nm, ε = 62,500 M-1 cm-1) provide spectroscopic handles for determining the AO protonation states; the oxidation states of these species can also be assessed optically. Analysis of the transient absorption (TA) spectra and corresponding kinetics traces provides a complete picture of the light-induced PCET oxidation of phenol and the subsequent thermal reaction.
Figure 2.2 Spectrophotometric titration of acridine orange was used to determine the pKa in CH3CN. AO was first completely protonated with 1 equivalent of HBF4·Et2O before being titrated with additions of triethylamine (pKa =18.3). An absorbance spectrum was obtained before and after protonation, and after every addition of Et3N. The pKa of AO (pKa =19.3) was determined using the method of Saouma et al.3
29
triplet excited state of (3*AO) and a bleach centered at 435 nm due to the loss of the ground state AO absorption.
Figure 2.3. Transient difference spectra of 40 µM AO in CH3CN at selected time delays after laser excitation. λex = 425 nm, 0.1 mM [Bu4N][PF6].
These transient features decay non-exponentially: 3*AO undergoes first-order decay through a nonradiative process (knr), reacts through a triplet-triplet interaction (kTT) to
30
Figure 2.4 Decay of the triplet excited state of AO monitored at 560 nm in CH3CN (line) and the corresponding simulated spectrum (markers). Rate constants determined from the simulation and the values previously determined in water at pH 12:4 knr (300 s-1, lit: 300 s-1), kTT (5.3 × 10⁹ M-1 s-1, lit: 5.5 × 10⁹ M-1 s-1), kS (1.0 × 10⁸ M-1 s-1, lit: 3 × 10⁸ M-1 s-1). kAOH was determined independently (4.0 × 10⁴ s-1). 40 µM AO, λex = 425 nm, λobs = 560 nm, 0.1 M [Bu4N][PF6].
31
recorded in the time interval 4–100 µs are dominated by the growth of a prominent feature at 495 nm, which is consistent with production of AOH+.
32 Figure 2.6 Spectroelectrochemistry of 40 µM AOH+ in CH
3CN. Optical spectra of AOH+ were recorded in a spectroelectrochemical cell as applied potentials were stepped to increasingly negative values (hold time = 3 s). Bleaching of the characteristic AOH+ absorption feature (λ
max = 495 nm) is accompanied by growth of a new feature at 425 nm, which we assign to the product of direct reduction, AOH•.5 A clean isosbestic was not observed, suggesting that AOH+ is not cleanly converted to the acridinium radical, AOH•. This observation is consistent with the irreversibility observed in CV experiments (Figure S9). Based on the molar extinction coefficient for AOH+ (ε = 18,000 M-1 cm-1), we estimate a lower limit for ε(AOH•) of 6,500 M-1 cm-1. Spectra were recorded with a honeycomb platinum working electrode (Pine Instruments), a platinum counter electrode and a Ag pseudo-reference electrode. We were unable to reference the applied potentials directly to
ferrocene with this electrochemical cell. As such, these spectra are referenced only to the silver pseudoreference (Ag+/0) and the results are qualitative, not quantitative.
For comparison, we also explored excited-state PCET reactivity of AO in the presence of 2,2′-6,6′-tetramethylpiperidine-1-ol (TEMPOH), a well-documented PCET reagent that favors CPET over stepwise mechanisms.11 As for ttbPhOH, added TEMPOH quenches the triplet absorbance features of AO at 410 and 540 nm (Figure 2.5). The
33
Optical detection of discrete intermediates aids evaluation of H+/e– transfer mechanisms for reactions between 3*AO with ttbPhOH or TEMPOH. The mechanisms indicated in Figure 2.7and Figure 2.8 are consistent with the spectral evidence for reaction intermediates. 3*AO is quenched by CPET from both ttbPhOH and TEMPOH to form ttbPhO• and TEMPO•, respectively, along with AOH•. This reactivity is presumed to occur through a hydrogen-bonded encounter complex, consistent with previous reports of photo-induced PCET reactions in organic solvents.21–23
Figure 2.7 Mechanism of reactivity and recombination of 3*AO + ttbPhOH.
34
After formation of the excited-state CPET products, thermal back-PCET ensues to yield the ground state reactants. Thermochemical analysis (Section 2.5) indicates that ET-PT and CPET processes are both reasonable pathways for the reaction of ttbPhO• and AOH•
because they circumvent high energy intermediates (in contrast, initial PT has Δ𝐺!"° = 49.9 kcal mol-1).
Spectral observation of the initial ET product (AOH+) indicates the reaction proceeds via the stepwise ET–PT pathway. Specifically, the AOH• formed by excited-state CPET is a moderate reductant which can reduce ttbPhO• (Δ𝐺!"° = –20.8 kcal mol-1) and accordingly, ET from AOH• to ttbPhO• proceeds to form AOH+ and ttbPhO–, detected by the decay of the transient AOH• signal and the appearance of the AOH+ absorption feature. Similar reactivity was noted for reactions of phenyl thiyl radical with 9-mesityl-10-methylacridinium; the former acts as an oxidant in a photoredox catalysis scheme.24 The products of this sequential excited-state CPET–thermal ET sequence are equivalent to a net-PT process, reminiscent of reactivity proposed for ruthenium–phenol dyads.21,25,26 Subsequently, AOH+ and ttbPhO– recombine via PT to form the ground state reactants, detected by the decay of the AOH+ signal.
By contrast, the thermal back-PCET reaction of AOH• and TEMPO• proceeds via CPET to form the ground state reactants in the time interval 1–100 µs. This assignment is consistent with both spectral observations and the thermochemical preference of TEMPO• to react via CPET pathways (Δ𝐺!"#$° = –21.7 kcal mol-1, Δ𝐺
35
The spectral profiles of the AO-derived intermediates allows for detailed kinetics analyses. The quenching of 3*AO by ttbPhOH was monitored by single wavelength TA at 560 nm (Figure 2.10). Quenching is enhanced with increasing concentrations of ttbPhOH, but the excited-state decay is non-exponential. A kinetics model (based on Figure 2.7) accounting for the intrinsic decay pathways of AO was used to describe the photo-induced PCET reaction scheme between AO and ttbPhOH and subsequent thermal reactivity. Intrinsic reactivity of 3*AO (above) is described by rate constants k
nr, kTT, and kS, respectively. The presence of trace amounts of AOH+ in solution is accounted for by the independently measured rate constant kAOH (4 × 10⁵ s-1), which describes the relaxation of 3*AOH+ (Figure 2.9).
Figure 2.9. Decay of the triplet excited state of AOH+ in CH3CN monitored at 560 nm. Kinetics were fit with a single exponential decay to yield kAOH = 40,000 s-1. 40 µM AOH+, λex = 495 nm, λobs = 560 nm, 0.1 M [Bu4N][PF6].
36
constants for these processes were determined from kinetics traces recorded at 460 nm and are discussed below.
Figure 2.10. Kinetics traces (lines) of 40 µM AO with 0–1000 µM ttbPhOH in CH
3CN and the simulated spectra (markers). λex = 425 nm, λobs = 560 nm, 0.1 M [Bu4N][PF6].
37
constants independently determined (knr, kTT, kS, kAOH) for intrinsic decay processes were fixed at these values in order to give the most accurate rate constants for the other processes.
The second-order rate constant determined for excited-state CPET is 3.7 × 10⁸ M-1 s-1.
The analogous reaction for 3*AO and ttbPhOD is slightly slower (kCDET = 2.9 × 10⁸ M-1 s-1, KIE = 1.3) (Figure 2.11).
Figure 2.11. Kinetics traces (lines) of 40 µM AO with 0–1000 µM ttbPhOD in CH3CN and the
simulated spectra (markers). knr (300 s-1), kTT (5.3 × 10⁹ M-1 s-1), kS (1.0 × 10⁸ M-1 s-1), kCDET (2.9 × 10⁹ M-1 s-1), k
ET (5.5 × 10⁹ M-1 s-1), kAOH (4.0 × 10⁴ s-1). 40 µM AO, λex = 425 nm, λobs = 560 nm, 0.1 M [Bu4N][PF6].
38
luminescence quenching experiments.21–23 Interpreting hydrogen bonding in the context of kinetics analysis is the focus of ongoing study.
These kinetic details, coupled with thermochemical analysis (Section 2.5), support the proposed forward CPET, reverse ET–PT reaction sequence. An activation energy (ΔG‡) in the range of +9.9–11.2 kcal mol-1 can be estimated from the kCPET (based on the range of [ttbPhOH] investigated).11 Quenching of 3*AO by ttbPhOH via an ET pathway is inconsistent with this barrier (Δ𝐺!"° = +23.1 kcal mol-1). If PT from ttbPhOH to 3*AO is not accompanied by excited-state deactivation (3*AOH+ is formed initially, then subsequently relaxes to form AOH+), initial PT has a negligible barrier (Δ𝐺!"° = +1.6 kcal mol-1). Alternatively, if PT is coupled to excited-state deactivation of 3*AO, the free energy change for PT (Δ𝐺!"° = –47.6 kcal mol-1) indicates this pathway is highly exergonic, though the organic framework does not offer a clear mechanism for coupling relaxation.28 However, for both of these initial PT pathways, the subsequent ET reaction between AOH+ and ttbPhO– to form the net PCET products observed spectroscopically is substantially endergonic (Δ𝐺!"° = +20.8 kcal mol-1), inconsistent with the observed ΔG‡. Further, the large positive Δ𝐺!"° for the PT–ET pathway
suggests that the excited-state PT intermediates AOH+ and ttbPhO– should be detectable, but they are not observed. Rather, consistent with transient spectral measurements and the estimated barrier, 3*AO is quenched by CPET (Δ𝐺!"#$° = –26.8 kcal mol-1) from ttbPhOH to form ttbPhO• and acridine radical AOH•.
39
Figure 2.12. Kinetics traces (lines) of 20–80 µM AO with 500 µM ttbPhOH in CH3CN and the simulated spectra (markers). λex = 425 nm, λobs = 460 nm, 0.1 M [Bu4N][PF6].
Simulations of these kinetics traces per the model described above provides
additional insight into the subsequent thermal ET and PT steps – ET from AOH• to ttbPhO• (kET) and PT from AOH+ to ttbPhO– (kPT). In this analysis, rate constants knr, kTT,kS, kAOH, and kCPET determined from simulations of 560 nm kinetics traces were fixed. The rate constant for kET is diffusion limited (5.5 × 10⁹ M-1 s-1), consistent with the 900 mV driving force for ET
(𝛥𝐺!"° = –20.8 kcal mol-1), and no KIE is observed, as expected.11 Recombination of AOH+
and ttbPhO– via PT occurs with a rate constant of 1.0 × 10⁹ M-1 s-1, consistent with the large
40
Figure 2.13. Kinetics traces (lines) of 30–90 µM AO with 500 µM ttbPhOD in CH
3CN and the
simulated spectra (markers). knr (300 s-1), kTT (5.3 × 10⁹ M-1 s-1), kS (1.0 × 10⁸ M-1 s-1), kCDET (2.9 × 10⁹ M-1 s-1), k
ET (5.5 × 10⁹ M-1 s-1), kPT (1.0 × 10⁹ M-1 s-1), kAOH (4.0 × 10⁴ s-1, see Figure S5). 40 µM AO,
λex = 425 nm, λobs = 460 nm, 0.1 M [Bu4N][PF6].
2.3.Conclusions
In summary, we found that 3*AO reacts with ttbPhOH and TEMPOH via an excited-state CPET pathway. Excited-excited-state CPET reactions of 3*AO have not, to our knowledge, been previously observed. The ensuing reactivity of the CPET products is dictated by the thermodynamics of the respective systems—AOH• reduces ttbPhO• but is not a potent enough reductant to reduce TEMPO•. Importantly, the unique spectroscopic signatures of the
reactants, intermediates and products enabled us to monitor each step of the photo-initiated and subsequent thermal reactions. The spectral evidence for the aforementioned reactivity is supported by kinetics modeling, thermochemical arguments and H/D KIEs. This
41
intimate coupling of light absorption with both proton and electron transfer. Harnessing this light-driven reactivity will pave new avenues to solar fuel production.
2.4.Experimental Details
All solutions for electrochemical or transient absorption analysis were prepared in a nitrogen-filled glovebox. The acetonitrile used (Fisher Sci, HPLC, >99.9%) was degassed with argon and dried with a Pure Process Technology Solvent System. Reagents were purchased from Aldrich, with the exception of TEMPO• (2,2,6,6-Tetramethylpiperidine 1-oxyl, Chem-Impex Intl.). Acridine Orange was purified by dissolving in methanol and precipitating with 0.1 M NaOH before drying in vacuo and storing under inert atmosphere. Despite purification, trace amounts of acridinium were still detected in optical spectra. ttbPhOH was dried in vacuo and stored under an inert atmosphere. ttbPhOD1 and TEMPOH2 were prepared according to literature procedures. Tetrabutylammonium hexafluorophosphate was recrystallized from absolute ethanol, dried in vacuo, and stored under inert atmosphere. Triethylamine and tetrafluoroboric acid diethyl ether complex were degassed via the freeze-pump-thaw method (three cycles) and stored under inert atmosphere.
42
(L900). The LP920 was equipped with a multigrating detection monochromator outfitted with a Hamamatsu R928 photomultiplier tube (PMT) in a noncooled housing and a gated charge-coupled device (CCD) (Princeton Instruments, PI-MAX3) such that detection was software selectable. Single-wavelength transient absorption kinetics were monitored with the PMT (10 ns fwhm impulse response function, reliable data out to 400 µs, 300-900 nm) and recorded with a Tektronix TDS-3032C oscilloscope. The gated CCD was used for recording transient spectra covering the entire visible region (400-850 nm, 3 nm spectral bandwidth) at a given time after excitation (10 ns gate width). Data were the result of averaging 40-100 laser shots. Data were collected at room temperature (295 ± 3 K). All samples for transient absorption measurements were prepared in rigorously dry acetonitrile solutions with 100 mM [Bu4N][PF6]. Samples were placed into 10 mm path length quartz cuvettes and isolated from atmosphere with a Teflon valve.
43
2.5.Thermochemical Analysis
Table 2.1. Reduction Potentials in CH3CN
Species E°′ (V vs. Fc+/0)
Reference
AO0/– ~ –2.4 This work
AOH+/• ~ –1.6 This work
AO3*/– 0.18 This work
AOH3*+/• 0.53 This work
ttbPhOH•/– –0.70 30
ttbPhOH•+/0 1.18 30
TEMPO•/– –1.95 30
TEMPOH•+/0 0.71 30
Table 2.2. pKa in CH3CN
Species pKa Reference
AOH+ 19.3 This work AOH• 33.4 This work
ttbPhOH 28 30
ttbPhOH•+ –3 30
TEMPOH 41 30
TEMPOH•+ –4 30
Table 2.3. E00 values in CH3CN
Species E00 (eV) E00 (kcal/mol) Reference
AOH+ 2.13 49.2 31
44
E00 values for 3*AO and 3*AOH+
The E00 (S0→T) for AO has not been measured; but the E00 (S0→T) for AOH+has been experimentally determined.31
E00 (AOH+→3*AOH+) = +2.13 eV
From this value, the excited state reduction potential of acridinium triplet can be determined from the equation below.32,33
E°´(AOH3*+/•) = E°´(AOH+/•) + E00(AOH+) = +0.53 V vs. Fc+/0
By evaluating the electron transfer quenching of the triplet excited states of AO and AOH+, Volgelmann has estimated the difference in reduction potentials of 3*AO and 3*AOH+.11
ΔE°´ = E°´(AOH3*+/•) – E°´(AO3*/–) = +0.35 eV
From this value, the excited state reduction potential of the acridine orange triplet can be estimated. 3*AO is a very weak excited-state oxidant
E°´(AO3*/–) = +0.18 V vs. Fc+/0
From this value and the experimentally determined E°´(AO0/–) value , the acridine orange E00 (S0→T) value can be estimated with the equation below.
E°´(AO3*/–) = E°´(AO0/–) + E
00
45
ΔG° for proton transfer reactions30
ΔG!"° =−RTln 𝐾
! = 2.303RT p𝐾! = 1.37kcal mol!! p𝐾! @ 298 K
XH → X– + H+ ΔG° = (1.37 kcal mol–1) pKa(XH) YH → Y– + H+ ΔG° = (1.37 kcal mol–1) pKa(YH) XH + Y–→ YH + X– ΔG° = –(1.37 kcal mol–1) [pK
a(YH) –pKa(XH)]
ΔG° for electron transfer reactions30
ΔG!"° =−F𝐸°= −(23.06 kcal mol!! V!!)𝐸°
Y + e– ⇌ Y– ΔG°= –(23.06 kcal mol–1 V–1) E°(Y0/–) X+ + e–⇌ X ΔG°= –(23.06 kcal mol–1 V–1) E°(X+/0)
X + Y ⇌ X+ + Y– ΔG°= –(23.06 kcal mol–1 V–1) [E°(Y0/–) E°(X+/0)]
ΔG° for CPET reactions were calculated per Hess’s Law, as shown below.
Calculation of Excited State pKa for AOH+
The Förster cycle was utilized to estimate the pKa of 3*AOH+ (pKa*).35-37
p𝐾!−p𝐾!∗ =E!! AOH! −E!! AO
2.303RT =