ORIGINAL ARTICLE
The composition of the zebrafish intestinal microbial
community varies across development
W Zac Stephens
1,5,6, Adam R Burns
2,6, Keaton Stagaman
2, Sandi Wong
3,4, John F Rawls
3,
Karen Guillemin
1and Brendan JM Bohannan
21Institute of Molecular Biology, University of Oregon, Eugene, OR, USA;2Institute of Ecology and Evolution,
University of Oregon, Eugene, OR, USA;3Department of Molecular Genetics and Microbiology, Duke University, Durham, NC, USA and4Department of Microbiology and Immunology, University of North Carolina at Chapel Hill, Chapel Hill, NC, USA
The assembly of resident microbial communities is an important event in animal development; however, the extent to which this process mirrors the developmental programs of host tissues is unknown. Here we surveyed the intestinal bacteria at key developmental time points in a sibling group
of 135 individuals of a model vertebrate, the zebrafish (Danio rerio). Our survey revealed stage-specific
signatures in the intestinal microbiota and extensive interindividual variation, even within the same developmental stage. Microbial community shifts were apparent during periods of constant diet and environmental conditions, as well as in concert with dietary and environmental change. Interindividual variation in the intestinal microbiota increased with age, as did the difference between the intestinal microbiota and microbes in the surrounding environment. Our results indicate that zebrafish intestinal microbiota assemble into distinct communities throughout development, and that these communities are increasingly different from the surrounding environment and from one another.
The ISME Journal(2016)10,644–654; doi:10.1038/ismej.2015.140; published online 4 September 2015
Introduction
Animal development occurs in a dynamic microbial world. The resulting associations between animals and microbes profoundly influence the maturation of their tissues and the function of adult organs. In particular, the development of the vertebrate diges-tive tract, which harbors the vast majority of microbial cells in the body, is strongly influenced by the presence and composition of the gut micro-biota (Bateset al., 2006; Olszaket al., 2012; Semova et al., 2012; Sommer and Bäckhed, 2013). A comprehensive description of animal develop-ment must, therefore, include not only a catalog of the birth, specification and differentiation of the animal cells that comprise the body but also the associated microbial cells (McFall-Ngaiet al., 2013). Here we present a comprehensive survey of the intestinal microbiota of a single large sibling group (sibship) of the model vertebrate zebrafish (Danio rerio) throughout development.
Our study spanned major milestones in zebrafish development under common laboratory rearing conditions. Zebrafish are fertilized externally; there-fore, developmental stages are often referenced as time post fertilization, with larval stages and beyond referred to in terms of days post fertilization (d.p.f.). Zebrafish embryos initially develop in essentially sterile chorions and the larval stage begins when the organism hatches from its chorion and first encoun-ters microbes in its external environment (between 2 and 3 d.p.f.). By the time of hatching, most of the larva’s organs have been specified but will continue to grow and mature into the adult structures in interaction with associated microbes. This includes the maturation of the intestine, which is open to the surrounding environment between 3 and 4 d.p.f., allowing exposure to microbial colonists (Bates et al., 2006). At ~ 5 d.p.f., the yolk becomes depleted and larval zebrafish begin ingesting food. The development and differentiation of zebrafish con-tinues into adulthood. Although juveniles of both sexes have ovary-like gonads, they differentiate into sex-specific gonads by ~ 4 weeks post fertilization and continue to develop secondary sex character-istics well into adulthood (~10–12 weeks post fertilization depending on the rearing conditions; Uchidaet al., 2002). Initially, the ability of the host to defend against microorganisms is limited to innate immune activities, with the adaptive immune system reaching functional maturity around 4 weeks
Correspondence: WZ Stephens, Department of Pathology, University of Utah, 15 North Medical Drive, Salt Lake City, UT 84112, USA.
E-mail: [email protected]
5Current address: Department of Pathology, University of Utah, Salt Lake City, UT, USA.
6These authors contributed equally to this work.
post fertilization. Many of the attributes that make zebrafish an excellent model for studying vertebrate development, such as its early optical transparency, small size, high-fecundity and availability of genetic and genomic resources (Howeet al., 2013; Phillips and Westerfield, 2014), also lend it to studies of vertebrate host–microbiota interactions. Large num-bers of zebrafish can be maintained in a shared and easily sampled aquatic environment, allowing a high degree of biological replication along with informa-tion from associated environmental microbial communities.
The large degree of biological replication that is possible with zebrafish is an important advantage in understanding the extensive interindividual varia-tion observed in vertebrate-associated microbiota (Friswell et al., 2010; The Human Microbiome Project Consortium, 2012; Rogers et al., 2014). Interindividual variation in humans is greatest during early stages of infant colonization and decreases with age, while bacterial diversity within individuals generally increases from initial coloniza-tion at birth, stabilizing around 2–3 years of age (Palmer et al., 2007; Yatsunenko et al., 2012; Avershinaet al., 2014). During this period, weaning marks a dramatic transition for the developing infant microbiota as dietary change, the removal of mater-nally provided immunologic factors and loss of breastfeeding-derived microbes begins to shift the intestinal microbiota towards an adult-like composi-tion (Bergström et al., 2014). Thus, changes in diet and physiology over animal development are closely intertwined and likely interact to shape develop-mental changes in the associated microbiota.
In the present study, we exploit the advantages of the zebrafish model system to determine how associated microbial communities change along with key developmental, environmental and dietary tran-sitions of the host. Ours is the largest study to date of vertebrate intestinal microbiota from a single sibship of animals throughout development. We observed stage-specific changes in microbiota composition over development. Within each developmental stage, there remained extensive interindividual variation, despite the fact that the hosts belonged to a single sibship and shared the same rearing conditions and environments. Across development, we observed that the intestinal bacterial commu-nities became increasingly different among indivi-dual hosts and distinct from the surrounding environment.
Materials and methods
Experimental design and sample collection
We surveyed the gut microbiota of a pair of adult zebrafish parents and 135 of their offspring reared concurrently under identical environmental condi-tions at multiple stages in their development, using high throughput sequencing of the 16S rRNA gene.
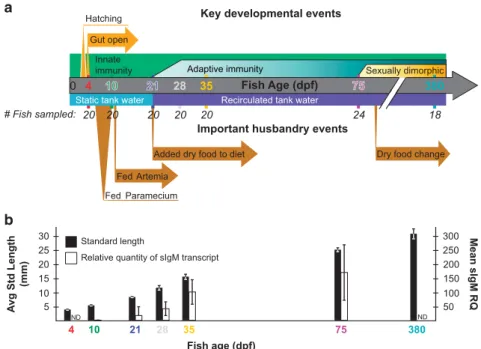
To reduce potential effects of host genotypic varia-tion, this population consisted solely of offspring from a single mating pair. These siblings were split evenly among four replicate tanks, resulting in 70 fish per tank, and were raised in a manner intended to generally reflect commonly used zebrafish hus-bandry practices, including diet and water type, flow rate and frequency of changes (Figure 1a, lower portion; details in Supplementary Information). We sampled zebrafish and their surrounding tank envir-onment at multiple time points meant to capture important developmental transitions: when the entire intestinal tract is first open and microbial colonization of the lumen first occurs (4 d.p.f.), once fish must rely on ingesting food for nutrition (10 d.p.f.), the maturation of the adaptive immune system (21, 28 and 35 d.p.f.), sexual maturity and dimorphism (75 d.p.f.), and senescence (380 d.p.f.; Figure 1a, upper portion). At each time point, we sampled the dissected intestines of multiple fish sampled evenly across each of the four replicate tanks, resulting in 20 fish (five per tank) per time point for ages 4 through 35 d.p.f., 24 fish (six per tank, three male and three female) at 75 d.p.f., and 18 fish (six per each of three replicate tanks) at 380 d.p.f. (Figure 1a; some samples were later removed owing to poor sequen-cing depth). We also measured the standard length (SL) of each fish as a metric of zebrafish staging and growth (Parichy et al., 2009). To examine the maturation of the adaptive immune system, we measured transcript levels of secreted immuno-globulin M (sIgM; Supplementary Information) from the carcasses of the 10, 21, 28, 35 and 75 d.p.f. fish (time points spanning the course of immune matura-tion). Both SL and sIgM transcript levels increased with development (Figure 1b). Within a given age, there was much greater variation in sIgM transcript levels than in SL, which showed little variation until the last time point.
Intestinal and environmental samples were col-lected and prepared in a manner that minimizes cross-contamination of samples, tanks and time points. Sampled animals from each time point were collected from the fish facility before they were fed, at approximately the same time of day (between 0930 and 1000 h). Animals were then transported to dissection stations in their own tank water and euthanized by the addition of tricaine (2.1 ml of 0.4% tricaine per 50 ml fish water; 0.22μm filtered) before dissection. Each animal was dissected on a separate, sterile glass slide (larva) or Petri dish cover (juvenile, adults) under a dissecting microscope as previously described (Milligan-Myhre et al., 2011). Larval and juvenile fish dissections were performed using individual-use insect pins, while sterile, individual-use scalpels were used for adult fish. The entire intestine from immediately posterior to the esophagus to the vent was removed intact. The swim bladder and liver were explicitly removed from the intestine, whereas no effort was made to remove the pancreas (if attached). The intestines
were then placed in 2 ml screw cap tubes containing 0.1 mm zirconia–silica beads (Biospec Products, Bartlesville, OK, USA) and 200 (4, 10, 21 d.p.f.) or 400μl (28 d.p.f. and older) of Enzymatic lysis buffer (ELB; Tris-EDTA pH 8.0 with 0.1% v/v Triton X-100; 0.22μm filter sterilized) before freezing in liquid N2
and subsequent DNA extraction (as detailed in the Supplementary Information). The remaining carcass (without intestine, swim bladder, liver and likely the pancreas) of each fish was stored in TRIzol (Life Technologies, Carlsbad, CA, USA) at −80 °C for further host RNA extraction and quantification of sIgM transcripts. For each sample age group, DNA extractions were performed on the same day as dissection.
Environmental samples collected at each time point included scrapings from two glass slides each (75 mm × 25 mm) that were affixed to the bottom (all time points) and sides (28, 35 and 75 d.p.f. time points only) of tanks at the beginning of the study, as well as food samples and 500 ml of water per tank. Water samples were filtered through a 0.2μm cellulose nitrate filter, which was then exposed to bead beating and DNA extraction from the filter using the same method used for the other samples. Poor DNA extraction efficiency or low number of sequences obtained from several of the environmen-tal samples led to the retention of environmenenvironmen-tal samples from 4, 10 and 75 d.p.f. time points only in this study. We also measured multiple environmental parameters from each tank, including temperature, pH, and ammonia, nitrite and nitrate concentrations
(Supplementary Table 1), but these were all found to vary too little over the course of the study to provide explanatory power. Thus, discrete diet changes and a single environmental change from static water in a nursery facility to recirculating water in an adjacent main facility were the only measured environmental variables that appreciably varied between time points.
All zebrafish experiments were conducted in conformity with the Public Health Service Policy on Humane Care and Use of Laboratory Animals using standard protocols approved by the Institu-tional Animal Care and Use Committees of the University of Oregon and the University of North Carolina at Chapel Hill.
Illumina library preparation and 16S rRNA gene sequence analysis
The microbial communities of individual samples were characterized by Illumina (San Diego, CA, USA) sequencing of 16S rRNA gene amplicons. To obtain Illumina compatible amplicons that were amenable to a high degree of multiplexing, we used a two-step PCR method to add dual indices and Illumina adapter sequences to the V4 region of the bacterial 16S rRNA gene (see Supplementary Information for details and Supplementary Table 2 for oligonucleotide sequences) and obtain paired-end 150 nucleotide reads on the Illumina HiSeq 2000 platform (see Supplementary Table 1 for the sample naming convention used in Illumina 16S rRNA gene
Static tank water Recirculated tank water
0 4
Key developmental events
Fish Age (dpf)
Added dry food to diet
380 75
10 21 28 35
Hatching
Innate
immunity Adaptive immunity
Gut open
Sexually dimorphic
Fed Artemia
Important husbandry events
Fed Paramecium
A
v
g Std Length
(mm)
50 100 150 200 250 300
5 10 15 20 25
30 Mean sIgM RQ
ND
Standard length
Relative quantity of sIgM transcript
ND
4 10 21 28 35 75 380
Fish age (dpf)
# Fish sampled: 20 20 20 20 20 24 18
Recirculated tank water
Dry food change
Figure 1 Experimental design and zebrafish development. (a) Experimental design showing important developmental events (top) and
husbandry events (bottom) during the course of the study. The number of fish initially sampled among four tanks at each time point is shown, although post-sequencing rarefaction in some cases reduced this number for analyses (see Materials and Methods). Artemia are commonly called brine shrimp. Four and 10 d.p.f., fish are considered larvae, 21–35 d.p.f. fish are juveniles and 75 and 380 d.p.f. fish are adults. (b) The mean standard length and secreted IgM (sIgM) transcript levels (a proxy for adaptive immune development) of fish at sampled time points are shown with standard deviations. d.p.f., days post fertilization; ND, not determined.
sequencing). Illumina sequence reads have been deposited under the NCBI SRA accession number SRP047327.
The 16S rRNA gene Illumina reads were processed using methods implemented by mothur 1.28.0 (Schloss et al., 2009) and QIIME 1.6.0 (Caporaso et al., 2010) as detailed in the Supplementary Information. The final operational taxonomic unit (OTU) table was rarefied to a depth of 4250 sequences per sample, allowing us to retain all but seven (one each from 21, 28, 35 and 75 d.p.f. groups and three from 380 d.p.f. group discarded owing to low sequence depth) of the originally collected fish intestinal samples in subsequent analyses. Rarefaction curves showed that at this high depth of sampling, we were able to sample a large portion of the OTUs (defined using 97% sequence similarity) and diversity present while still retaining a large number of samples within fish of a given age (Supplementary Figure 1).
Diversity measures and statistical tests
All measures of community diversity and similarity, including OTU richness, phylogenetic diversity, Simpson’s index and unweighted UniFrac distances, were calculated in R (R Core Team, 2014) using the vegan(Oksanenet al., 2013), picante(Kembelet al., 2010), and GUniFrac (Chen et al., 2012) packages. Permutational multivariate analysis of variance tests were performed using theadonis function from the veganpackage. Phylogenetic diversity was measured as the total shared branch length of OTUs within each community (Faith, 1992). Tests for unimodality were done using Hartigans’dip test for unimodality (Hartigan and Hartigan, 1985). Identification of significant differences in relative abundances in bacterial classes or KEGG (Kyoto Encyclopedia of
Genes and Genomes) functional groups among age groups was accomplished using the Kruskal–Wallis test with the Benjamini–Hochberg FDR correction. Discriminatory analysis of taxonomic groups among zebrafish ages was performed with LEfSe (Segata et al., 2011).
Results
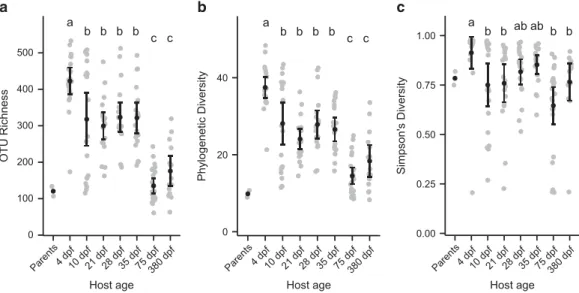
Zebrafish development is marked by major shifts in the dominant bacterial taxa of the intestinal microbiota We set out to characterize the zebrafish intestinal microbiota over key developmental time points under standard laboratory rearing conditions, including diet and environment changes during larval and early juvenile stages. Diet and environ-ment were held constant during late juvenile and an early adult stage (75 d.p.f.), whereas a late adult stage (380 d.p.f.), after a facility diet change, was added to compare adult microbiota of aged fish (Figure 1). Over the course of zebrafish development, the diversity of observed intestinal microbiota decreased significantly, both in terms of the number of OTUs (Figure 2a; r2= 0.19, Po1 × 10−7), and phylogenetic
diversity (Figure 2b;r2= 0.15, Po1 × 10−5), with the
largest changes occurring between 35 and 75 d.p.f., during which time diet and environment were held constant but the fish experienced major develop-mental changes, such as sexual differentiation. The evenness of communities, however, remained rela-tively constant over host development (Figure 2c; P= 0.288). We did not observe significant differences in diversity between the stages of adult fish. We noticed that the 10 d.p.f. samples appeared to be bimodally distributed with respect to taxa richness, with half of the samples having high richness and half low. We explicitly tested the unimodality of
a
b b b b c c
a
b b b b c c
ab a
b b ab b b
Figure 2 Significant changes in diversity of individual zebrafish intestinal communities throughout development. (a) Number of
observed taxa. (b) Faith’s phylogenetic diversity. (c) Simpson’s diversity index. Black circles and error bars represent the means and 95% confidence intervals, respectively. Letters above age groups indicate significant differences in the means.
each distribution, and found that only the 10 d.p.f. distribution was significantly non-unimodal (Harti-gans’ dip statistic D= 0.1336, P= 0.002 for 10 d.p.f. samples and P440.1 for all the other age groups). Although there was no significant difference between the means of the SLs of the two distribu-tions (two tailed t-test: P= 0.4159), we did observe that the community composition of samples belonging to the high richness distribution were significantly more similar to 4 d.p.f. samples than were those belonging to the low richness distribution (measured by comparing pairwise UniFrac distances: Po0.001). This suggests that at ~ 10 d.p.f., the zebrafish transition from a larval to a juvenile microbiota, and that the fish we sampled were at different stages of this process despite being the same age. One potential explanation for this pattern would be a difference between fish that had begun consuming exogenous food earlier or later.
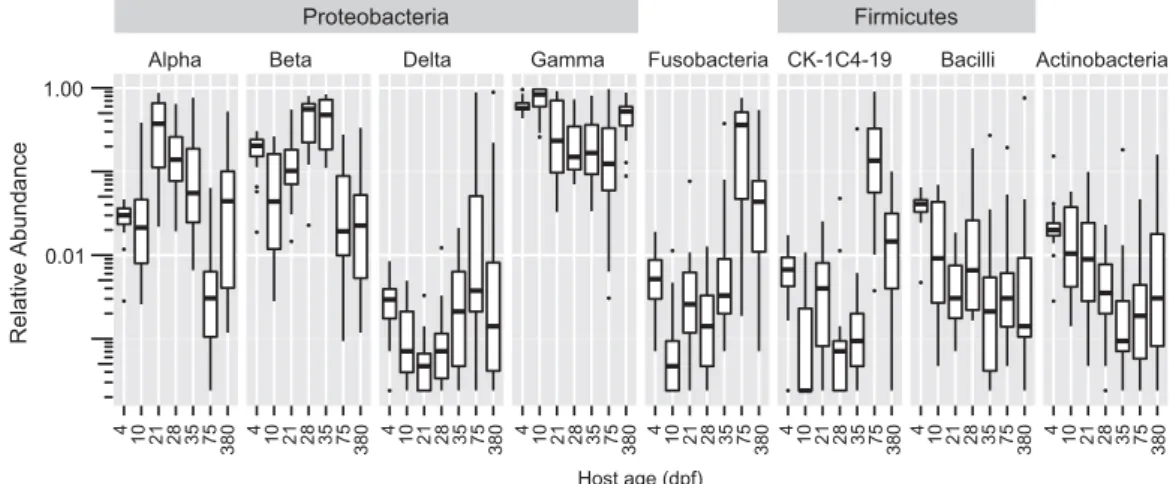
These changes in community diversity were accompanied by significant changes in the phylum-level composition of larval (4 and 10 d.p.f.), juvenile (21, 28 and 35 d.p.f.) and adult (75 and 380 d.p.f.) fish, with particularly large differences in the taxonomic class composition of the Proteobacteria (Figure 3a,Supplementary Figure 3). The γ -proteo-bacteria were the most abundant class of -proteo-bacteria in the study, and were especially abundant in larval intestines as well as environmental samples. Concurrent with the change in food and environ-ment at 21 d.p.f., a marked increase in the abundance of α-proteobacteria was observed in the intestines and was followed by a decrease in abundance during the 28, 35 and 75 d.p.f. age classes, during which time diet and environment were held constant. There was a decrease in the abundance of β-proteobacteria during these same stages, from a peak at 28 d.p.f. Interestingly, the β-proteobacteria were particularly abundant in all food and environ-mental samples collected from 10 d.p.f. fish and before (71% average; Supplementary Figure 3) yet were not consistently as abundant in intestinal
samples until 35 d.p.f., suggesting a time lag between initial exposure and detection of abundant coloniza-tion by this class. Although their relative abundances differed in environmental samples, the most abundant β-proteobacteria OTUs in 35 d.p.f. fish were also detected in environmental samples, with the notable exception of an OTU belonging to the family Neisseriaceae that contributed to an average of 5.4% of the reads from 35 d.p.f. fish (Supplementary Dataset 1). The proportion of these Proteobacteria classes decreased strongly in 75 d.p.f. fish, despite being fed the same diet as the juveniles. Consistent with previous studies of the adult zebrafish intestine (Rawls et al., 2004 and 2006 Roeselers et al., 2011), we found Fusobacteria to be abundant in the adult stage (75 and 380 d.p.f.) intestinal samples (30% and 12%, respectively), although they accounted for o1% of the total community in the 21–35 d.p.f. fish (Supplementary Dataset 1). Also in agreement with our previous study (Roeselers et al., 2011), we found a large diversity of Fusobacteria OTUs within intestines (168), with the majority of these OTUs (90%) being classified in the genus Cetobacterium, which was found in all 38 adult intestines. OTUs belonging to the Aeromonadaceae family (γ-proteobacteria class) that could not be further classified to genus were the only grouping found in all of the 137 intestinal samples analyzed (Table 1). When broken down by developmental group, 10 more genera were found in all the larval intestines (4 and 10 d.p.f.) and 11 more in all the juvenile (21, 28 and 35 d.p.f.) intestines, whereas only the Plesiomonas and Cetobacterium genera were also found in all the adult intestines. Many of these genera were previously identified as part of a core microbiota of the adult zebrafish intestine (Roeselers et al., 2011). Additional core genera found in 490% of intestines from a given developmental stage group included Shewanella, Vibrio, PseudomonasandStreptococcus. The overall abundance of these core taxa varied from nearly 14% for the OTUs within the Aeromonadaceae to o1%
Figure 3 Major shifts in bacterial taxa throughout development. Bacterial classes with41% average relative abundance across all ages,
plotted on a log scale (All taxonomic classesPo0.0001, Kruskal–Wallis).
Table 1 G enera found in grea ter than 90% of larval , juveni le or ad ult inte stin es Genus or best (taxa level) classification Phylum All intestinal samples Larval Juvenile Adult Relative c ore genera from Roeselers et al., 2011 a Zebrafish isolated strain representatives with genome sequences b,c % P
resence inall intestines (n
= 137) d % Total intestinal reads e % P resence in larval intestines ( n = 40) %
Total larval reads
e % P resence in juvenile intestines ( n = 57) % Total juvenile reads e % P resence in adult
intestines (n
=3
8
)
%
Total adult reads
for theStreptococcus,with considerable variation in abundance observed among age groups. An abun-dant class of uncultured Firmicutes (placed as a separate phyla in some reference taxonomies) referred to as ‘CK-1C4-19’ was found in 89% of all intestinal samples and represented nearly 14% of the total reads in adult intestines. We detected 87 different OTUs from this uncultured class, which represented 3.8% of the total OTUs in the adult zebrafish intestines (Supplementary Figure 3).
We next asked whether any of these taxonomic groups were strongly associated with particular stages of zebrafish development. For this analysis, we combined the 75 and 380 d.p.f. fish intestinal communities together into a single class (‘adult’), and analyzed all the age classes using a nonpara-metric test of significance and linear discriminant analysis with the defaults implemented by LEfSe (Kruskal–Wallis; Po0.05 and log 10 linear discriminant analysis score 42.0). These analyses identified 184 discriminatory taxa, of which the majority (95) distinguished the youngest, non-feeding (4 d.p.f.) age class from all others (Supplementary Table 4). The discriminating taxa for the 4 d.p.f. fish largely belonged to the Proteo-bacteria despite this phylum’s abundance in the entire data set. To determine the most highly discriminatory bacterial taxa for each age class, we implemented stricter cutoffs for LEfSe (Po0.01, log 10 linear discriminant analysis score 43.5; Supplementary Figure 4). The 10 d.p.f. age class, which had begun feeding on Paramecium, were distinguished by the consistent presence of the genusMycobacterium. Notably, this genus contains the fish pathogens M. marinum and M. chelonae, which were known to be present in our facility during the time of the experiment, and which have recently been shown to be efficiently transmitted to zebrafish via ingestion of infected paramecia (Peterson et al., 2013). Although our sequences did not allow us to resolve the species-level identification of these Mycobacterium OTUs, we detected Mycobacterium sequences in every envir-onmental sample associated with Paramecium feeding (eight samples, average 4% abundance), including all three replicates of the Paramecium food samples, suggesting a possible transmission route (Supplementary Dataset 1). The juvenile age classes were largely discriminated by the presence of β-proteobacteria lineages, while the adult class was distinguished by the low abundance Bacteroidaceae family, the prevalent Fusobacteria (specifically the Cetobacterium genus) and by the CK-1C4-19 candidate class of Firmicutes. Differences in taxonomic composition throughout development were reflected by differences in the predicted functional capacity of these taxa (Supplementary Information), which included predicted differences in the representation of genes involved in cell motility and carbohydrate metabolism between adult and younger fish (Supplementary Figure 6C).
Variation in microbial community composition changes over zebrafish development
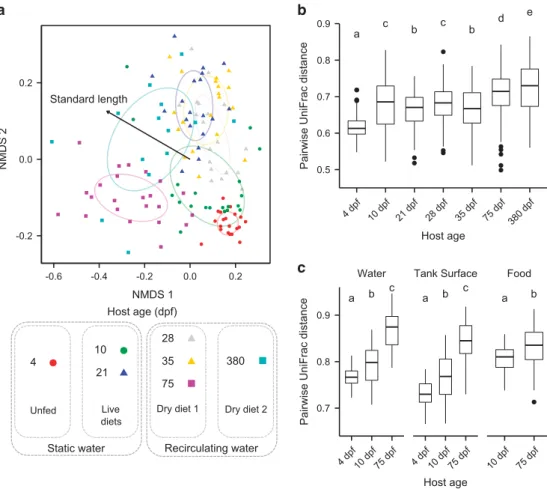
Despite the genetic similarity and shared environ-ment of their hosts, the overall composition of microbial intestinal communities showed a substan-tial amount of variation among fish, as measured by the UniFrac distance (Figure 4). Communities associated with individual fish were more similar to communities associated with fish of the same age than they were to those associated with fish of different ages (Figure 4a; permutational multivariate analysis of variance;r2= 0.18; Po0.001). Over time,
variation among hosts significantly increased, but the effect was small and non-monotonic in the juvenile stages (Figure 4b; r2= 0.10; Po0.001).
To determine whether there were possible tank effects, we performed a permutational multivariate analysis of variance with age, tank and age by tank as factors. Neither tank nor the interaction of age by tank produced significant effects (P= 0.930 and P= 0.363, respectively), suggesting there was little to no tank effect that would influence the interpreta-tion of our results. Before 75 d.p.f., we were unable to assign sex to each zebrafish using external traits; however, we did not see a significant effect of sex on community similarity at 75 or 380 d.p.f. (P= 0.11 and P= 0.12, respectively). Given these results, we grouped samples from fish raised in different tanks and fish of both sexes together for the remainder of the analyses.
constant for these time points, thus enhancing the relative contribution of host development.
We computed the pairwise dissimilarity between fish intestinal communities and each of the three communities associated with the external environ-ment: the tank water, tank surfaces and food fed to the fish. Fish intestinal communities were more similar to other fish intestinal communities than they were to any environmental communities (Figure 4c; Po0.001 for all comparisons post Bonferroni correction). The dissimilarity between intestinal communities and environmental commu-nities increased over time, (Po0.0001; r2= 0.59, 0.52 and 0.13 for comparisons to tank water, surfaces and food samples, respectively). As a result, the intestinal communities associated with young 4 and 10 d.p.f. fish were significantly more similar to surrounding environmental communities than were older 75 d.p.f. fish (Po0.001 for tank water, surface and food environments). This pattern was further manifested by increased differentiation of predicted fish associated meta-genomes from predicted environmental meta-genomes (Supplementary Figure 6E).
Discussion
The microbial community of the animal gut has been described as an additional host‘organ’; however, its assembly, analogous to the process of organ devel-opment, is poorly understood. Here we have char-acterized the development of the intestinal microbiota from a single sibship of zebrafish and show that while distinct bacterial communities assemble at different stages, the cellular composition is much less stereotyped than developing host tissue. Instead, we observe extensive interindividual varia-tion in intestinal microbiota composivaria-tion at each developmental stage, despite our ability to control host genotype and environment, that mirrors the interindividual variation routinely observed in other vertebrate hosts, including humans (Caporasoet al., 2011; The Human Microbiome Project Consortium, 2012) and mice (Benson et al., 2010; Rogers et al., 2014). We conclude that interindividual variation in microbiota is a characteristic of vertebrates across development.
This study was designed to understand developmental stage-specific intestinal microbiota composition and
e
c
n
at
si
d
c
ar
Fi
n
U
e
si
wri
a
P
Host age
Water Tank Surface Food
Host age
e
c
n
at
sid
c
ar
Fi
n
U
e
si
wri
a
P
a c
c
b b
d e
NMDS 1
NMDS 2
Standard length
a b c a b c a b
Host age (dpf)
Recirculating water 28
75 35
Dry diet 1
380
Dry diet 2
Static water 10
21
Live diets
4
Unfed
Figure 4 Phylogenetic dissimilarity of microbiota from fish and environmental samples. (a) An non-metric multidimensional scaling
(NMDS) ordination of (unweighted) UniFrac distances among zebrafish intestinal communities across development. Host age is differentiated by the color of points, while husbandry conditions (diet and water flow) are described in the legend. The age class of the host is indicated by the shape of points: circles indicate larvae, triangles indicate juveniles and squares indicate adults. The effect of standard length on the spread of points is shown by a vector. (b) Pairwise Unifrac distances among fish within each age group. (c) Pairwise Unifrac distances between fish and environmental communities at each age group. For each boxplot, letters above age groups indicate significant differences in the means.
diversity under standard laboratory rearing condi-tions of the zebrafish, and provides a reference for future studies investigating the crosstalk between developing zebrafish hosts and their microbiota. We observed major compositional shifts both during periods of development when diet and environment were also changing (that is, from larval to juvenile stages) as well as when diet and environment remained constant (that is, from late juvenile to adult stages) suggesting that host physiological development likely has significant effects on the microbiota independent of the other factors. The appearance of an adult-like microbiota in mammals begins shortly after weaning, when the introduction of solid foods and the removal of maternally provided immune factors (in particular breast-milk-derived immunoglobulins) impact the composition of the infant gut microbiota (Bergström et al., 2014; Rogier et al., 2014). In this study, we detected bacterial taxa characteristic of adult zebrafish (such as Fusobacteria and the CK-1C4-19 class) early in development but they remained low until the adult stages. While we observed increased sIgM levels during the transition from juvenile to adulthood that could influence these compositional shifts, differ-ences in sIgM levels explained far less variation among microbiota than did SL. This further supports the notion that morphological changes during devel-opment are likely the dominant drivers of changes in the microbiota, at least during periods when diet and environment are constant.
We found that the communities associated with larval fish were more similar to communities associated with the surrounding environment than were adult fish, indicating a greater role of environ-mental exposure early in development. This is consistent with observed correlations in humans between birth delivery mode and the composition of the intestinal microbiota (Dominguez-Belloet al., 2010),
and the relative instability of the intestinal micro-biota between early stages of postnatal development in human newborns (Mackie et al., 1999; Palmer et al., 2007; Koeniget al., 2011; Bäckhedet al., 2015) and in mice (Pantoja-Feliciano et al., 2013). These similarities suggest that the intestinal environments of mammals and fish may be similar in some key aspects (for example, relative changes in oxygen concentration through development), and that envir-onmental exposures including diet can have signifi-cant impacts on the observed composition of intestinal microbiota early in development.
The changes we observed in community composi-tion during the development highlight the need for careful consideration of developmental context in studies of host–microbe interactions. At the very least, comparisons across studies should strive to use consistent ages and development stages of the sampled hosts. It is well established that the presence and composition of the microbiota influ-ences a wide array of host developmental and physiologic processes in zebrafish and other animal hosts (Rawls et al., 2004; Bates et al., 2006; McFall-Ngaiet al., 2013). Our results highlight observations that some of the observed phenotypic variation in animal studies is, in part, owing to variations in the microbiota. For example, it was recently shown that differences in microbial community composition in wild-type mice alter the intestinal IgA levels, thereby differentially influencing susceptibility to a chemi-cally induced model of colitis (Moon et al., 2015). Likewise, it is possible that our observation of greater variation in sIgM transcript abundance in older fish, with little variation in size, is simply a reflection of increasing microbiota variation between individuals in response to widely varying microbial commu-nities. In the future, it may be helpful to develop and deploy engineered communities of cultured microbes to provide reproducible microbiotas for broad use, or use experimental design strategies that control for microbial variation between individuals, stages, clutches, tanks, pedigrees and facilities. Our characterization of intestinal microbiota dynamics across zebrafish development and the genomes of representative members of these communities pro-vide a useful resource and framework for such future studies.
Conflict of Interest
The authors declare no conflict of interest.
Acknowledgements
Research reported in this publication was supported by the National Institute of General Medical Sciences of the NIH under award numbers R01GM095385 and P50GM098911. Grant P01HD22486 provided support for the Oregon Zebrafish Facility. The content is solely the responsibility of the authors and does not necessarily represent the official views of the NIH.
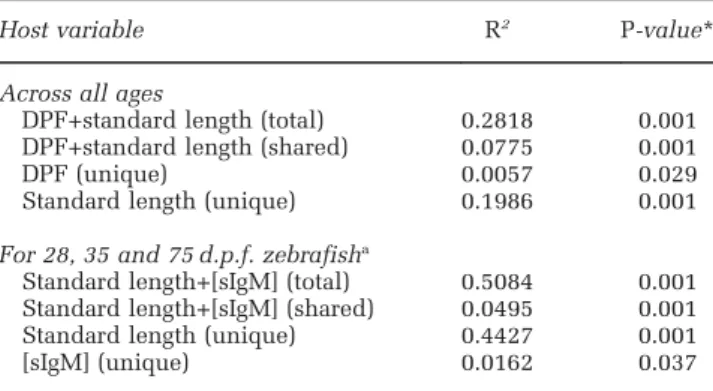
Table 2 Results of multiple regressions comparing community dissimilarity with differences in host age, standard length and sIgM concentrations
Host variable R2 P-value*
Across all ages
DPF+standard length (total) 0.2818 0.001 DPF+standard length (shared) 0.0775 0.001 DPF (unique) 0.0057 0.029 Standard length (unique) 0.1986 0.001
For 28, 35 and 75 d.p.f. zebrafisha
Standard length+[sIgM] (total) 0.5084 0.001 Standard length+[sIgM] (shared) 0.0495 0.001 Standard length (unique) 0.4427 0.001 [sIgM] (unique) 0.0162 0.037
Abbreviations: DPF, days post fertilization (d.p.f.); sIgM, secreted immunoglobulin M.
aThese ages had measurable sIgM transcript levels and shared husbandry conditions.
*P-values were calculated from a distribution of 1000 random permutations.
References
Avershina E, Storrø O, Øien T, Johnsen R, Pope P, Rudi K. (2014). Major faecal microbiota shifts in composition and diversity with age in a geographically restricted cohort of mothers and their children.FEMS Microbiol Ecol87: 280–290.
Bates JM, Mittge E, Kuhlman J, Baden KN, Cheesman SE, Guillemin K. (2006). Distinct signals from the micro-biota promote different aspects of zebrafish gut differentiation.Dev Biol297: 374–386.
Benson AK, Kelly SA, Legge R, Ma F, Low SJ, Kim Jet al. (2010). Individuality in gut microbiota composition is a complex polygenic trait shaped by multiple environ-mental and host genetic factors. Proc Natl Acad Sci USA107: 18933–18938.
Bergström A, Skov TH, Bahl MI, Roager HM, Christensen LB, Ejlerskov KT et al.(2014). Establish-ment of intestinal microbiota during early life: a longitudinal, explorative study of a large cohort of Danish infants.Appl Environ Microbiol80: 2889–2900. Bäckhed F, Roswall J, Peng Y, Feng Q, Jia H, Kovatcheva-Datchary P et al. (2015). Dynamics and stabilization of the human gut microbiome during the first year of life.Cell Host Microbe17: 690–703. Caporaso J, Kuczynski J, Stombaugh J, Bittinger K,
Bushman FD, Costello EKet al.(2010). QIIME allows analysis of high- throughput community sequencing data.Nat Methods7: 335–336.
Caporaso JG, Lauber CL, Costello EK, Berg-Lyons D, Gonzalez A, Stombaugh Jet al.(2011). Moving pictures of the human microbiome.Genome Biol12: R50. Chen J, Bittinger K, Charlson ES, Hoffmann C,
Lewis J, Wu GDet al.(2012). Associating microbiome composition with environmental covariates using generalized UniFrac distances. Bioinformatics 28: 2106–2113.
Dominguez-Bello MG, Costello EK, Contreras M, Magris M, Hidalgo G, Fierer Net al.(2010). Delivery mode shapes the acquisition and structure of the initial microbiota across multiple body habitats in newborns. Proc Natl Acad Sci USA107: 11971–11975.
Faith DP. (1992). Conservation evaluation and phyloge-netic diversity.Biol Conserv61: 1–10.
Friswell MK, Gika H, Stratford IJ, Theodoridis G, Telfer B, Wilson ID et al. (2010). Site and strain-specific variation in gut microbiota profiles and metabolism in experimental mice.PLoS One5: e8584.
Hartigan J, Hartigan P. (1985). The Dip Test of Unimodality.Ann Stat13: 70–84.
Howe K, Clark MD, Torroja CF, Torrance J, Berthelot C, Muffato M et al. (2013). The zebrafish reference genome sequence and its relationship to the human genome.Nature496: 498–503.
Kembel SW, Cowan PD, Helmus MR, Cornwell WK, Morlon H, Ackerly DD et al. (2010). Picante: R tools for integrating phylogenies and ecology. Bioinfor-matics26: 1463–1464.
Koenig JE, Spor A, Scalfone N, Fricker AD, Stombaugh J, Knight R et al. (2011). Succession of microbial consortia in the developing infant gut microbiome. Proc Natl Acad Sci USA108(Suppl): 4578–4585. Lichstein JW. (2007). Multiple regression on distance
matrices: a multivariate spatial analysis tool. Plant Ecol188: 117–131.
Mackie RI, Sghir A, Gaskins HR. (1999). Developmental microbial ecology of the neonatal gastrointestinal tract. Am J Clin Nutr69: 1035S–1045S.
McFall-Ngai M, Hadfield MG, Bosch TCG, Carey HV, Domazet-Loso T, Douglas AEet al.(2013). Animals in a bacterial world, a new imperative for the life sciences. Proc Natl Acad Sci USA110: 3229–3236.
Milligan-Myhre K, Charette JR, Phennicie RT, Stephens WZ, Rawls JF, Guillemin K et al. (2011). Chapter 4 - Study of host -microbe interactions in zebrafish. In: Detrich HW, Westerfield M, Zon LI (eds), Methods in Cell Biology, Vol 105. Academic Press: San Diego, CA, USA, pp 87–116.
Moon C, Baldridge MT, Wallace MA, Burnham C-AD, Virgin HW, Stappenbeck TS. (2015). Vertically trans-mitted faecal IgA levels determine extra-chromosomal phenotypic variation.Nature521: 90–93.
Oksanen J, Blanchet FG, Kindt R, Legendre P, Minchin PR, O’Hara RB et al. (2013). vegan: Community Ecology Package.
Olszak T, An D, Zeissig S, Vera MP, Richter J, Franke A et al.(2012). Microbial exposure during early life has persistent effects on natural killer T cell function. Science336: 489–493.
Palmer C, Bik EM, DiGiulio DB, Relman DA, Brown PO. (2007). Development of the human infant intestinal microbiota.PLoS Biol5: e177.
Pantoja-Feliciano IG, Clemente JC, Costello EK, Perez ME, Blaser MJ, Knight Ret al.(2013). Biphasic assembly of the murine intestinal microbiota during early develop-ment.ISME J7: 1112–1115.
Parichy DM, Elizondo MR, Mills MG, Gordon TN, Engeszer RE. (2009). Normal table of postembryonic zebrafish development: staging by externally visible anatomy of the living fish.Dev Dyn238: 2975–3015. Peterson TS, Ferguson JA, Watral VG, Mutoji KN,
Ennis DG, Kent ML. (2013). Paramecium caudatum enhances transmission and infectivity ofMycobacterium marinumandM. chelonaein zebrafishDanio rerio.Dis Aquat Organ106: 229–239.
Phillips JB, Westerfield M. (2014). Zebrafish models in translational research: tipping the scales toward advancements in human health. Dis Model Mech 7: 739–743.
R Core Team (2014). R: A Language and Environment for Statistical Computing.
Rawls JF, Mahowald MA, Ley RE, Gordon JI. (2006). Reciprocal gut microbiota transplants from zebrafish and mice to germ-free recipients reveal host habitat selection.Cell127: 423–433.
Rawls JF, Samuel BS, Gordon JI. (2004). Gnotobiotic zebrafish reveal evolutionarily conserved responses to the gut microbiota. Proc Natl Acad Sci USA 101: 4596–4601.
Roeselers G, Mittge EK, Stephens WZ, Parichy DM, Cavanaugh CM, Guillemin K et al. (2011). Evidence for a core gut microbiota in the zebrafish. ISME J 5: 1595–1608.
Rogers GB, Kozlowska J, Keeble J, Metcalfe K, Fao M, Dowd SE et al. (2014). Functional divergence in gastrointestinal microbiota in physically-separated genetically identical mice.Sci Rep4: 5437.
Rogier EW, Frantz AL, Bruno MEC, Wedlund L, Cohen DA, Stromberg AJ et al. (2014). Secretory antibodies in breast milk promote long-term intestinal home-ostasis by regulating the gut microbiota and host
gene expression. Proc Natl Acad Sci USA 111: 3074–3079.
Schloss PD, Westcott SL, Ryabin T, Hall JR, Hartmann M, Hollister EB et al. (2009). Introducing mothur: open-source, platform-independent, community-supported software for describing and comparing microbial communities.Appl Environ Microbiol75: 7537–7541. Segata N, Izard J, Waldron L, Gevers D, Miropolsky L,
Garrett WS et al. (2011). Metagenomic biomarker discovery and explanation.Genome Biol12: R60. Semova I, Carten JD, Stombaugh J, Mackey LC, Knight R,
Farber SAet al. (2012). Microbiota regulate intestinal absorption and metabolism of fatty acids in the zebrafish.Cell Host Microbe12: 277–288.
Sommer F, Bäckhed F. (2013). The gut microbiota–masters of host development and physiology.Nat Rev Microbiol
11: 227–238.
The Human Microbiome Project Consortium (2012). Structure, function and diversity of the healthy human microbiome.Nature486: 207–214.
Uchida D, Yamashita M, Kitano T, Iguchi T. (2002). Oocyte apoptosis during the transition from ovary-like tissue to testes during sex differentiation of juvenile zebrafish.J Exp Biol205: 711–718.
Yatsunenko T, Rey FE, Manary MJ, Trehan I, Dominguez-Bello MG, Contreras M et al. (2012). Human gut microbiome viewed across age and geography.Nature486: 222–227.