U.S. HOUSEHOLD PURCHASES OF NO- AND LOW-SUGAR PRODUCTS FROM KEY FOOD GROUP SOURCES OF ADDED SUGAR, 2002-2014
Elyse S. Powell
A dissertation submitted to the faculty of the University of North Carolina at Chapel Hill in partial fulfillment of the requirements for the degree of Doctor of Philosophy in the
Department of Nutrition in the Gillings School of Global Public Health.
Chapel Hill 2018
Approved by: Linda Adair Jennifer Poti
iii
ABSTRACT
Elyse S. Powell: U.S. household purchases of no- and low-sugar products from key food group sources of sugar, 2002-2014
(Under the direction of Linda Adair)………
Despite recent declines in added sugar intake, population sugar consumption remains above recommended levels. More than two thirds of added sugars consumed in the U.S. comes from stores, and more than 75% of added sugars consumed comes from the top eight food and beverage group sources. As such, widespread public and private efforts to promote purchases of no- and low- sugar alternatives to these foods and beverages are seen as
promising strategies to reduce population sugar consumption.
However, trends in household no- and low-sugar products purchases in these eight key food groups have not been assessed over this time period. Further, there are concerns that ongoing efforts to promote no- and low- sugar products will not equitably reach minority and low-income populations, and may unintentionally increase consumption of low-calorie sweeteners. We currently do not know whether there are racial/ethnic and income differences in purchases of these products. We additionally do not know what proportion of no- and low-sugar product purchases contain low-calorie sweeteners.
iv
calories per labelled servings, which are not consistent across brands and products, or on low-calorie sweetener consumption, which does not capture all low-sugar products.
This research addressed these gaps using the 2002-2014 Nielsen Homescan
v
ACKNOWLEDGEMENTS
I wish I could take another 120 pages to express my gratitude to everyone who supported me throughout this process. First thanks go to my advisor Dr. Linda Adair, who very kindly adopted me in my final year of the program. Your mentorship, kindness, and encouragement pushed me across the finish line when I needed it most. To my co-chair Dr. Jennifer Poti, who has mentored me from day one of this program. Your brilliant insight, the way your carefully consider complex problems, and your generosity with your time were foundational to my doctoral experience, and I am a better researcher and thinker because of it. If I am lucky enough to mentor others in the future, I will often think of the way both of you mentored me. To Drs. Beth Mayer-Davis, Whitney Robinson, and Annie Green Howard; thank you for your thoughtful feedback on my research, being so giving of your time, and your encouragement. I am forever grateful that I had the opportunity to learn from such a talented group of researchers and women.
vi
instrumental to this research, and also your wonderful companionship. Particular thanks to Donna Miles, for all of your efforts and your continued patience with my ever growing data requests, to Julie Wendell for your assistance in examining the product level data for me, and to Shu wen Ng, Donna Miles, and Jen Poti for creating the weights used in my research. Thanks also to the Royster Society of Fellows and their many wonderful staff, who not only supported my time here but also connected me to the broader UNC community.
To my 2.5 cohort: Cody Neshtruk, Elle Glenny, Alyssa Cozzo, and Courtney
Luecking. I couldn’t ask for a better group of people to go through this program with. I am so grateful for your laughter, your comradery, and your endless support. I genuinely don’t know if I would have done without you.
To the climbers. Its sometimes difficult to wrap my head around the wonderful Carrboro family I have found. There are too many of you to name, but particular thanks to Paul, Emily, John, Josh, Mo, Kat, Kevin, Jonathan and Jenna. You have truly walked alongside me during this journey; you’ve laughed with me, supported me, celebrated with me, and even fed me. Thank you, thank you, thank you. And special thanks to Josh Robbs for your editing help!
vii
To Lianne Mech. Thank you for always being there for me with wisdom and strength. I treasure what you bring into my life. In loving memory of James Mech. Your empathy, humor, and kindness were so formative for me. I carry your heart in my heart.
viii
TABLE OF CONTENTS
LIST OF TABLES ... x
LIST OF FIGURES ... xi
LIST OF ABBREVIATIONS ... xii
CHAPTER 1. INTRODUCTION ... 1
Background ... 1
Research Aims ... 3
CHAPTER 2: LITERATURE REVIEW ... 5
The “sugar backlash” and efforts to promote low-sugar products ... 5
The U.S. lacks a consistent, comprehensive definition of low-sugar... 7
The role of low-calorie sweeteners ... 8
Are there sociodemographic or socioeconomic disparities in purchases of low-sugar products? ... 9
Opportunities in using the Homescan Consumer Panel Dataset to study no- and low-sugar products ... 11
CHAPTER 3. TRENDS IN LOW-SUGAR PACKAGED FOOD AND BEVERAGE PURCHASES FROM KEY FOOD GROUP SOURCES OF ADDED SUGARS, 2002-2014 ... 13
Overview ... 13
Introduction ... 14
Methods ... 17
Results ... 22
ix
CHAPTER 4. RACE/ETHNIC AND INCOME DISPARITIES IN U.S. HOUSEHOLD LOW-SUGAR FOOD AND BEVERAGE
PURCHASES FROM 2002- 2014 ... 46
Overview ... 46
Introduction ... 48
Methods ... 50
Results ... 55
Discussion ... 58
CHAPTER 5. SYNTHESIS ... 78
Overview of findings ... 78
The proportion of beverages classified as sugar-free in our examined groups increased, but the proportion of foods and beverages classified as low-sugar did not. ... 79
U.S. household sugar-free beverage purchases increased from 2002 to 2008, and then did not substantially change through 2014. ... 80
The contribution of products containing low-calorie sweeteners to low-sugar beverage and low-sugar food purchases shifted substantially ... 82
There are race/ethnic and income disparities in sugar-free beverage and low-sugar food purchases ... 84
Limitations ... 86
Strengths ... 89
Significance and public health impact ... 90
Future directions ... 93
x
LIST OF TABLES
Table 3.1. Classification of barcoded packaged foods and beverages as
sugar-free and low-sugar, by presence of sweetener1 ... 33 Table 3.2: Number and proportion of products categorized as
sugar-free and low-sugar, by food and beverage group, Homescan
2002-20141 ... 36 Table 3.3: Weighted mean percent of sugar-free and low-sugar
purchases that contain low-calorie sweetener (LCS), caloric sweetener (CS), both or none, by food and beverage group
Homescan 2002-20141 ... 41 Table 3.4: Sociodemographic characteristics of U.S. households
participating in the 2002-2014 Homescan Panel1 ... 42 Table 3.5: Number of barcoded products, classified by low-sugar and
by presence of sweetener, Homescan 2002 and 20141 ... 45 Table 4.1. Changes in no- and low-sugar food and beverage purchases
by food group, by household race/ethnicity and income,
2002-20141 ... 67 Table 4.2: Racial/ethnic and income differences in the percent of no-
and low-sugar product purchases that contain low-calorie
sweeteners, caloric sweeteners, both or none, 2002-141 ... 70 Table 4.3. Classification of barcoded packaged foods and beverages as
sugar-free and low-sugar, by presence of sweetener1 ... 72 Table 4.4: Sociodemographic characteristics of U.S. households
xi
LIST OF FIGURES
Figure 3.1. Proportion of no- and low-sugar products that contain different types of sweeteners in key food and beverage sources
of sugar, Homescan 2002-20141 ... 38 Figure 3.2. Weighted percent of U.S. households that purchased
no-sugar beverages, low-no-sugar beverages and low-no-sugar foods,
Homescan 2002-20141 ... 39 Figure 3.3. Weighted mean household no- and low-sugar beverage and
low-sugar food purchases from top food and beverage group
sources of added sugars, Homescan 2002-2014.1 ... 40 Figure 3.4: Weighted mean no- and low-sugar beverage and low-
sugar food purchases per capita per day, Homescan 2002-20141 ... 44 Figure 4.1: Weighted percent of U.S. Households that purchased no-
and low-sugar products by household race/ethnicity and
income, 2002-141 ... 65 Figure 4.2. Weighted mean no- and low-sugar product purchases, by
household race/ethnicity and income, 2002-20141 ... 66 Figure 4.3: Mean household no- and low-sugar purchases in examined
food and beverage groups, per capita per day, Homescan
xii
LIST OF ABBREVIATIONS
CDC Centers for Disease Control and Prevention CS Caloric sweetener
FDA Food and Drug Administration FJC Fruit Juice Concentrate
FPL Federal poverty limit FSA Food Standards Agency LCS Low-calorie sweetener NH non-Hispanic
RTD Ready to drink RTE Ready to eat
SSB Sugar-sweetened beverage U.K. United Kingdom
1
CHAPTER 1. INTRODUCTION
Background
Over the past 15 years, there has been rising concern about excess sugar
consumption, as growing evidence links this modifiable behavior to obesity, diabetes and cardiovascular disease. 1–5 In an effort to reduce population sugar consumption, there have been numerous public and private efforts during this period to create and promote no- and low-sugar alternatives to foods and beverages that contribute the most sugar to the U.S. diet.6,7 These efforts have included reformulation efforts, consumer education, and marketing campaigns. 5,8–11
However, studies have not examined whether purchases of no- and low-sugar
2
It is further unclear whether there are differences by race/ethnicity or income in purchases of no- or low-sugar products. Many of the efforts used over the past 15 years to promote no- and low-sugar alternatives may not equitably reach racial/ethnic minority and low-income populations. 16–23 A previous criticism of national level efforts has been that they fail to reach these subgroups, who have disproportionately higher rates of obesity and
diabetes. 24,25
There is widespread concern that efforts to promote no- and low-sugar products may have the unintended consequence of increasing low-calorie sweetener (LCS) consumption. Previous research has found that children and adults have increased their LCS consumption since 2000. 26,27 However, not all no- and low-sugar products contain LCS; such products may contain caloric sweeteners (CS) or may be unsweetened. There is ongoing debate as to whether LCS containing products should be promoted as part of a sugar reduction strategy; findings linking LCS to health outcomes have been discrepant. 28–35 Researchers and public health organizations widely agree that unsweetened products are the preferred option to promote. 36 However, there is a gap in understanding what percent of no- and low-sugar products purchased contain LCS or are unsweetened, and whether that has changed over the past 15 years.
3
cut point that has been previously used in the U.K. We utilized Homescan’s product specific ingredients list to then identify products that contain CS, LCS, both or none. We then
examined purchases from these eight food and beverage groups in a nationally representative sample of U.S. households to determine 1) trends in household no-and low-sugar purchases, 2) the proportion of no- and low-sugar purchases that contain different types of sweeteners, 3) differences in no- and low-sugar purchases by household race/ethnicity and household income and 4) differences in no- and low-sugar purchases that contain different types of sweeteners by household race/ethnicity and income. Homescan’s objective measure of purchases, using a barcode scanner, and year-long collection of data may help us better capture trends in purchases of these episodically consumed foods and beverages.
Research Aims
The overarching goal of this research project was to examine nationally
representative trends in household no- and low-sugar product purchases from eight key food and beverage group sources of added sugars. We further aimed to examined household race/ethnic and income differences in purchases of these products.
Aim 1: Examine nationally representative trends in household no- and low-sugar
product purchases from 2002-2014
4
of no- and low-sugar products from our examined food and beverage groups increased from 2002 to 2014.
Aim 2- Examine household race/ethnic and income differences in no- and low-sugar
product purchases
We determined whether there are race/ethnic or income disparities in no and low-sugar product purchases. We further examined race/ethnic or income differences in the proportion of no- and low-sugar products that contain different types of
5
CHAPTER 2: LITERATURE REVIEW
The “sugar backlash” and efforts to promote low-sugar products
Over the past 15 years, there has been growing concern about sugar consumption by consumers and researchers alike, amidst rising evidence linking excess sugar consumption to obesity, diabetes, and other diet-related chronic diseases. 1–5 This rising concern, dubbed the ‘sugar backlash’, has led to various public and private efforts to promote low-sugar
alternatives to many food and beverages. 5
6
There have also been numerous public efforts to promote lower sugar alternatives. Recommendations from public health organizations to reduce sugar intake have included suggestions to replace key foods and beverage sources with lower sugar alternatives.36,40,41 Public education and marketing campaigns include federal campaigns such as the CDC’s “Rethink your Drink”, as well as state and local campaigns including “Are you pouring on the pounds?” and “Sugar pack” from New York and Los Angeles. 8,40,42 The potential for expanding U.S. policies replicating local and international sugar sweetened beverage (SSB) taxes, such as those in Berkley and Mexico, have prompted food manufacturers to create and market more lower sugar alternatives. 43–47
The top eight food and beverage sources of sugar contribute more than 75% of added sugars consumed by the U.S. population ≥6y. 6Therefore, there has been particular emphasis on creating and promoting low-sugar products in these food and beverage categories as a strategy to reduce population sugar consumption.7,46,48,49 We focused our analysis on purchases in these eight food and beverage groups: soft drinks and energy drinks; fruit drinks, sports drinks, and flavored waters; ready-to-drink (RTD) teas; grain-based desserts; candy; flavored yogurt; dairy-based desserts; and RTE cereals. A similar approach has been taken with sodium, where monitoring of key food group contributors has been used to assess public and private sodium reduction efforts. 50–52We examined sugar-free beverages
7
The U.S. lacks a consistent, comprehensive definition of low-sugar
Despite widespread efforts to promote low-sugar alternatives over the past 15 years, national trends in low-sugar purchases over this time period have not been quantified. A primary reason for this gap is that there is not a consistent, comprehensive definition of low-sugar used in the U.S.. The Food and Drug Agency (FDA), which sets specific cut points for labels such as ‘low calorie’, ‘low cholesterol’ and ‘low sodium’, only defines ‘reduced/less sugar’ compared to ‘an appropriate reference food’; it does not define ‘low sugar’.12 Products labelled as ‘reduced sugar’ are not necessarily low in sugar.57 Further, the food
manufacturers set the ‘appropriate reference product’, and so the ‘reduced sugar’ definition is not consistent across brands or products. 12,57 Finally, new low-sugar products may not have an ‘appropriate reference product’.
A limited number of studies have examined trends in consumption of ‘diet’ beverages utilizing NHANES data. 58–60 These studies, which defined diet beverages as those with <40 kcal per labelled serving, found that the percent of children and adults consuming diet beverages has increased from 2001 to 2014. Mesirow et al found that the amount of diet beverages consumed also increased among U.S. children 2-18y.60 However, low-calorie is not equivalent to low-sugar; for example, certain dairy based beverages may not be low in calories but may be low in sugar. For the same reason, this definition could not be used to identify low-sugar foods. Further, labelled servings are not standardized, making this an inconsistent definition across products and brands.
8
100mL of product, respectively.61 These cut points have been used in the U.K. both for product claims as well as a traffic light front of pack labelling system. A meaningful cut point that can be consistently applied across products, like the one established by the FSA, is needed to determine national trends in low-sugar product purchases. Dunford et al. applied the FSA’s definition of low-sugar to the 2017 Label Insight dataset, a national dataset of Nutrition Facts Panels from barcoded packaged foods and drinks available in stores.62 They found that 48% of uniquely barcoded foods and 14% of uniquely barcoded beverages met the FSA’s criteria for low-sugar. 62 This definition could be further used to determine whether the number of products meeting this criteria have changed, to quantify purchases of low-sugar products, and to examine changes in low-low-sugar purchases over time.
The role of low-calorie sweeteners
A central concern about public and private efforts to promote low-sugar alternatives to sugary products is that these efforts will increase consumption of LCS. 36,63–65 There is extensive debate about whether LCS sweetened products are an acceptable low-sugar
alternative. 66–70 While proponents argue that LCS sweetened products allow people to satisfy sweet cravings with products that are lower in sugar and energy, there have been long
9
Conversely, several cross-sectional and cohort studies have found increased risk of obesity and type 2 diabetes associated with LCS consumption. 29,34,35
In 2005-09, 15% of U.S. household food and beverage purchases from stores contained LCS.73 Purchases and consumption of LCS beverages has increased among U.S. children and adults since 2000.27,74,75 The percent of adults consuming any type of LCS rose from 8.7% in 1999-2000 to 41.4% in 2009-12. 75,76 Consumption of LCS beverages rose from 172.4 ml/day to 184.5 ml/day from 2003 to 2010. 27 Over this time period children and adults did not significantly increase their consumption of LCS containing foods. 26,27
However, not all LCS products are low-sugar, and not all low-sugar products contain LCS. While these changes occurred over the same time that there was an effort to promote low-sugar alternatives, it is not clear what percent of low-low-sugar purchases contained LCS.
Examining what proportion of low-sugar purchases contain LCS, and how that has changed over the past 15 years, can help us better understand whether shifting purchases towards low-sugar alternatives may increase consumption of LCS.
Are there sociodemographic or socioeconomic disparities in purchases of low-sugar products?
10
A central goal of national-level efforts is to reduce sugar consumption across the U.S. population.41,48,85 However many the efforts implemented, including reformulating products, marketing efforts, and educational efforts, may not equitably impact low-income and NH black and Hispanic households. 5,8–11,16–23Reformulation efforts aim to reduce the sugar content of products.48,85 The information needed to determine whether a product is low-sugar is available on the nutrition facts panel, however only about 30% of consumers regularly consult the nutrition facts panel, and these consumers are more likely to be higher income and higher educated. 22,86,87 Nutritional literacy and health education also predict food label use, both factors that Hess et al. found to be lower in low-income and less educated adults. 22 While marketing efforts may promote low-sugar alternatives, studies have found that outdoor and television advertisements targeted to non-Hispanic blacks and Hispanics are less likely to promote healthy products. 16,88–90
We do not know whether there are race/ethnic or income disparities in no- and low-sugar product purchases. Fewer NH black and low-income children and adults purchase and consume LCS. 27,74,75 Piernas et al found that in 2003-10NH white adults consumed 226 mL/day of beverages containing LCS, while NH black and Hispanic adults consumed 97 mL/day and 113mL/day, respectively.91 Similar differences were found for children.
11
Opportunities in using the Homescan Consumer Panel Dataset to study no- and low-sugar products
The Homescan Consumer Panel dataset (Homescan) will uniquely allow us to accurately classify no- and sugar products using the FSA’s gram cut points for low-sugar, as well as use an objective measure for examining no- and low-sugar purchases from stores. Many scholars have noted that publicly available datasets do not collect sufficient information to accurately monitor sugar content in products.13–15,36 Publicly available
databases use aggregates, estimates, and ‘standard recipes’ to determine the sugar content of food items, making it difficult to accurately identify whether a product is ‘low sugar’ using a gram cut point. Sugar content can vary widely for the same type of product across brands. 92 Further, self-report dietary assessment methods are limited by recall errors, consumer knowledge of the contents of the food they consume, underreporting, and difficulty estimating portion size. 93–95
Homescan is a national study of household packaged food purchases from stores. Participating households are provided with a barcode scanner, which they use to scan all packaged foods and beverages purchased from any type of store that are brought into the home. Each scanned barcoded item has been linked to a product specific nutrition facts panel, which includes grams of total sugars, and ingredients list. This allows us to classify products as no-sugar or low-sugar using the FSA’s cut points. We can also accurately identify
12
13
CHAPTER 3. TRENDS IN LOW-SUGAR PACKAGED FOOD AND BEVERAGE PURCHASES FROM KEY FOOD GROUP SOURCES OF ADDED SUGARS,
2002-2014 Overview
Background: Over the past 15 years, rising concern surrounding sugar consumption in the United States (U.S.) has led to public and industry efforts to promote low-sugar alternatives to many foods and beverages. However, trends in household low-sugar products purchases during this period have not been assessed.
Objective: To identify nationally representative trends in U.S. household purchases of packaged low-sugar alternatives from all types of stores, 2002-2014.
14
food groups (% g), and for the percent of no- and low-sugar purchases that contained caloric sweeteners and/or low-calorie sweeteners.
Results: More than two thirds of U.S. households purchased no- or low-sugar products from our examined food and beverage groups. Sugar-free beverage purchases from examined beverage groups rose from 2002 (25%±0.2% mL) through 2007 (31%±0.2% mL, p<.001), and then stabilized through 2014 (29%±0.2% mL, p<.001). Household low-sugar food purchases from selected food groups did not change significantly from 2002 (5%±0.1% g) to 2014 (4%±0.1% g). Household low-sugar beverage purchases also did not change over the study period.
Conclusions: Despite multi-sectoral efforts, sugar-free beverage purchases did not substantially change after 2008, and low-sugar food and beverage purchases did not change from 2002-2014.
Introduction
15
strategies to reduce population sugar consumption. 41,48,85,101 These efforts include
educational campaigns, changes in marketing strategies, and industry pledges to reduce the sugar and calories in the products they manufacture. 8,42,85,102,103 Reformulating products that are main contributors of added sugars have been identified by public and private
organizations as a priority. 7
However, whether actual consumer purchases of no- and low-sugar products in these eight key food groups has increased is unknown. While studies have documented increases in the consumption and purchases of low-calorie sweeteners (LCS), little attention has been paid to purchases of a broader range of low-sugar products. 26,27 Not all low-sugar products in the packaged food supply contain LCS. In 2005-09, 25% of uniquely formulated packaged foods purchased did not contain sugars or low-calorie sweeteners. 73 Similarly, products that contain LCS are not necessarily low in sugar, as products containing LCS can also contain caloric sweeteners, or be high in natural sugars. Household purchases of products containing both LCS and caloric sweeteners rose from 2000 to 2010. 27 A more comprehensive approach to studying low-sugar products is needed. Understanding trends in no- and low-sugar product purchases over the past 15 years can inform evaluations of manufacturers’ efforts to create low-sugar products. Furthermore, such knowledge can establish baseline trends to better evaluate future public and private efforts.
While not all no- and low-sugar products contain LCS, a central concern about efforts to promote lower sugar alternatives is that they will unintentionally increase consumption of LCS. 36,63–65 There is extensive debate about whether LCS sweetened products are an
16
contain LCS, CS, both or are unsweetened is unknown. Examining what proportion of no- and low-sugar purchases contain different types of sweeteners, and how that has changed over time, can help future evaluations better understand whether shifting purchases towards no- and low-sugar alternatives may increase LCS purchases.
A main reason for this research gap is the lack of a comprehensive definition of low-sugar products. In the U.S., the FDA does not define low-low-sugar, instead defining ‘reduced sugar’ compared to ‘an appropriate reference product’. However, ‘reduced sugar’ products are not necessarily low in sugar. 57 Further, food manufacturers determine the ‘appropriate reference product’, and so the ‘reduced sugar’ definition is not consistent across brands or products. 12,57 Finally, many new low-sugar products may not be labelled as ‘reduced sugar’ because they do not have an ‘appropriate reference product’. A consistent and nutritionally meaningful cut point for low-sugar, such as the one established in the U.K. for front-of-package labelling, is needed 61
17
U.S. households to determine U.S. trends from 2002 through 2014 in 1) purchases of no- and low-sugar beverages and low-sugar foods and 2) the proportion of no- and low-sugar product purchases containing different types of sweeteners.
Methods
Study design and population
This study used data from the 2002-2014 Nielsen Homescan Panel (Homescan), a longitudinal study of packaged food and beverage purchases by U.S. households. 104
Households were provided with a barcode scanner and instructed to scan all items after each shopping trip. Households scanned products purchased from all store types, including
supermarkets and grocery, warehouse-club, mass-merchandise, convenience, and drug stores.
Households were sampled from 76 markets, comprised of 52 metropolitan and 24 non-metropolitan geographical areas. To be included, households must report for ≥10 months in a year (mean 4.3y). Homescan used an open cohort design; new households were enrolled to replace households that dropped out and rebalance the panel to match demographic and geographic targets. Household composition (age and gender of family members) and sociodemographics (race/ethnicity, income, and head of household’s education) were self-reported annually. 105
Household level purchases were analyzed by year. Year-level household observations were excluded if they contained >1 quarter of unreliable reporting (2.4% excluded). A
household’s quarter was deemed unreliable if it included ≥4 weeks of inconsistent reporting as judged by dollar value of purchases (<$45/month for a single person household,
18
655,948 household-year observations, from 152,987 unique households. This secondary analysis was exempt from IRB approval.
Nutrition information & food and beverage groups
For every food or beverage scanned, the product’s barcode, product weight (g) or volume (mL), and product specific attributes were recorded. Each barcode was linked to a corresponding Nutrition Facts Panel, which includes calorie and nutrient content, and an ingredients list. The methods for this process have been described elsewhere. 14,106
We limited our analysis to products in eight key food and beverage groups that
represent the top sources of added sugars in the U.S. diet 6 These eight groups are: soft drinks and energy drinks; fruit drinks, sports drinks and flavored waters; ready-to drink teas; grain-based desserts; candy; flavored yogurts; dairy-grain-based desserts; and ready-to-eat cereals.
Barcoded products were categorized into these groups as part of a food grouping system which has been previously published. 105,107 Powders and concentrates were excluded because we cannot confirm whether these products remain sugar-free or low-sugar when consumed, as sugar may be added during preparation.
Classifying sugar-free and low-sugar products
Beverages were classified as sugar-free or low-sugar and foods were classified as low-sugar at the product level, using the barcode-linked nutrition fact panel data. Since the FDA does not currently define low-sugar, we used the U.K.’s Food Standards Agency criteria for low-sugar. We examined sugar-free beverages separately from low-sugar
19
due to recommendations to avoid sugars from beverages based on evidence that they are less satiating than foods and that intake of sugar sweetened beverages is associated with weight gain and obesity. 1,36,41,53–56 Low-sugar foods were defined as those with ≤5 g of sugar per 100 g of product. 12,61 Sugar-free beverages were defined as those with 0g of sugar and low-sugar beverage were classified as those containing >0g to 2.5g of low-sugar per 100mL of product. Nutrition Fact Panel rounding rules allow products with <0.5 g of sugar per serving to be reported as 0 g, thus these beverages were classified as sugar-free.
We used SAS (SAS version 9.3, SAS Institute Inc., Cary, NC) for data management. A detailed table of products classified as low-sugar or sugar-free by group is provided in
Table 1.
Classifying products by the presence of sweeteners
20
Statistical Analysis
Proportion of products that meet low-sugar or sugar-free criteria
The number of uniquely barcoded products in our eight examined food and beverage groups were counted for each year from 2002 to 2014. Products have unique barcodes because they are different products, or because they are the same product with different package sizes (12-ounce can vs 20-ounce bottle), different flavors (tea-peach vs tea-original) or have seasonal or promotional packaging (i.e., candy with promotional movie character).
Annually, for each beverage group, the percent of barcoded items categorized as low-sugar or low-sugar-free was calculated as the number of low-low-sugar or low-sugar-free barcoded
products divided by the total number of barcoded beverages. For each food group the percent of barcoded items categorized as low-sugar was calculated. We then determined, for each food and beverage group, the percent of barcoded low-sugar or sugar-free products that contained caloric sweeteners, LCS, both or none. A two-sample test of proportions was used to test differences from 2002; p<.001 was considered significant to account for multiple comparisons and the large sample size. 27,109–111
Household purchases of low-sugar and sugar-free products
Data analysis was conducted using survey commands in Stata 14 (Stata Corp, College Station, TX) to account for survey design, and projection weights were used to create
21
CPS distribution of household size, head of household age, presence of children, and the joint distribution of race (white, black, and Other), Hispanic origin, and household income. 112
Our goal was to estimate nationally representative trends in the percent of households that purchased low-sugar foods, low-sugar beverages, and sugar-free beverages were
examined. While consumers are often defined as individuals who report >0 g consumed over a 24h period, Homescan captures packaged food and beverage purchases for a household over an entire year. To meaningfully examine the proportion of households that purchased low-sugar products, households that purchased an average of ≥1 serving per week for a year were classified as a purchaser for that year. A serving was defined as 50 g for foods and 100 mL for beverages. 27 Survey weighted proportions were determined for each year, and
survey-weighted logistic regression models with clustering at the household were used to test time trends in prevalence of purchasers.
We then examined household-level purchases of no- and low-sugar products in our eight food and beverage groups. To control for differences in total purchase amounts and household size across households, no- and low-sugar product purchases were examined as a percent of total purchases (mL or g) from our eight food and beverage groups. Household level purchases of low-sugar foods, sugar-free beverages, low-sugar beverages were
low-22
sugar beverage, sugar-free beverage and low-sugar food purchases containing CS, LCS, both or neither in each year. Survey weighted means of low-sugar beverage purchases, sugar-free beverage purchases, low-sugar food purchases, and the proportion of low-sugar purchases containing each type of sweetener were determined for each year. Survey-weighted linear regression models with clustering at the household were used to test time trends in amounts purchased, and significance was calculated using Wald’s F test. For all analyses, p<0.001 was considered significant to account for multiple comparisons and to account for the large sample size.
Results
The Homescan study population has a higher proportion of non-Hispanic white and high-income households than the general U.S. population.112 All results for household-level purchases are weighted to generate nationally representative estimates. Sociodemographic characteristics of the study sample are presented in Supplemental Table 1.
Proportion of barcoded products in selected food groups that were categorized as no- or
low-sugar
In our examined key food and beverage groups, the percent of uniquely barcoded products categorized as low-sugar or sugar-free rose slightly from 2002 to 2014 (+3%, p<.001), from 11% to 14% (Table 2). While the number of low-sugar and sugar-free beverages and low-sugar foods increased over the survey period, there was also an increase in the total number of products in our examined food and beverage groups. (Table 2)
23
p<.001), and fruit drinks, sports drinks, and flavored waters (+6% p<.001) that were categorized as sugar-free increased from 2002-2014. Only 6% of barcoded beverages examined were classified as low-sugar in 2014; this did not significantly change from 2002.
We found that 4% of barcoded foods were low-sugar in 2014 and there was limited change from 2002 (-1%, p<.001). (Table 2) In 2014 the candy group had the largest absolute number of low-sugar products, however ready-to-eat cereal and flavored yogurts had the highest proportion of products that were categorized as low-sugar.
Percent of low-sugar and sugar-free products that contain different types of sweeteners
In 2002, among the top beverage sources of added sugar, 80% of barcoded sugar-free beverages contained only LCS. However, from 2002 through 2014, the percent of sugar-free beverages containing only LCS decreased (-6% p<.001) (Figure 1a). 81% of barcoded low-sugar beverages in our examined beverage groups contained CS-only and 11% contained LCS-only in 2002. In 2014, 15% of low-sugar beverages contained CS-only 16% contained LCS-only, and 68% contained both CS and LCS.
From 2002 to 2014, there were not significant changes in the percent of low-sugar foods in top food sources of added sugar that contained caloric sweeteners or LCS (Figure 1b)
Trends in household sugar-free and low-sugar purchases
In 2014, 69±0.1% of households purchased sugar-free beverages and 49±.1%
24
2) The percent of households that purchased low-sugar beverages declined from 48±0.4% to 24±0.3% in 2008, and then increased to 37±0.3% in 2014.
For the 3 top beverage sources of sugar, mean household-level purchases of sugar-free beverages increased from 25±0.2 % in 2002 to 31±0.2 % in 2007 (p<.001), and then declined slightly to 29±0.2% from 2007 to 2014. (Figure 3a) Trends in volume of sugar-free beverage purchases per capita per day increased from 2002 to 2006, but also declined slightly in the second half of the study period. (Supplemental Figure 1) In 2014,72±0.3% of sugar-free beverage purchases were sugar-sugar-free soft drinks and energy drinks. Low-sugar beverage purchases declined slightly from 2002-2014 (-2%, p<.001), and remained under 7% of beverage purchases from our examined beverage groups throughout the study period.
In 2014, low-sugar foods were 5±0.1 % of purchases in our examined food groups. Low-sugar food purchases did not substantially change from 2002 to 2014. (Figure 3b)
Ready to eat cereals were the largest contributor to low-sugar food purchases (32±0.3% of low-sugar food purchases in 2014).
The proportion of low-sugar and sugar-free purchases that contain different types of
sweeteners
25
offset by increases in the percent of sugar-free fruit drink, sports drinks and flavored water purchases containing LCS-only (23±0.7% to 55±0.5%, p<.001). There was also an increase in the proportion of sugar-free beverage purchases that were unsweetened between 2002 and 2014. There was a significant decline in purchases of CS sweetened low-sugar beverages from 2002 (89±.3%) to 2014 (24±.4%, p<.001). Low-sugar beverage purchases containing CS+LCS increased from 8±.3% in 2002 to 61±.1% in 2014 (p<.001).
While household-level purchases of low-sugar foods remained steady from 2000-2014, the mean percent of low-sugar food purchases that contained only caloric sweeteners declined, and the percent of low-sugar food purchases containing both caloric sweeteners and LCS increased. (Table 3) This trend is partially attributable to an increase in purchases of flavored yogurts sweetened with both types of sweeteners (3±0.3% to 59±0.6% from 2000-2014).
Discussion
26
top food sources of sugar remained at approximately 5% over the study period. However, we observed a decrease in purchases of low-sugar foods sweetened with only caloric sweeteners and an increase of low-sugar foods sweetened with both low-calorie and caloric sweeteners.
Our finding that there was an overall increase in sugar-free beverage purchases from 2002 to 2014 is consistent with studies of LCS-sweetened beverage purchases and
consumption, which our results indicate account for more than three quarters of sugar-free beverages purchased. 26,27 The increase in sugar-free beverage purchases occurred over the same period as the decline in consumption of sugar sweetened beverages and overall added sugars for the first time in decades. 24,113–115
27
In our examined beverage groups, there were a limited number of uniquely barcoded low-sugar beverages. Low-sugar beverage purchases declined slightly from 2002-14, but overall remained low. This matches an industry study which found low-calorie beverages only contributed 1.5% of the volume of household purchases, while no-calorie beverages made up 50.5% of beverage sales volume. This report defined low-calorie beverages as those with 5-40 calories per 8 oz (2.1-17 calories/100mL); dairy beverages were excluded in their analysis. Consumption studies separately examining low-sugar or low-calorie beverages are limited. Maurissa et al., found that the percent of U.S. children reported consuming low-calorie beverages increased from 1% to 11% from 2001-2010, while the percent consuming no-calorie beverages did not change. Mean total daily ounces of low-calorie beverages consumed also increased. However, this study defined low-calorie beverages as those with >5-<40 calories per labeled serving. Labelled servings are not standardized across beverages, and USDA food codes used in this study lack product specific nutrient information. A
consistent definition of low-sugar beverages is needed to generalize findings. We found that while LCS sweetened beverages accounted for the majority of sugar-free beverage purchases, there was a decline in the percent of sugar-free beverage purchases that were sweetened with LCS and an increase in the proportion that were unsweetened. This is consistent with Piernas et al., who observed declines from 2005 to 2010 in LCS beverages purchased by U.S.
households; however, this study did not examine unsweetened products. 27. This trend may reflect increasing public skepticism about the healthfulness of LCS noted by other
28
away from sugar-free soft drinks, and towards sugar-free products that are marketed as healthier, independent of ingredients. 116
U.S. household purchases of low-sugar foods remained low from 2002-14, representing 5% of food purchases from our examined groups. Our U.S. findings are consistent with global reports that reduced sugar foods remain a niche category within the food industry. 5 There may be lower consumer awareness about the amounts of added sugar in foods than in beverages, and hence less awareness about the need for low-sugar foods. Public efforts to reduce added sugar consumption have focused on sugary beverages, including sugar-sweetened beverage taxes, proposed large portion soda bans, and public marketing campaigns against their consumption. 8,45,117–119 Additionally, while the U.S. does not permit ‘low-sugar’ to be used on labels, ‘reduced sugar’ or other positive nutrient claims may be used on products that may not meet our low-sugar criteria. 57,86,116,120,121 We
examined low-sugar foods from groups that were top sources of sugar in the U.S. diet. Further research is needed to determine whether households purchase low-sugar foods from other food groups, such as granola and energy bars. The new U.S. nutrition facts panel includes a line for added sugars and is supposed to be implemented in 2018. 122 If
29
Although low-sugar food purchases remained stable, we observed shifts in the sweeteners used in the low-sugar foods purchased. Our study found a decline in sugar-sweetened low-sugar foods, which is consistent with trends observed across total food purchases. 65 The trend we observed towards LCS+CS sweetened foods as a percent of low-sugar food purchases (+9% grams purchased) was larger than the trends in previous studies across LCS sweetened foods as a percent of all foods purchased (+3% grams purchased). 27 This could be for a number of reasons. Further research is needed to better understand the extent to which changes in low-sugar products and changes in household preferences are driving the observed trends.
The proportion of barcoded beverages that were categorized as sugar-free increased from 2002-2014. These changes occurred over a time period when food and beverage manufacturers announced initiatives to improve the healthfulness of the products they manufacture, including by reducing calories from sugar. (3–5) As part of the previously mentioned commitment, PepsiCo pledged that at least two-thirds of the beverages in its portfolio will contain fewer than 100 calories per 12 ounces, with an increased focus on zero calorie products. 103 The proportion of low-sugar barcoded beverages in our examined food groups did not significantly change. Continued monitoring and evaluation are needed to determine whether the number of low- and no-sugar beverages will grow, or whether growth occurs in beverages higher in sugar.
30
serves many purposes, including providing structure and texture as well as enhancing shelf life. 49 A stated goal of the addition of added sugars to the nutrition facts panel is to
encourage food manufacturers to reformulate their products. Further monitoring is needed to determine if the number of low-sugar food products increases in future years. Whether there are changes in the number of low-sugar barcoded products in other food groups also merits further study.
31
total sugars, misclassification of low-sugar products was possible. Additionally, there is currently no universally accepted definition of a low-sugar product, and total sugars were used to define low-sugar products, because added sugar content is not currently required on nutrition labels. However, using total sugars has been found to be reasonable for nutrient profiling. 123 Furthermore our data only captures household level purchasing;
intra-household distribution of the foods is not known. While validation studies of the Homescan dataset have found that it is comparable to other commonly used economic datasets,
misreporting and selection bias due to study burden are possible. 99,124,125
Despite these limitations, our study also has several important strengths. Homescan captures barcoded products, which were linked to product-specific sugar content. This makes it possible to accurately classify low- and no-sugar products. In contrast, publicly available datasets lack brand specific and product-specific information, instead relying on aggregated estimates to determine the sugar content of each food item, making it difficult to accurately identify whether a product is ‘low-sugar.’ 14,15 Further, our dataset’s product specific
ingredients list makes it possible to accurately identify the presence and type of sweetener in low-sugar products. This allows us to examine low-sugar product and the sweeteners they contain without relying on consumer knowledge and recall of this information. Additionally, low- and no- sugar products are likely to be episodically consumed; capturing purchases year-round may therefore better capture usual intake compared to a single 24-hour recall.
32
manufacturers’ pledges to improve the healthfulness of the products they produce. Numerous efforts have been taken to reduce the sugar in household purchases by reformulating
33 33
Tables and Figures
Table 3.1. Classification of barcoded packaged foods and beverages as sugar-free and low-sugar, by presence of sweetener1
Food Group Sweetener type
Food and beverages included
Sugar-free beverages (total sugar 0g/100g) Low-sugar beverages Not Low-sugar beverages
Soft drinks and energy drinks
CS only Sparkling water None identified Soft drinks, energy drinks,
kombucha, tonic waters,
LCS only Diet soft drinks, diet energy drinks,
sparkling water, diet tonic water
Diet soft drinks, diet energy drinks, sparkling flavored water
Soft drinks, energy drinks, sparkling water with juice, sparkling juice drinks
CS + LCS Diet energy drinks Diet soft drinks, diet energy drinks,
sparkling flavored water
Soft drinks, energy drinks, sparkling juice drinks
Unsweetened Sparkling water, seltzer, club soda Sparkling flavored water Sparkling water with fruit juice
Fruit drinks2, sports drinks, and
flavored waters3
CS only None identified
Flavored water, maple water Sports drinks, fruit drinks, vegetable
drinks, combined fruit/vegetable drinks, flavored water, tonic water
LCS only Diet sports drinks, flavored water, coconut
water
Flavored water Fruit drinks, vegetable drinks,
flavored water
CS + LCS Flavored water
Low-calorie sports drinks, aloe water, flavored water, diet energy drinks
Sports drinks, flavored water, energy drinks, smoothie mixes, fruit drinks, combined fruit/vegetable drinks,
Unsweetened Flavored water, unflavored mineral water,
aloe vera juice
Coconut milk, Kraut juice Fruit drinks, combined
fruit/vegetable drinks
Ready-to-drink teas
CS only Unflavored tea Kombucha, flavored tea, unflavored tea Sweet tea, half tea/half lemonade
(or other fruit flavors), flavored tea
LCS only
Flavored tea, unflavored tea, half tea/half lemonade (or other fruit flavors)
Half tea/half lemonade, flavored tea Half tea/half lemonade (or other
fruit flavors), flavored tea, tea with caffeine
CS + LCS
Unflavored tea, flavored tea, half tea/half lemonade (or other fruit flavors)
Kombucha, unflavored tea, flavored tea Sweet tea, flavored tea, tea with
caffeine, flavored tea, half tea/half lemonade, (or other fruit flavors)
Unsweetened Unflavored tea, flavored tea None identified Kombucha, tea flavored with fruit
34
Food Group Sweetener type
Food and beverages included
Low-sugar foods (total sugar ≤5g/100g) Not Low-sugar foods
Candy
CS only
Mints Chocolate bars and pieces, hard
candy, gummy candy, chocolate coated candies (e.g. peanut butter cups, candy bars).
LCS only Mints; chocolate bars, hard candy, gummy
candy, and licorice
Chocolate bars
CS + LCS Chocolate bars, chocolate pieces, mints Caramel, toffee, gummy candy,
licorice, hard candy
Unsweetened None identified None identified
Grain-based desserts
CS only Croissants, puff pastry cups, crumpet,
mousse cake
Cakes, pies, cookies, rolls, toaster pastries, doughnuts, strudels
LCS only Cookies, cakes, cupcake, brownie,
muffins
None identified
CS + LCS Muffin tops, carrot cake, cookies, cakes,
pies
Muffin tops, scones, cookies, cakes, pies
Unsweetened Cookies, crumpets Mochi, fig ‘cake’
Dairy-based desserts
CS only
None identified Ice cream, ice cream cake, frozen
yogurt, cheesecake, pudding, custard
LCS only Ice cream, pudding, rice pudding,
cheesecake
Ice cream
CS + LCS
Pudding Ice cream, frozen yogurt, dairy free
frozen desserts, sherbet, ice cream cake
Unsweetened None identified None identified
Flavored yogurt4
CS only
Regular5 yogurts Greek yogurt, regular yogurt,
non-dairy yogurt substitute (soy, coconut, almond)
LCS only Greek yogurt, regular yogurt Regular yogurt
CS + LCS
Greek yogurt, regular yogurt, non-dairy yogurt substitute
35
Food Group Sweetener type
Food and beverages included
Unsweetened
Kefir, non-dairy yogurt substitute, Greek yogurt
Goat milk yogurt, sheep milk yogurt, non-dairy yogurt substitute (soy)
Ready-to-Eat Cereal
CS only
Oat rings, whole grain flakes, crispy rice cereal
Flakes, clusters, loops, frosted cereals, granola, cereal with candy pieces (e.g. marshmallows)
LCS only Corn bran, wheat fiber cereal None identified
CS + LCS None identified Shredded wheat, granola, whole
grain corn cereal, O’s, flakes
Unsweetened Shredded wheat, puffed rice, puffed corn Seed, grain and fruit cereal; muesli,
granola, multigrain squares
1 Beverage and food types may appear in multiple categories. This is because similar products from different brands or different flavors may have different
amounts of sugar. For example, brand A fruit drink may contain LCS and have 0g of sugar, while brand B fruit drink may have 14g of sugar and contain CS.
2 Fruit drinks are defined as beverages primarily composed of sugar or sweetener (as 1st or 2nd ingredients) with fruit juice or fruit juice concentrate as a lesser
ingredient.
3 Flavored waters are defined as beverages that contain flavors but no fruit juice or fruit juice concentrate.
4 Flavored yogurts are defined as yogurts that contain some type of flavoring; plain unflavored yogurt is not included.
5 Regular, as opposed to Greek style yogurt
CS= caloric sweetener, LCS= low-calorie sweetener
36
Table 3.2: Number and proportion of products categorized as sugar-free and low-sugar, by food and beverage group, Homescan 2002-20141
2002 2008 2014
Product Group Sugar-free Low-Sugar
non-LS Sugar-free Low-Sugar
non-LS Sugar-free Low-Sugar
non-LS
n % n % n n % n % n n % n % n
Soft drinks and
energy drinks 1828 29% 121 2% 4393 2424 34%* 62 1% 4579 2894 37%* 440 6% 4518
Fruit drinks, sports drinks, and flavored waters
143 5% 121 4% 2474 350 10%* 177 5% 2996 401 11%* 251 7% 2919
Ready-to- drink
tea 75 18% 28 7% 308 242 25%* 41 4% 696 328 24%* 103 8% 935
Beverage group
total3 2046 22% 270 3% 7175 3016 26%* 280 2% 8271 3623 28%* 794 6% 8372
Grain-based
desserts 173 2% 7656 277 3%* 10124 321 3%* 11334
Candy 513 7% 6576 777 7% 10463 608 5%* 11662
Flavored yogurt 53 4% 1166 111 5% 1987 175 6% 2884
Dairy-based
desserts 131 3% 3619 169 3% 4861 198 4% 5276
Ready-to-eat
cereal 280 10% 2396 278 7%* 3949 255 7% 3568
Food group
total4 1150 5% 21413 1612 5% 31384 1557 4%* 34724
Total5 3466 11% 28588 4908 11% 39935 5974 14%* 43096
1 Number and proportion of products with unique barcodes classified as low-sugar. Foods with sugar ≤5g/100g and beverages with sugar 0g/100g were defined as low-sugar. Products have unique barcodes because they are different products, or because they are the same product with different package sizes, different flavors, or have seasonal or promotional packaging.
37
4 Total of selected food groups. Food groups selected are top food sources of added sugar. 5 Total of all selected food and beverage groups.
LS= low-sugar
*Significant compared to the same category in 2002, two sample test of proportions. P<.001
Data from the 2002-2014 Nielsen Homescan longitudinal panel of household purchases of consumer packaged foods.
38
Figure 3.1. Proportion of no- and low-sugar products that contain different types of sweeteners in key food and beverage sources of sugar, Homescan 2002-20141
1The percent of uniquely barcoded (A) no- and low-sugar beverages and (B) low-sugar foods that contain caloric sweeteners (CS), low-calorie sweeteners (LCS), both, or none (unsweetened). Barcoded low-sugar products from our 8 examined food and beverage categories were placed into mutually exclusive categories by sweetener presence. The number of barcoded products in each sweetener category was divided by the total number of barcoded (a) no- or low-sugar beverages and (b) low-sugar foods in that year. Low-calorie sweeteners were defined as those with < 3.8kcal/g, or that were used in such small quantities they contributed negligible calories. No-sugar beverages and low-sugar beverages were defined as all beverages with 0g and >0-2.5g of sugar, respectively, in examined groups (soft drinks and energy drinks; fruit drinks, sports drinks, and flavored waters; and ready-to-drink teas). Low sugar foods were defined as all foods with ≤5g/100g of sugar in examined groups (grain-based desserts, dairy-based desserts, candy, flavored yogurts, and ready-to-eat cereal.)
* Significant compared to the same category in 2002, two sample test of proportions, P<0.001
Data from the 2002-2014 Nielsen Homescan longitudinal panel of household purchases of consumer packaged foods.
Source: University of North Carolina calculation based in part on data reported by Nielsen through its Homescan Services for all food categories, including beverages and alcohol for the 2002-2014 periods across the U.S. market. © The Nielsen Company, 2015.
4%
81%
3%* 16% 2%* 15%
80% 11% 80%* 24% 74%* 16% 0% 7% 2%* 58% 1%* 68% 16% 1% 15%* 3% 22%* 2% 0% 10% 20% 30% 40% 50% 60% 70% 80% 90% 100%
Sugar-free Low-sugar Sugar-free Low-sugar Sugar-free Low-sugar
2002 2008 2014
% L S b ev era ge U PCs
A. B
41%
23%* 26%*
19%
28%* 25%*
20% 35%* 38%*
19% 14%* 11%*
0% 10% 20% 30% 40% 50% 60% 70% 80% 90% 100%
2000 2008 2014
% LS Fo o d UP Cs
39
Figure 3.2. Weighted percent of U.S. households that purchased no-sugar beverages, low-sugar beverages and low-sugar foods, Homescan 2002-20141
1Unadjusted proportions of households that purchased ≥1 serving/week of no-sugar beverages, low- sugar beverages, and low-sugar foods (%
households) were calculated for each year and weighted to be nationally representative. One serving was defined as 50g for food and 100mL for beverages. No-sugar beverages and low-sugar beverages were defined as all beverages with 0g and >0-2.5g of sugar, respectively, in examined groups (soft drinks and energy drinks; fruit drinks and flavored waters; and ready-to-drink teas). Low-sugar foods were defined as all foods with ≤5g/100g of sugar in examined groups (grain-based desserts, dairy-based desserts, candy, flavored yogurts, and ready-to-eat cereal).
* Significant linear trend, determined using survey-weighted logistic regression. P<0.001 to account for sample size Data from the 2002-2014 Nielsen Homescan longitudinal panel of household purchases of consumer packaged foods.
Source: University of North Carolina calculation based in part on data reported by Nielsen through its Homescan Services for all food categories, including beverages and alcohol for the 2002-2014 periods across the U.S. market. © The Nielsen Company, 2015.
0% 10% 20% 30% 40% 50% 60% 70% 80% 90%
2002 2003 2004 2005 2006 2007 2008 2009 2010 2011 2012 2013 2014
%
Hou
seh
o
ld
s p
u
rc
h
asi
n
g
Sugar-free Beverages Low-sugar Foods Low-sugar beverages
*
40
Figure 3.3. Weighted mean household no- and low-sugar beverage and low-sugar food purchases from top food and beverage group sources of added sugars, Homescan 2002-2014.1
1Weighted unadjusted mean household purchases of (A) No- and low-sugar beverages (% mL) and (B) low-sugar foods (% grams) from examined beverage and food groups. Means were weighted to be nationally representative. No- and low-sugar beverage purchases (mL) were examined as a percent of all beverage purchases (mL) from examined beverage groups (soft drinks and energy drinks; fruit drinks, sports drinks, and flavored waters; and ready-to-drink teas) in each year. Low-sugar food purchases (g) were examined as a percent of all food purchases (g) from examined food groups (Grain-based desserts, dairy-based desserts, candy, flavored yogurts, and ready-to-eat cereal) in each year. No-sugar and low-sugar beverages were defined as all beverages with 0g and >0-2.5g of sugar in examined groups, respectively, and low-sugar foods were defined as all foods with ≤5g/100g of sugar in examined groups.
* Significant linear trend, determined using survey-weighted linear regression. P<0.001 to account for sample size Data from the 2002-2014 Nielsen Homescan longitudinal panel of household purchases of consumer packaged foods.
Source: University of North Carolina calculation based in part on data reported by Nielsen through its Homescan Services for all food categories, including beverages and alcohol for the 2002-2014 periods across the U.S. market. © The Nielsen Company, 2015.
BEVERAGES FOODS
41
Table 3.3: Weighted mean percent of sugar-free and low-sugar purchases that contain low-calorie sweetener (LCS), caloric sweetener (CS), both or none, by food and beverage group Homescan 2002-20141
2002 2014
CS LCS CS+LCS None CS LCS CS+LCS None
Mean(SE)
Sugar-free Soft drinks and
energy drinks 7(.2) 90(.2) 0(.0) 3(.1)
2(.1)* 89(.2)* 0(.0) 9(.2)*
Sugar-free Fruit drinks, sports
drinks, and flavored waters 8(.4) 23(.7) 1(.2) 68(.7) 3(.2)* 55(.5)* 11(.3)* 31(.5)* Sugar-free Ready to drink tea 8(.7) 72(1.2) 6(.8) 15(.9) 5(.3)* 67(.6)* 5(.3)* 24(.5)*
Sugar-free Beverage group
total2 7% 81% 0% 11% 3% 78% 3% 16%
LS Soft drinks and energy
drinks 98(0.1) 2(0.1) 0(0.1) 0(0) 29(0.5)* 11(0.4)* 59(0.6)* 1(0.1)*
LS Fruit drinks, sports drinks,
and flavored waters 59(1) 2(0.3) 39(1) 0(0.1) 17(0.5)* 13(0.5)* 69(0.7)* 1(0.3) LS Ready to drink tea 48(2.5) 19(1.8) 32(2.6) 0(0) 8(1)* 48(1.3)* 44(1.3)* 0 (0)
LS Beverage group total2 89(.3) 2(.1) 8(.3) 0(0) 24(.4)* 14(.3)* 61(.1)* 1(.1)*
LS Grain-based desserts 58(.7) 7(.4) 35(.7) 0(.1) 48(.9)* 13(.6)* 32(.7)* 7(.4) *
LS Candy 30(.6) 40(.6) 30(.6) 0(.1) 39(.5)* 30(.4)* 30(.4)* 1(.1)*
LS Flavored yogurt 17(.6) 75(.6) 3(.3) 5(.3) 4(.3)* 37(.6)* 59(.6)* 0(.0)*
LS Dairy-based desserts 25(.8) 3(.2) 72(.8) 0(.0) 5(.2)* 8(.3)* 83(.4)* 5(.2)* LS Ready-to-eat cereal 73(.4) 4(.2) 1(.1) 22(.4) 82(.3)* 3(.2)* 0(.0)* 15(.3)*
LS food group total3 50% 22% 19% 9% 41% 22% 38% 7%
1 Weighted unadjusted mean percent of no- and low-sugar product purchases in each category that contain low-calorie sweetener (LCS), caloric
sweetener (CS), both or none (unsweetened). Means are weighted to be nationally representative. Percentages were calculated as the grams of household purchases from no- or low-sugar products containing each type of sweetener divided by total grams of no- or low-sugar product purchased, respectively, from that food or beverage group. Values are expressed as mean (SE).
3 Total of selected beverage groups. Beverage groups selected are top beverage sources of added sugar. 4 Total of selected food groups. Food groups selected are top food sources of added sugar.
42
Data from the 2002-2014 Nielsen Homescan longitudinal panel of household purchases of consumer packaged goods.
Source: University of North Carolina calculation based in part on data reported by Nielsen through its Homescan Services for all food categories, including beverages and alcohol for the 2002-2014 periods across the U.S. market. © The Nielsen Company, 2015.
Table 3.4: Sociodemographic characteristics of U.S. households participating in the 2002-2014 Homescan Panel1
2002 2004 2006 2008 2010 2012 2014 Total
Household characteristics
n %2
Race/ethnicity3
Non-Hispanic white 28,769 73% 28,624 72% 45,306 71% 45,523 71% 44,987 69% 44,268 68% 44,862 68% 529,373 70%
Non-Hispanic black 3,587 12% 3,461 12% 4,840 12% 5,003 12% 5,059 12% 5,356 13% 5,738 13% 61,522 12%
Hispanic 2,191 10% 2,312 11% 3,010 11% 2,872 12% 2,962 12% 2,933 13% 3,150 13% 36,199 12%
Non-Hispanic Other 1,287 5% 1,362 5% 2,227 6% 2,335 6% 2,595 6% 2,769 6% 2,922 7% 28,854 6%
Income4
<185% FPL 6,082 26% 6,792 27% 10,573 27% 10,428 27% 10,572 29% 12,091 30% 12,128 28% 127,976 28%
185%-<400% FPL 16,131 35% 14,768 33% 21,955 32% 24,178 35% 24,950 37% 23,035 35% 24,999 36% 280,431 35%
≥400% FPL 13,621 39% 14,199 40% 22,855 41% 21,127 38% 20,081 34% 20,200 36% 19,545 36% 247,541 38%
Head of Household Education5
Less than high school diploma
913 11% 761 8% 963 8% 861 7% 743 6% 757 7% 743 7% 2%
Graduated high school 7,445 19% 7,257 18% 10,302 17% 10,137 16% 9,650 15% 9,049 14% 10,602 16% 119,442 16%
Some College 11,547 31% 11,307 31% 17,471 30% 16,757 28% 16,297 28% 16,160 28% 16,397 28% 198,269 29%
Graduate College 10,746 31% 11,046 32% 18,144 34% 18,933 36% 19,544 37% 19,855 38% 19,018 35% 221,193 35%
Post College graduate 5,261 16% 5,456 16% 8,598 17% 9,129 18% 9,447 18% 9,566 19% 9,972 19% 107,315 18%
Household Composition
Single adult, no
children6
9,485 26% 9,761 26% 13,476 26% 14,363 27% 14,432 26% 13,846 27% 14,285 27% 168,022 27%
Single adult, with children
43
43
Multiple adults, no children
15,744 41% 16,449 41% 25,845 41% 26,744 41% 27,750 43% 28,493 43% 28,975 43% 319,239 42%
Multiple adults, with children
9,480 30% 8,603 30% 14,577 30% 13,319 29% 12,285 28% 12,079 28% 12,343 27% 153,816 29%
1 Data from the 2002-2014 Nielsen Homescan longitudinal panel of household purchases of consumer packaged goods. 2 Percentages of households weighted to be nationally representative
3 Race/ethnicity self-reported by head of household
4 Income calculated as a percent of the Federal Poverty Limit (% FPL)
5 Highest level of education self-reported by male or female head of household
Data from the 2002-2014 Nielsen Homescan longitudinal panel of household purchases of consumer packaged goods.
44
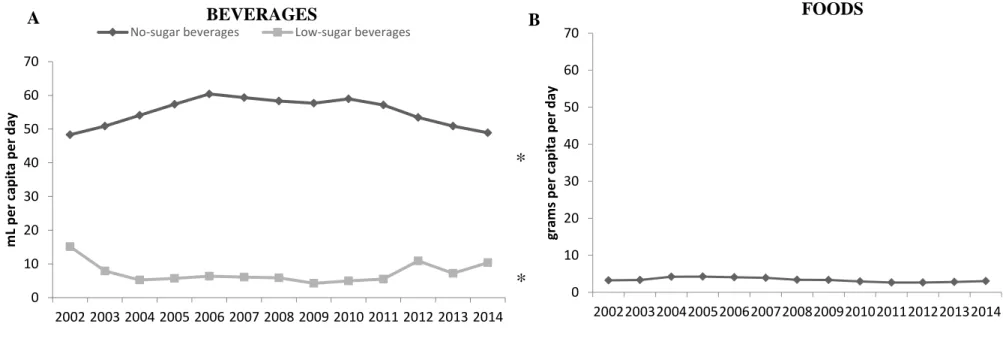
Figure 3.4: Weighted mean no- and low-sugar beverage and low- sugar food purchases per capita per day, Homescan 2002-20141
1 Unadjusted weighted means of U.S. household (A) Sugar-free and low-sugar beverage purchases (mL per capita per day) and (B) low-sugar food (g per capita per day) purchases. Sugar-free beverages were defined as all beverages with 0g of sugar, and low-sugar beverages were defined as those with sugar >0g – 2.5g/100mL, in examined groups (soft drinks and energy drinks; fruit drinks and flavored waters; and ready-to-drink teas). Low-sugar foods were defined as all foods with ≤5g/100g of sugar in examined groups (grain-based desserts, dairy-based desserts, candy, flavored yogurts, and ready-to-eat cereal.) Weighted to be nationally representative.
* Significant linear trend, determined using survey-weighted linear regression. P<0.001 to account for sample size Data from the 2002-2014 Nielsen Homescan longitudinal panel of household purchases of consumer packaged goods.
Source: University of North Carolina calculation based in part on data reported by Nielsen through its Homescan Services for all food categories, including beverages and alcohol for the 2002-2014 periods across the U.S. market. © The Nielsen Company, 2015.
A BEVERAGES B FOODS
*
0 10 20 30 40 50 60 70 2002200320042005200620072008200920102011201220132014 gr am s p e r cap ita p e r d ay 0 10 20 30 40 50 60 702002 2003 2004 2005 2006 2007 2008 2009 2010 2011 2012 2013 2014
m L p e r cap ita p e r d ay
No-sugar beverages Low-sugar beverages